Enjoy complimentary customisation on priority with our Enterprise License!
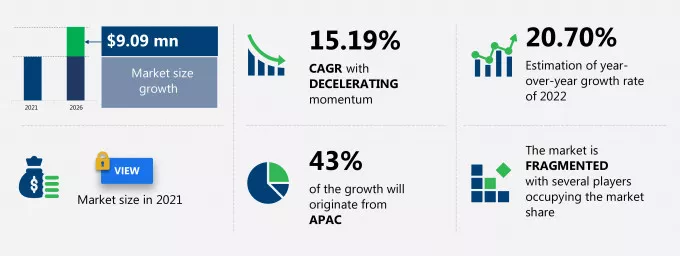
The payment as a service market share is expected to increase by USD 9.09 million from 2021 to 2026, at a CAGR of 15.19%.
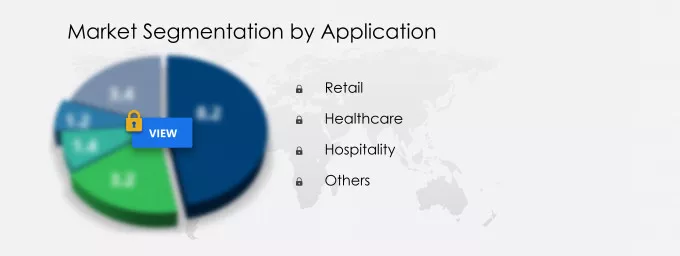
This payment as a service market research report provides valuable insights on the post COVID-19 impact on the market, which will help companies evaluate their business approaches. Furthermore, this report extensively covers payment as a service market segmentation by application (retail, healthcare, hospitality, and others) and geography (APAC, Europe, North America, South America, and MEA). The payment as a service market report also offers information on several market vendors, including Agilysys Inc., Aurus Inc., First American Payment Systems L.P., Fidelity National Information Services Inc., Fiserv Inc., Helcim Inc., Ingenico Group SA, Paysafe Ltd., Total System Services LLC, and VeriFone Inc. among others.
Download the Free Report Sample to Unlock the Payment as a Service Market Size for the Forecast Period and Other Important Statistics
The high adoption of contactless payment solutions is notably driving the payment as a service market growth, although factors such as lack of awareness for online payment in developing economies may impede the market growth. Our research analysts have studied the historical data and deduced the key market drivers and the COVID-19 pandemic impact on the payment as a service industry. The holistic analysis of the drivers will help in deducing end goals and refining marketing strategies to gain a competitive edge.
Key Payment as a Service Market Driver
One of the key factors driving growth in the payment as a service market is the high adoption of contactless payment solutions. The introduction of mobile payment as a service, such as Apple Pay, Samsung Pay, and Android Pay, has simplified the process of paying bills. Customers are no longer required to carry credit or debit cards. The increased adoption of mobile devices and wearables has popularized the use of mobile payments. Many retailers are adopting platforms like NFC POS terminals that facilitate mobile payments. NFC POS terminals also boost the value and effectiveness of a retailer's marketing efforts. The process of streamlining operations helps retailers generate more revenue. Retailers worldwide realize the benefits of NFC POS terminals and are aligning them with their operations and processes to enhance the overall relationship between their respective brands and customers. The growing adoption of NFC-enabled mobile payment solutions is expected to drive the market during the forecast period.
Key Payment as a Service Market Trend
The rise in mobile biometrics for payment is another factor supporting the payment as a service market share growth. As per the current market scenario, the use of mobile devices for conducting financial and payment-as-a-service transactions has increased significantly. Thus, this increasing trend leads to the rapid innovation of biometrics technologies such as fingerprint recognition, voice recognition, iris recognition, signature recognition, keystroke recognition, and facial recognition. These biometric technologies are being integrated into mobile devices. These technologies will ensure authorized access to personal data. This will increase the prevention of any fraudulent activities in monetary transactions. Additionally, multimodal biometrics are being used on mobile devices for individual identification and verification. This technology is being used for making mobile payments in the retail sector more secure and safe.
Key Payment as a Service Market Challenge
The lack of awareness for online payment in developing economies will be a major challenge for the payment as a service market during the forecast period. The increasing demand for online payments is still in its development stage in many developing economies. Customers are unaware of the benefits, hindering the market growth for the e-commerce payment market. Mobile payment is still less known in these developing regions, even though internet penetration is high in certain countries. Several developing countries around the globe lack the essential telecom infrastructure to support mobile payments. LTE technology is still in its developing stage in these Asian countries. Still, its adoption in these countries has been modest. These technologies are an important component of network infrastructure to ensure error-free and uninterrupted telecom services. Lack of availability of these mobile payment transactions could hinder the penetration of the e-commerce payment market in these regions.
This payment as a service market analysis report also provides detailed information on other upcoming trends and challenges that will have a far-reaching effect on the market growth. The actionable insights on the trends and challenges will help companies evaluate and develop growth strategies for 2022-2026.
Technavio categorizes the global payment as a service market as a part of the global information technology spending market. Our research report has extensively covered external factors influencing the parent market growth potential in the coming years, which will determine the levels of growth of the payment as a service market during the forecast period.
The report analyzes the market's competitive landscape and offers information on several market vendors, including:
This statistical study of the payment as a service market encompasses successful business strategies deployed by the key vendors. The payment as a service market is fragmented and the vendors are deploying organic and inorganic growth strategies to compete in the market.
Agilysys Inc. - The company offers Agilysys pay for property management, point of sale, payment solution, and various other purposes.
To make the most of the opportunities and recover from post COVID-19 impact, market vendors should focus more on the growth prospects in the fast-growing segments, while maintaining their positions in the slow-growing segments.
The payment as a service market forecast report offers in-depth insights into key vendor profiles. The profiles include information on the production, sustainability, and prospects of the leading companies.
Our report provides extensive information on the value chain analysis for the payment as a service market, which vendors can leverage to gain a competitive advantage during the forecast period. The end-to-end understanding of the value chain is essential in profit margin optimization and evaluation of business strategies. The data available in our value chain analysis segment can help vendors drive costs and enhance customer services during the forecast period.
The value chain of the information technology spending market includes the following core components:
The report has further elucidated on other innovative approaches being followed by service providers to ensure a sustainable market presence.
For more insights on the market share of various regions Request for a FREE sample now!
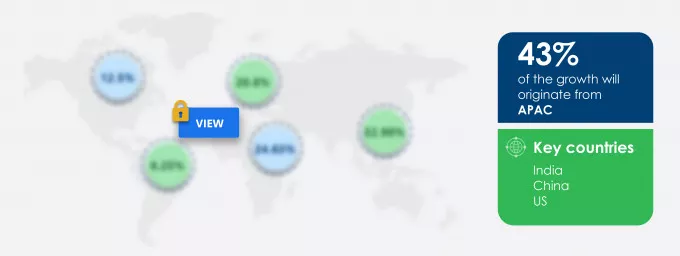
43% of the market's growth will originate from APAC during the forecast period. India, China, and South Korea (Republic of Korea) are the key markets for payment as a service in APAC. Market growth in this region will be faster than the growth of the market in the European, North American and South American regions.
The increased adoption of payment as a service solution will facilitate the payment as a service market growth in APAC over the forecast period. This market research report entails detailed information on the competitive intelligence, marketing gaps, and regional opportunities in store for vendors, which will assist in creating efficient business plans.
COVID Impact and Recovery Analysis
The region was affected by the outbreak of COVID-19 in the first half of 2020. Several countries such as India, Japan, China, and Australia were negatively affected by the pandemic in 2020. During the lockdown phase, people preferred purchasing items from e-commerce websites, which acted as a catalyst for the e-commerce payment market in the region. Many e-commerce companies were accepting only digital payments instead of currency notes to avoid physical contact. Moreover, in March 2020, to control the spread of COVID-19, the Reserve Bank of India instructed people in India to use digital payment infrastructures. These factors can influence market growth in the region during the forecast period.
To gain further insights on the market contribution of various segments Request for a FREE sample
The payment as a service market share growth by the retail segment will be significant during the forecast period. The retail sector is opting for more feature-rich and secure e-commerce payment applications to meet the growing demand in the market. Vendors are acquiring additional software or resources to customize their offerings to remain competitive in the e-commerce payment market. As per the growing trend and consumer behavior, the demand for customized options with ease in usability is increasing, which is increasing the overall complexity of the software development and deployment process.
This report provides an accurate prediction of the contribution of all the segments to the growth of the payment as a service market size and actionable market insights on post COVID-19 impact on each segment.
|
Payment as a Service Market Scope |
|
|
Report Coverage |
Details |
|
Page number |
120 |
|
Base year |
2021 |
|
Forecast period |
2022-2026 |
|
Growth momentum & CAGR |
Decelerate at a CAGR of 15.19% |
|
Market growth 2022-2026 |
$ 9.09 million |
|
Market structure |
Fragmented |
|
YoY growth (%) |
20.70 |
|
Regional analysis |
APAC, Europe, North America, South America, and MEA |
|
Performing market contribution |
APAC at 43% |
|
Key consumer countries |
India, China, US, UK, and South Korea (Republic of Korea) |
|
Competitive landscape |
Leading companies, Competitive strategies, Consumer engagement scope |
|
Key companies profiled |
Agilysys Inc., Aurus Inc., First American Payment Systems L.P. , Fidelity National Information Services Inc., Fiserv Inc., Helcim Inc., Ingenico Group SA, Paysafe Ltd., Total System Services LLC, and VeriFone Inc. |
|
Market dynamics |
Parent market analysis, Market growth inducers and obstacles, Fast-growing and slow-growing segment analysis, COVID-19 impact and recovery analysis and future consumer dynamics, Market condition analysis for the forecast period |
|
Customization purview |
If our report has not included the data that you are looking for, you can reach out to our analysts and get segments customized. |
We can help! Our analysts can customize this report to meet your requirements. Get in touch
***1. Executive Summary
***2. Market Landscape
**2.1 Market ecosystem
*Exhibit 01: Parent market
*Exhibit 02: Market Characteristics
**2.2 Value Chain Analysis
***3. Market Sizing
**3.1 Market definition
*Exhibit 03: Offerings of vendors included in the market definition
**3.2 Market segment analysis
*Exhibit 04: Market segments
**3.3 Market size 2020
**3.4 Market outlook: Forecast for 2020 - 2025
*3.4.1Estimating growth rates for emerging and high-growth markets
*3.4.2 Estimating growth rates for mature markets
*Exhibit 05: Global - Market size and forecast 2020 - 2025 (million $)
*Exhibit 06: Global market: Year-over-year growth 2020 - 2025 (%)
***4. Five Forces Analysis
**4.1 Five Forces Summary
*Exhibit 07: Five forces analysis 2020 & 2025
**4.2 Bargaining power of buyers
*Exhibit 08: Bargaining power of the buyer
**4.3 Bargaining power of suppliers
*Exhibit 09: Bargaining power of the supplier
**4.4 Threat of new entrants
*Exhibit 10: Threat of new entrants
**4.5 Threat of substitutes
*Exhibit 11: Threat of substitutes
**4.6 Threat of rivalry
*Exhibit 12: Threat of rivalry
**4.7 Market condition
*Exhibit 13: Market condition - Five forces 2020
***5. Market Segmentation by Application
**5.1 Market segments
*Exhibit 14 :Application- Market share 2020-2025 (%)
**5.2 Comparison by Application
*Exhibit 15: Comparison by Application
**5.3 Retail - Market size and forecast 2021-2026
*Exhibit 16: Retail - Market size and forecast 2020-2025 ($ million)
*Exhibit 17: Retail - Year-over-year growth 2020-2025 (%)
**5.4 Healthcare - Market size and forecast 2021-2026
*Exhibit 18: Healthcare- Market size and forecast 2020-2025 ($ million)
*Exhibit 19: Healthcare - Year-over-year growth 2020-2025 (%)
**5.5 Hospitality - Market size and forecast 2021-2026
*Exhibit 20: Hospitality - Market size and forecast 2020-2025 ($ million)
*Exhibit 21: Hospitality - Year-over-year growth 2020-2025 (%)
**5.6 Other sports - Market size and forecast 2020-2025
*Exhibit 22: Other sports - Market size and forecast 2020-2025 ($ million)
*Exhibit 23: Other sports - Year-over-year growth 2020-2025 (%)
**5.7 Market opportunity by Application
*Exhibit 24: Market opportunity by Application
***6. Customer landscape
*Technavio’s customer landscape matrix comparing Drivers or price sensitivity, Adoption lifecycle, importance in customer price basket, Adoption rate and Key purchase criteria
*Exhibit 25: Customer landscape
***7. Geographic Landscape
**7.1 Geographic segmentation
*Exhibit 26: Market share by geography 2020-2025 (%)
**7.2 Geographic comparison
*Exhibit 27: Geographic comparison
**7.3 APAC - Market size and forecast 2020-2025
*Exhibit 28: APAC - Market size and forecast 2020-2025 ($ million)
*Exhibit 29: APAC - Year-over-year growth 2020-2025 (%)
**7.4 Europe - Market size and forecast 2020-2025
*Exhibit 30: Europe - Market size and forecast 2020-2025 ($ million)
*Exhibit 31: Europe - Year-over-year growth 2020-2025 (%)
**7.5 North America - Market size and forecast 2020-2025
*Exhibit 32: North America - Market size and forecast 2020-2025 ($ million)
*Exhibit 33: North America - Year-over-year growth 2020-2025 (%)
**7.6 South America - Market size and forecast 2020-2025
*Exhibit 34: South America - Market size and forecast 2020-2025 ($ million)
*Exhibit 35: South America - Year-over-year growth 2020-2025 (%)
**7.7 MEA - Market size and forecast 2020-2025
*Exhibit 36: MEA - Market size and forecast 2020-2025 ($ million)
*Exhibit 37: MEA - Year-over-year growth 2020-2025 (%)
**7.8 Key leading countries
*Exhibit 38: Key leading countries
**7.9 Market opportunity by geography
*Exhibit 39: Market opportunity by geography ($ million)
***8. Drivers, Challenges, and Trends
**8.1 Market drivers
*8.1.1 High adoption of contactless payment solutions
*8.1.2 High explosion of smartphones
*8.1.3 Worldwide initiatives for the promotion of payments services
**8.2 Market challenges
*8.2.1 Lack of awareness for online payment in developing economies
*8.2.2 Absence of global standards for cross-border payments
*8.2.3 Lack of digital literacy in emerging economies and concerns regarding cyber attacks
*Exhibit 40: Impact of drivers and challenges
**8.3 Market trends
*8.3.1 Rise in mobile biometrics for payment
*8.3.2 Rising need to provide better customer experience
*8.3.3 Adoption of multi-factor authentication
***9. Vendor Landscape
*Exhibit 41: Vendor landscape
**9.1 Landscape disruption
*Exhibit 42: ?Landscape disruption?
*Exhibit 43: Industry Risk
***10. Vendor Analysis
**10.1 Vendors Covered
*Exhibit 44: Vendor Landscape
**10.2 Market positioning of vendors
*Exhibit 45: ?Market positioning of vendors?
**10.3 Agilysys Inc.
*Exhibit 46: Agilysys Inc. - Overview
*Exhibit 47: Agilysys Inc. - Product and service
*Exhibit 48: Agilysys Inc. - Key offerings
**10.4 Aurus Inc.
*Exhibit 49: Aurus Inc. - Overview
*Exhibit 50: Aurus Inc. - Product and service
*Exhibit 51: Aurus Inc. - Key offerings
**10.5 First American Payment Systems L.P.
*Exhibit 52: First American Payment Systems L.P. - Overview
*Exhibit 53: First American Payment Systems L.P. - Product and service
*Exhibit 54: First American Payment Systems L.P. - Key offerings
**10.6 Fidelity National Information Services Inc.
*Exhibit 55: Fidelity National Information Services Inc. - Overview
*Exhibit 56: Fidelity National Information Services Inc. - Business segments
*Exhibit 57: Fidelity National Information Services Inc. - Key offerings
*Exhibit 58: Fidelity National Information Services Inc. - Segment focus
**10.7 Fiserv Inc.
*Exhibit 59: Fiserv Inc. - Overview
*Exhibit 60: Fiserv Inc. - Business segments
*Exhibit 61: Fiserv Inc. - Key offerings
*Exhibit 62: Fiserv Inc. - Segment focus
**10.8 Helcim Inc.
*Exhibit 63: Helcim Inc. - Overview
*Exhibit 64: Helcim Inc. - Product and service
*Exhibit 65: Helcim Inc. - Key offerings
**10.9 Ingenico Group SA
*Exhibit 66: Ingenico Group SA - Overview
*Exhibit 67: Ingenico Group SA - Business segments
*Exhibit 68: Ingenico Group SA - Key offerings
*Exhibit 69: Ingenico Group SA - Segment focus
**10.10 Paysafe Ltd.
*Exhibit 70: Paysafe Ltd. - Overview
*Exhibit 71: Paysafe Ltd. - Business segments
*Exhibit 72: Paysafe Ltd. - Key offerings
*Exhibit 73: Paysafe Ltd. - Segment focus
**10.11 Total System Services LLC
*Exhibit 74: Total System Services LLC - Overview
*Exhibit 75: Total System Services LLC - Product and service
*Exhibit 76: Total System Services LLC - Key offerings
**10.12 VeriFone Inc.
*Exhibit 77: VeriFone Inc. - Overview
*Exhibit 78: VeriFone Inc. - Product and service
*Exhibit 79: VeriFone Inc. - Key offerings
***11. Appendix
**11.1 Scope of the report
*11.1.1 ????Market definition
*11.1.2 ????Objectives
*11.1.3 ????Notes and caveats
**11.2 Currency conversion rates for US$
*Exhibit 80: ?Currency conversion rates for US$?
**11.3 Research Methodology
*Exhibit 81: ?Research Methodology
*Exhibit 82: ??Validation techniques employed for market sizing?
*Exhibit 83: ??Information sources
**11.4 List of abbreviations
*Exhibit 84: List of abbreviations
Get lifetime access to our
Technavio Insights


