Personal Care Ingredients Market Analysis, Size, and Forecast 2026-2030: APAC (China, Japan, and India), Europe (Germany, France, and UK), North America (US, Canada, and Mexico), South America (Brazil, Argentina, and Colombia), Middle East and Africa (South Africa, Saudi Arabia, and UAE), and Rest of World (ROW)

Personal Care Ingredients Market Analysis, Size, and Forecast 2026-2030:
APAC (China, Japan, and India), Europe (Germany, France, and UK), North America (US, Canada, and Mexico), South America (Brazil, Argentina, and Colombia), Middle East and Africa (South Africa, Saudi Arabia, and UAE), and Rest of World (ROW)

Published: Dec 2025 317 Pages SKU: IRTNTR45932

Market Overview at a Glance

$3.40 B
Market Opportunity
4.3%
CAGR 2025 - 2030
41.1%
APAC Growth
$4.07 B
Surfactants segment 2024

Personal Care Ingredients Market Size 2026-2030

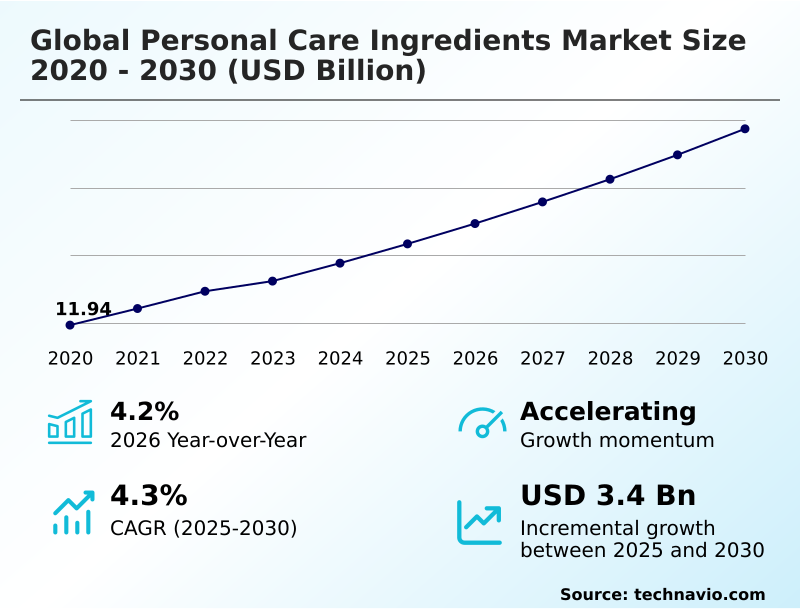
The personal care ingredients market size is valued to increase by USD 3.40 billion, at a CAGR of 4.3% from 2025 to 2030. Mainstreaming of biotechnology and precision fermentation will drive the personal care ingredients market.

Major Market Trends & Insights

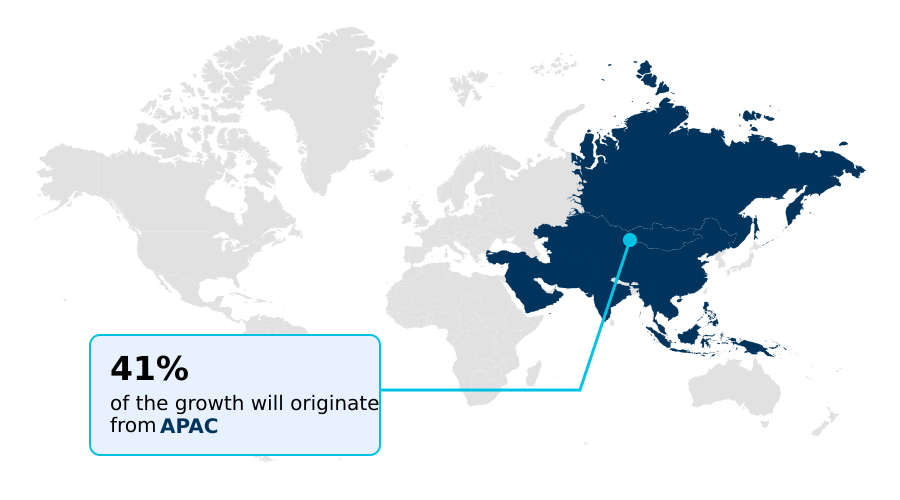
  • APAC dominated the market and accounted for a 41.1% growth during the forecast period.
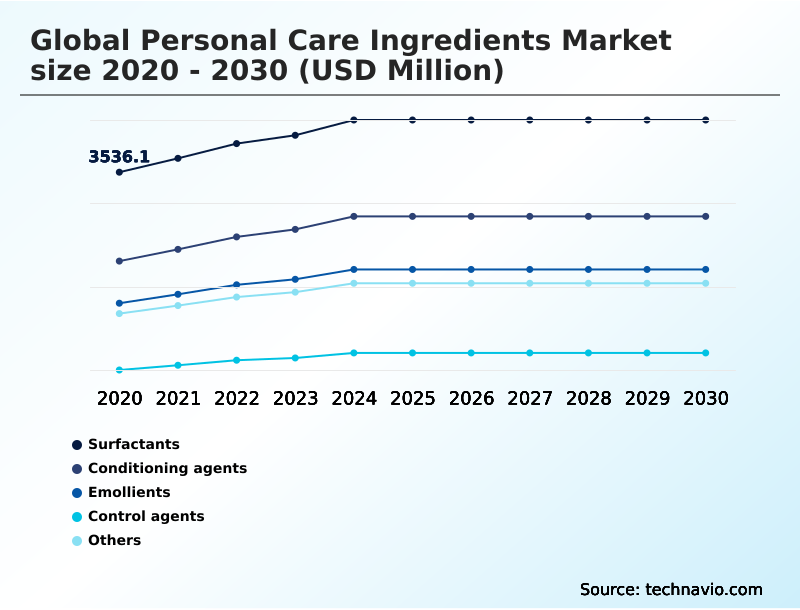
  • By Product - Surfactants segment was valued at USD 4.07 billion in 2024
  • By Application - Skin care segment accounted for the largest market revenue share in 2024

Market Size & Forecast

  • Market Opportunities: USD 5.79 billion
  • Market Future Opportunities: USD 3.40 billion
  • CAGR from 2025 to 2030 : 4.3%

Market Summary

  • The personal care ingredients market is undergoing a significant transformation, moving beyond basic components to embrace high-efficacy, science-backed solutions. This evolution is driven by a convergence of consumer demand for clean beauty, sustainable sourcing, and clinically proven results.
  • Key trends include the rise of biotechnology, enabling the production of nature-identical molecules through precision fermentation, and the shift from anti-aging to the broader concept of skin longevity. Innovations in neuro-cosmetics are addressing the skin-brain connection, creating products that offer both physiological and psychological benefits.
  • A core challenge lies in the complex and fragmented global regulatory landscape, which demands rigorous safety substantiation and transparent supply chains. For instance, a formulator developing a new facial serum must balance the use of novel bio-actives with varying international compliance standards, requiring significant investment in testing and documentation.
  • This dynamic pushes the industry toward ingredients that are not only effective and sustainable but also backed by robust scientific data to meet both consumer expectations and regulatory requirements. The market is also seeing a push towards upcycled ingredients and biodegradable polymers as part of a larger circular economy movement.

What will be the Size of the Personal Care Ingredients Market during the forecast period?

Get Key Insights on Market Forecast (PDF) Request Free Sample

How is the Personal Care Ingredients Market Segmented?

The personal care ingredients industry research report provides comprehensive data (region-wise segment analysis), with forecasts and estimates in "USD million" for the period 2026-2030, as well as historical data from 2020-2024 for the following segments.

  • Product
    • Surfactants
    • Conditioning agents
    • Emollients
    • Control agents
    • Others
  • Application
    • Skin care
    • Cosmetics
    • Hair care
    • Oral care
    • Others
  • Product type
    • Synthetic
    • Natural
  • Geography
    • APAC
      • China
      • Japan
      • India
    • Europe
      • Germany
      • France
      • UK
    • North America
      • US
      • Canada
      • Mexico
    • South America
      • Brazil
      • Argentina
      • Colombia
    • Middle East and Africa
      • South Africa
      • Saudi Arabia
      • UAE
    • Rest of World (ROW)

By Product Insights

The surfactants segment is estimated to witness significant growth during the forecast period.

The personal care ingredients market segmentation reflects a foundational shift beyond basic functionality, particularly in the surfactants category. The industry is rapidly moving toward chemistries that are not only effective but also aligned with sustainability and wellness mandates.

This evolution is driven by advances in green chemistry, enabling the development of biodegradable polymers and microbiome-friendly alternatives. Formulators are increasingly adopting natural alternatives to traditional texture enhancers, even in sectors like oral care.

This transition is complex, involving technologies like cell-free glycosylation to create high-performance molecules.

The market continues to show consistent momentum, with year-over-year growth standing at 4.2%, indicating robust demand for innovative solutions that combine performance with ecological responsibility, a trend influenced by principles of psychodermatology and holistic health.

Request Free Sample

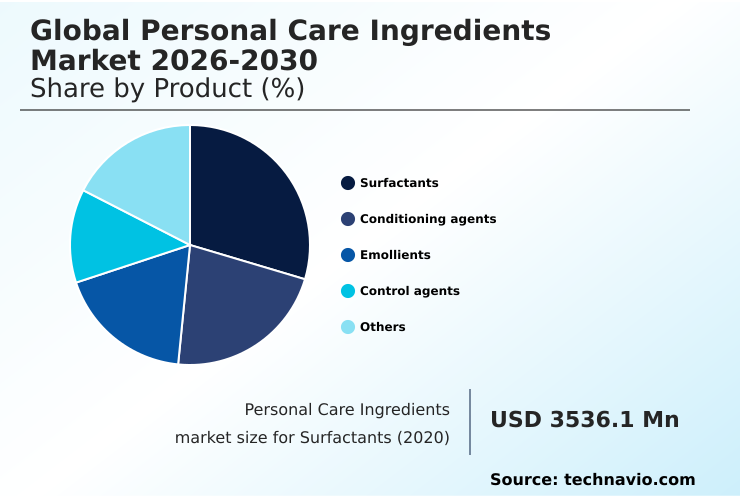
The Surfactants segment was valued at USD 4.07 billion in 2024 and showed a gradual increase during the forecast period.

Request Free Sample

Regional Analysis

APAC is estimated to contribute 41.1% to the growth of the global market during the forecast period.Technavio’s analysts have elaborately explained the regional trends and drivers that shape the market during the forecast period.

See How Personal Care Ingredients Market Demand is Rising in APAC Request Free Sample

The geographic landscape of the personal care ingredients market is led by the APAC region, which accounts for 41.1% of the industry's incremental growth, driven by sophisticated demand for innovative skin care in markets like South Korea and Japan.

North America follows, contributing 26.19% to the growth, with a strong focus on clinical-grade and biotech-derived ingredients. European markets are defined by stringent regulatory standards, pushing innovation in green chemistry and sustainable sourcing.

Across these regions, there's a unifying demand for effective sun protection, driving development of advanced UV filters that combat photoaging and inflammaging. This has led to a 15% increase in R&D spending on broad-spectrum technologies.

The trend of biomimetic restructuring, using ingredients that mimic the skin's natural composition, is gaining traction globally, improving the efficacy of cosmetics and barrier repair formulations.

Market Dynamics

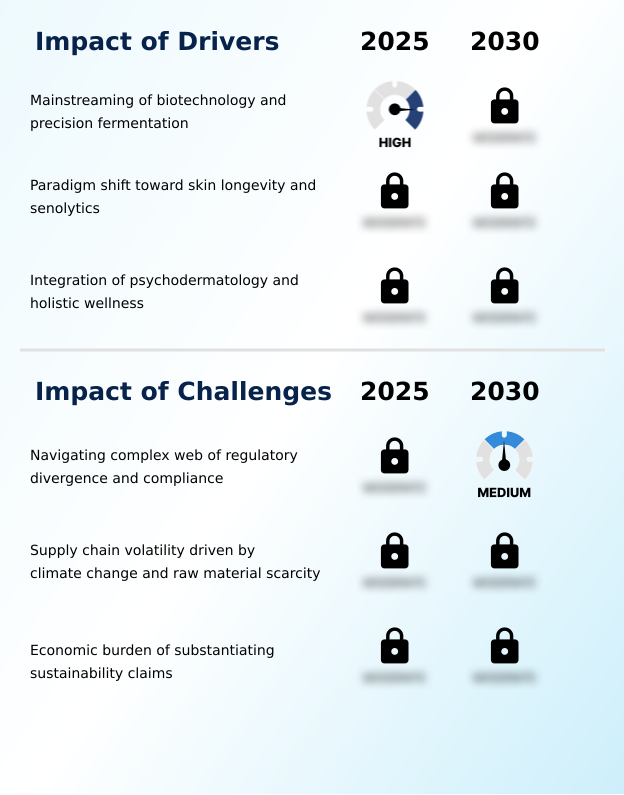
Our researchers analyzed the data with 2025 as the base year, along with the key drivers, trends, and challenges. A holistic analysis of drivers will help companies refine their marketing strategies to gain a competitive advantage.

  • Strategic planning in the personal care ingredients market requires a deep understanding of several interconnected dynamics. The role of biotechnology in personal care ingredients is expanding, with precision fermentation for active ingredients becoming a cornerstone of innovation.
  • This pivot addresses the challenges of green claims substantiation, as lab-grown molecules offer greater consistency and a verifiable environmental footprint compared to traditional methods. Concurrently, the impact of stress on skin health has spurred growth in psychodermatology and cosmetic formulation, where companies that master this niche see a twofold increase in formulation requests from premium brands.
  • Developing sustainable alternatives to synthetic polymers, particularly biodegradable polymers in hair care and natural rheology modifiers for cosmetics, is critical for meeting regulatory demands. Key growth areas include advancements in UV filter technology and halal-certified cosmetic ingredient development, which open access to previously untapped markets.
  • Understanding the role of microbiome in skin care is no longer optional, and advanced delivery systems for actives are essential for proving efficacy. Formulators are also tackling complex concepts like senolytic actives for anti-aging formulations and bio-electronic ingredients for skin rejuvenation.
  • These initiatives are shaped by overarching factors such as the climate impact on botanical sourcing, which reinforces the value of controlled-environment agriculture.
  • As the industry moves forward, trends like waterless formulation ingredient trends, the use of upcycled materials in cosmetic production, and the refinement of plant-based surfactants in personal care will define the next generation of products focused on skin longevity and cellular health.

What are the key market drivers leading to the rise in the adoption of Personal Care Ingredients Industry?

  • The mainstreaming of biotechnology and precision fermentation is a key driver propelling growth in the personal care ingredients market.

  • Market growth is fundamentally driven by the industrialization of biotechnology and a scientific pivot toward cellular longevity.
  • The adoption of precision fermentation allows for the creation of high-purity bio-actives and other active ingredients with a consistent efficacy profile, reducing batch-to-batch variability by over 90% compared to traditional botanical extracts.
  • This technological shift supports the growing demand for anti-aging solutions focused on cellular rejuvenation.
  • The development of advanced biotech ingredients, including novel senolytic ingredients that target aging at its source, has been shown in vitro to extend cellular healthspan by up to 30%.
  • This focus on validated, science-backed solutions is redefining performance standards across the industry.

What are the market trends shaping the Personal Care Ingredients Industry?

  • The mainstreaming of neuro-cosmetics represents a significant upcoming market trend, linking dermatological science with mental well-being to address the skin-brain axis.

  • Key trends in the personal care ingredients market are centered on the convergence of technology and wellness. The rise of neuro-cosmetics is moving beyond concept to commercial reality, with new ingredients clinically shown to improve skin appearance by mitigating stress-induced damage. Formulations incorporating these actives have demonstrated a 15% reduction in visible signs of fatigue.
  • Concurrently, the field of bioelectronics is introducing novel electrogenic actives that enhance the skin's natural energy, improving antioxidant efficiency by up to 20%. This trend towards holistic wellness is reshaping product development, with a focus on aesthetic modifiers that deliver both instant visual benefits and long-term skin health, significantly boosting product performance and consumer satisfaction.

What challenges does the Personal Care Ingredients Industry face during its growth?

  • Navigating the complex web of regulatory divergence and compliance presents a key challenge affecting the industry's growth trajectory.

  • Navigating operational hurdles is a primary focus for suppliers in the personal care ingredients market. The fragmented landscape of regulatory compliance across geographies can increase time-to-market for new ingredients by up to 40%, demanding significant investment in documentation and testing.
  • Furthermore, supply chain transparency remains a critical challenge, as climate-induced volatility has caused price fluctuations of over 50% for key natural emollients and surfactants used in skin and hair care. This uncertainty pressures formulators to secure alternative sustainable sourcing routes or innovate with versatile rheology modifiers.
  • The push for clean beauty also intensifies scrutiny, requiring robust data to support claims and avoid the risks associated with unsubstantiated marketing.

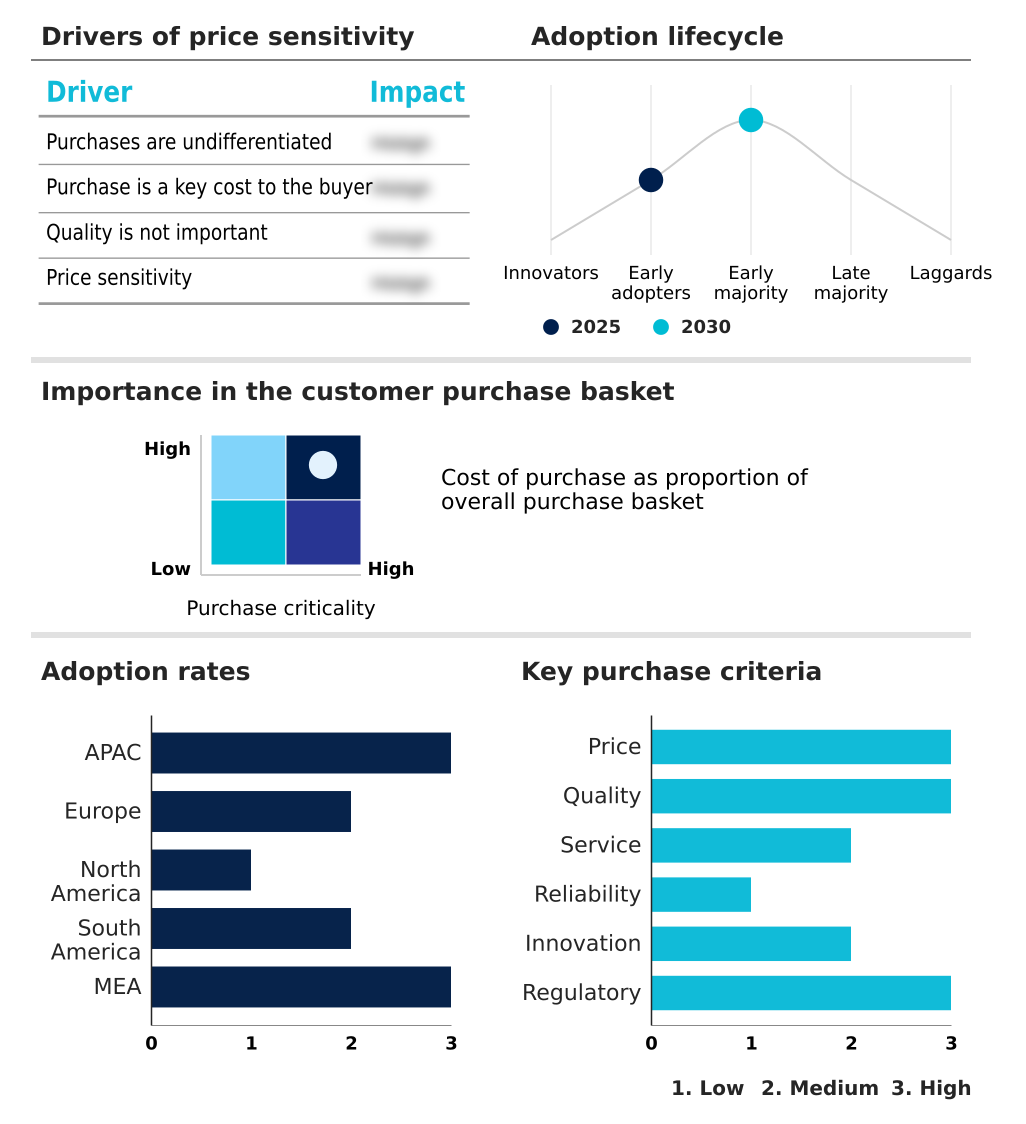
Exclusive Technavio Analysis on Customer Landscape

The personal care ingredients market forecasting report includes the adoption lifecycle of the market, covering from the innovator’s stage to the laggard’s stage. It focuses on adoption rates in different regions based on penetration. Furthermore, the personal care ingredients market report also includes key purchase criteria and drivers of price sensitivity to help companies evaluate and develop their market growth analysis strategies.

Customer Landscape of Personal Care Ingredients Industry

Competitive Landscape

Companies are implementing various strategies, such as strategic alliances, personal care ingredients market forecast, partnerships, mergers and acquisitions, geographical expansion, and product/service launches, to enhance their presence in the industry.

Ashland Inc. - The company provides a specialized portfolio of ingredients, including high-performance rheology modifiers, advanced bio-actives, and sustainably sourced plant-derived extracts for the personal care industry.

The industry research and growth report includes detailed analyses of the competitive landscape of the market and information about key companies, including:

  • Ashland Inc.
  • BASF SE
  • Clariant International Ltd.
  • Croda International Plc
  • Dow Chemical Co.
  • DSM Firmenich AG
  • Evonik Industries AG
  • Givaudan SA
  • ICHIMARU PHARCOS Co. Ltd.
  • Innospec Inc.
  • Kobo Products Inc.
  • Kraton Corp.
  • Merck KGaA
  • Nouryon Chemicals Holding
  • SEPPIC SA
  • Solvay SA
  • Stepan Co.
  • Symrise Group
  • The Lubrizol Corp.
  • Vantage Specialty Chemicals

Qualitative and quantitative analysis of companies has been conducted to help clients understand the wider business environment as well as the strengths and weaknesses of key industry players. Data is qualitatively analyzed to categorize companies as pure play, category-focused, industry-focused, and diversified; it is quantitatively analyzed to categorize companies as dominant, leading, strong, tentative, and weak.

Recent Development and News in Personal care ingredients market

  • In September 2024, Evonik launched CapilAcid and Oleobiota, two new natural active ingredients sourced from the Maqui fruit and the Misiones rainforest, aimed at hair protection and skin sebum regulation.
  • In January 2025, the Personal Care business of BASF launched VitaGuard A, a new ingredient featuring encapsulated retinol using solid lipid particles to improve stability and reduce skin irritation.
  • In April 2025, Ashland unveiled Collapeptyl Biofunctional, a hyalupeptide hybrid designed using AI-driven molecular modeling to mimic and boost various collagen types in the skin.
  • In April 2025, Givaudan Active Beauty launched PrimalHyal UltraReverse, an intracellular hyaluronic acid designed to penetrate the cell membrane and protect the proteome and mitochondrial function.

Dive into Technavio’s robust research methodology, blending expert interviews, extensive data synthesis, and validated models for unparalleled Personal Care Ingredients Market insights. See full methodology.

Market Scope
Page number 317
Base year 2025
Historic period 2020-2024
Forecast period 2026-2030
Growth momentum & CAGR Accelerate at a CAGR of 4.3%
Market growth 2026-2030 USD 3397.1 million
Market structure Fragmented
YoY growth 2025-2026(%) 4.2%
Key countries China, Japan, India, South Korea, Australia, Indonesia, Germany, France, UK, Italy, Spain, The Netherlands, US, Canada, Mexico, Brazil, Argentina, Colombia, South Africa, Saudi Arabia, UAE, Egypt and Turkey
Competitive landscape Leading Companies, Market Positioning of Companies, Competitive Strategies, and Industry Risks

Request Free Sample

Research Analyst Overview

  • The personal care ingredients market is increasingly driven by scientific rigor, where the value of an ingredient is measured by its biological impact. A key theme is the shift toward cellular longevity, moving beyond surface-level treatments to target the mechanisms of aging itself. This includes the development of senolytic ingredients designed to clear damaged cells and combat inflammaging.
  • Innovation is powered by biotechnology, with precision fermentation and cell-free glycosylation enabling the creation of novel bio-actives. We are also seeing the rise of neuro-cosmetics and psychodermatology, where active ingredients are engineered to mitigate the effects of stress on the skin. The industry is also exploring bioelectronics, utilizing electrogenic actives to enhance skin's natural functions.
  • This scientific pivot demands sophisticated functional components, from advanced rheology modifiers and aesthetic modifiers to high-performance conditioning agents, emollients, surfactants, and next-generation UV filters. Formulations incorporating ingredients backed by clinical data on cellular health have shown a 20% higher consumer retention rate.
  • This focus on provable efficacy, sustainable sourcing, upcycled ingredients, and microbiome-friendly solutions, all while adhering to the principles of green chemistry and developing biodegradable polymers, defines the competitive landscape.

What are the Key Data Covered in this Personal Care Ingredients Market Research and Growth Report?

  • What is the expected growth of the Personal Care Ingredients Market between 2026 and 2030?

    • USD 3.40 billion, at a CAGR of 4.3%

  • What segmentation does the market report cover?

    • The report is segmented by Product (Surfactants, Conditioning agents, Emollients, Control agents, and Others), Application (Skin care, Cosmetics, Hair care, Oral care, and Others), Product Type (Synthetic, and Natural) and Geography (APAC, Europe, North America, South America, Middle East and Africa)

  • Which regions are analyzed in the report?

    • APAC, Europe, North America, South America and Middle East and Africa

  • What are the key growth drivers and market challenges?

    • Mainstreaming of biotechnology and precision fermentation, Navigating complex web of regulatory divergence and compliance

  • Who are the major players in the Personal Care Ingredients Market?

    • Ashland Inc., BASF SE, Clariant International Ltd., Croda International Plc, Dow Chemical Co., DSM Firmenich AG, Evonik Industries AG, Givaudan SA, ICHIMARU PHARCOS Co. Ltd., Innospec Inc., Kobo Products Inc., Kraton Corp., Merck KGaA, Nouryon Chemicals Holding, SEPPIC SA, Solvay SA, Stepan Co., Symrise Group, The Lubrizol Corp. and Vantage Specialty Chemicals

Market Research Insights

  • The dynamics of the personal care ingredients market are shaped by a strategic pivot towards high-performance, sustainable solutions, a shift validated by key operational metrics. For example, the adoption of biotech ingredients has accelerated new product development cycles by up to 25%, enabling faster responses to emerging consumer needs.
  • In parallel, a focus on supply chain transparency and regulatory compliance has become paramount, with platforms offering digital traceability reducing documentation errors by 30%. This emphasis on data-driven formulation and clean beauty principles directly impacts product performance.
  • The evolution away from traditional anti-aging narratives toward holistic wellness and skin barrier repair reflects a more sophisticated consumer understanding of skin care and its connection to overall health.

We can help! Our analysts can customize this personal care ingredients market research report to meet your requirements.

Get in touch

1. Executive Summary

1.1 Market overview

Executive Summary - Chart on Market Overview
Executive Summary - Data Table on Market Overview
Executive Summary - Chart on Global Market Characteristics
Executive Summary - Chart on Market by Geography
Executive Summary - Chart on Market Segmentation by Product
Executive Summary - Chart on Market Segmentation by Application
Executive Summary - Chart on Market Segmentation by Product Type
Executive Summary - Chart on Incremental Growth
Executive Summary - Data Table on Incremental Growth
Executive Summary - Chart on Company Market Positioning

2. Technavio Analysis

2.1 Analysis of price sensitivity, lifecycle, customer purchase basket, adoption rates, and purchase criteria

2.2 Criticality of inputs and Factors of differentiation

Chart on Overview on criticality of inputs and factors of differentiation

2.3 Factors of disruption

Chart on Overview on factors of disruption

2.4 Impact of drivers and challenges

Chart on Impact of drivers and challenges in 2025 and 2030

3. Market Landscape

3.1 Market ecosystem

Chart on Parent Market
Data Table on - Parent Market

3.2 Market characteristics

Chart on Market characteristics analysis

3.3 Value chain analysis

Chart on Value chain analysis

4. Market Sizing

4.1 Market definition

Data Table on Offerings of companies included in the market definition

4.2 Market segment analysis

Market segments

4.3 Market size 2025

4.4 Market outlook: Forecast for 2025-2030

Chart on Global - Market size and forecast 2025-2030 ($ million)
Data Table on Global - Market size and forecast 2025-2030 ($ million)
Chart on Global Market: Year-over-year growth 2025-2030 (%)
Data Table on Global Market: Year-over-year growth 2025-2030 (%)

5. Historic Market Size

5.1 Global Personal Care Ingredients Market 2020 - 2024

Historic Market Size - Data Table on Global Personal Care Ingredients Market 2020 - 2024 ($ million)

5.2 Product segment analysis 2020 - 2024

Historic Market Size - Product Segment 2020 - 2024 ($ million)

5.3 Application segment analysis 2020 - 2024

Historic Market Size - Application Segment 2020 - 2024 ($ million)

5.4 Product Type segment analysis 2020 - 2024

Historic Market Size - Product Type Segment 2020 - 2024 ($ million)

5.5 Geography segment analysis 2020 - 2024

Historic Market Size - Geography Segment 2020 - 2024 ($ million)

5.6 Country segment analysis 2020 - 2024

Historic Market Size - Country Segment 2020 - 2024 ($ million)

6. Qualitative Analysis

6.1 Impact of AI on the Global Personal Care Ingredients Market

7. Five Forces Analysis

7.1 Five forces summary

Five forces analysis - Comparison between 2025 and 2030

7.2 Bargaining power of buyers

Bargaining power of buyers - Impact of key factors 2025 and 2030

7.3 Bargaining power of suppliers

Bargaining power of suppliers - Impact of key factors in 2025 and 2030

7.4 Threat of new entrants

Threat of new entrants - Impact of key factors in 2025 and 2030

7.5 Threat of substitutes

Threat of substitutes - Impact of key factors in 2025 and 2030

7.6 Threat of rivalry

Threat of rivalry - Impact of key factors in 2025 and 2030

7.7 Market condition

Chart on Market condition - Five forces 2025 and 2030

8. Market Segmentation by Product

8.1 Market segments

Chart on Product - Market share 2025-2030 (%)
Data Table on Product - Market share 2025-2030 (%)

8.2 Comparison by Product

Chart on Comparison by Product
Data Table on Comparison by Product

8.3 Surfactants - Market size and forecast 2025-2030

Chart on Surfactants - Market size and forecast 2025-2030 ($ million)
Data Table on Surfactants - Market size and forecast 2025-2030 ($ million)
Chart on Surfactants - Year-over-year growth 2025-2030 (%)
Data Table on Surfactants - Year-over-year growth 2025-2030 (%)

8.4 Conditioning agents - Market size and forecast 2025-2030

Chart on Conditioning agents - Market size and forecast 2025-2030 ($ million)
Data Table on Conditioning agents - Market size and forecast 2025-2030 ($ million)
Chart on Conditioning agents - Year-over-year growth 2025-2030 (%)
Data Table on Conditioning agents - Year-over-year growth 2025-2030 (%)

8.5 Emollients - Market size and forecast 2025-2030

Chart on Emollients - Market size and forecast 2025-2030 ($ million)
Data Table on Emollients - Market size and forecast 2025-2030 ($ million)
Chart on Emollients - Year-over-year growth 2025-2030 (%)
Data Table on Emollients - Year-over-year growth 2025-2030 (%)

8.6 Control agents - Market size and forecast 2025-2030

Chart on Control agents - Market size and forecast 2025-2030 ($ million)
Data Table on Control agents - Market size and forecast 2025-2030 ($ million)
Chart on Control agents - Year-over-year growth 2025-2030 (%)
Data Table on Control agents - Year-over-year growth 2025-2030 (%)

8.7 Others - Market size and forecast 2025-2030

Chart on Others - Market size and forecast 2025-2030 ($ million)
Data Table on Others - Market size and forecast 2025-2030 ($ million)
Chart on Others - Year-over-year growth 2025-2030 (%)
Data Table on Others - Year-over-year growth 2025-2030 (%)

8.8 Market opportunity by Product

Market opportunity by Product ($ million)
Data Table on Market opportunity by Product ($ million)

9. Market Segmentation by Application

9.1 Market segments

Chart on Application - Market share 2025-2030 (%)
Data Table on Application - Market share 2025-2030 (%)

9.2 Comparison by Application

Chart on Comparison by Application
Data Table on Comparison by Application

9.3 Skin care - Market size and forecast 2025-2030

Chart on Skin care - Market size and forecast 2025-2030 ($ million)
Data Table on Skin care - Market size and forecast 2025-2030 ($ million)
Chart on Skin care - Year-over-year growth 2025-2030 (%)
Data Table on Skin care - Year-over-year growth 2025-2030 (%)

9.4 Cosmetics - Market size and forecast 2025-2030

Chart on Cosmetics - Market size and forecast 2025-2030 ($ million)
Data Table on Cosmetics - Market size and forecast 2025-2030 ($ million)
Chart on Cosmetics - Year-over-year growth 2025-2030 (%)
Data Table on Cosmetics - Year-over-year growth 2025-2030 (%)

9.5 Hair care - Market size and forecast 2025-2030

Chart on Hair care - Market size and forecast 2025-2030 ($ million)
Data Table on Hair care - Market size and forecast 2025-2030 ($ million)
Chart on Hair care - Year-over-year growth 2025-2030 (%)
Data Table on Hair care - Year-over-year growth 2025-2030 (%)

9.6 Oral care - Market size and forecast 2025-2030

Chart on Oral care - Market size and forecast 2025-2030 ($ million)
Data Table on Oral care - Market size and forecast 2025-2030 ($ million)
Chart on Oral care - Year-over-year growth 2025-2030 (%)
Data Table on Oral care - Year-over-year growth 2025-2030 (%)

9.7 Others - Market size and forecast 2025-2030

Chart on Others - Market size and forecast 2025-2030 ($ million)
Data Table on Others - Market size and forecast 2025-2030 ($ million)
Chart on Others - Year-over-year growth 2025-2030 (%)
Data Table on Others - Year-over-year growth 2025-2030 (%)

9.8 Market opportunity by Application

Market opportunity by Application ($ million)
Data Table on Market opportunity by Application ($ million)

10. Market Segmentation by Product Type

10.1 Market segments

Chart on Product Type - Market share 2025-2030 (%)
Data Table on Product Type - Market share 2025-2030 (%)

10.2 Comparison by Product Type

Chart on Comparison by Product Type
Data Table on Comparison by Product Type

10.3 Synthetic - Market size and forecast 2025-2030

Chart on Synthetic - Market size and forecast 2025-2030 ($ million)
Data Table on Synthetic - Market size and forecast 2025-2030 ($ million)
Chart on Synthetic - Year-over-year growth 2025-2030 (%)
Data Table on Synthetic - Year-over-year growth 2025-2030 (%)

10.4 Natural - Market size and forecast 2025-2030

Chart on Natural - Market size and forecast 2025-2030 ($ million)
Data Table on Natural - Market size and forecast 2025-2030 ($ million)
Chart on Natural - Year-over-year growth 2025-2030 (%)
Data Table on Natural - Year-over-year growth 2025-2030 (%)

10.5 Market opportunity by Product Type

Market opportunity by Product Type ($ million)
Data Table on Market opportunity by Product Type ($ million)

11. Customer Landscape

11.1 Customer landscape overview

Analysis of price sensitivity, lifecycle, customer purchase basket, adoption rates, and purchase criteria

12. Geographic Landscape

12.1 Geographic segmentation

Chart on Market share by geography 2025-2030 (%)
Data Table on Market share by geography 2025-2030 (%)

12.2 Geographic comparison

Chart on Geographic comparison
Data Table on Geographic comparison

12.3 APAC - Market size and forecast 2025-2030

Chart on APAC - Market size and forecast 2025-2030 ($ million)
Data Table on APAC - Market size and forecast 2025-2030 ($ million)
Chart on APAC - Year-over-year growth 2025-2030 (%)
Data Table on APAC - Year-over-year growth 2025-2030 (%)
Chart on Regional Comparison - APAC
Data Table on Regional Comparison - APAC

12.3.1 China - Market size and forecast 2025-2030

Chart on China - Market size and forecast 2025-2030 ($ million)
Data Table on China - Market size and forecast 2025-2030 ($ million)
Chart on China - Year-over-year growth 2025-2030 (%)
Data Table on China - Year-over-year growth 2025-2030 (%)

12.3.2 Japan - Market size and forecast 2025-2030

Chart on Japan - Market size and forecast 2025-2030 ($ million)
Data Table on Japan - Market size and forecast 2025-2030 ($ million)
Chart on Japan - Year-over-year growth 2025-2030 (%)
Data Table on Japan - Year-over-year growth 2025-2030 (%)

12.3.3 India - Market size and forecast 2025-2030

Chart on India - Market size and forecast 2025-2030 ($ million)
Data Table on India - Market size and forecast 2025-2030 ($ million)
Chart on India - Year-over-year growth 2025-2030 (%)
Data Table on India - Year-over-year growth 2025-2030 (%)

12.3.4 South Korea - Market size and forecast 2025-2030

Chart on South Korea - Market size and forecast 2025-2030 ($ million)
Data Table on South Korea - Market size and forecast 2025-2030 ($ million)
Chart on South Korea - Year-over-year growth 2025-2030 (%)
Data Table on South Korea - Year-over-year growth 2025-2030 (%)

12.3.5 Australia - Market size and forecast 2025-2030

Chart on Australia - Market size and forecast 2025-2030 ($ million)
Data Table on Australia - Market size and forecast 2025-2030 ($ million)
Chart on Australia - Year-over-year growth 2025-2030 (%)
Data Table on Australia - Year-over-year growth 2025-2030 (%)

12.3.6 Indonesia - Market size and forecast 2025-2030

Chart on Indonesia - Market size and forecast 2025-2030 ($ million)
Data Table on Indonesia - Market size and forecast 2025-2030 ($ million)
Chart on Indonesia - Year-over-year growth 2025-2030 (%)
Data Table on Indonesia - Year-over-year growth 2025-2030 (%)

12.4 Europe - Market size and forecast 2025-2030

Chart on Europe - Market size and forecast 2025-2030 ($ million)
Data Table on Europe - Market size and forecast 2025-2030 ($ million)
Chart on Europe - Year-over-year growth 2025-2030 (%)
Data Table on Europe - Year-over-year growth 2025-2030 (%)
Chart on Regional Comparison - Europe
Data Table on Regional Comparison - Europe

12.4.1 Germany - Market size and forecast 2025-2030

Chart on Germany - Market size and forecast 2025-2030 ($ million)
Data Table on Germany - Market size and forecast 2025-2030 ($ million)
Chart on Germany - Year-over-year growth 2025-2030 (%)
Data Table on Germany - Year-over-year growth 2025-2030 (%)

12.4.2 France - Market size and forecast 2025-2030

Chart on France - Market size and forecast 2025-2030 ($ million)
Data Table on France - Market size and forecast 2025-2030 ($ million)
Chart on France - Year-over-year growth 2025-2030 (%)
Data Table on France - Year-over-year growth 2025-2030 (%)

12.4.3 UK - Market size and forecast 2025-2030

Chart on UK - Market size and forecast 2025-2030 ($ million)
Data Table on UK - Market size and forecast 2025-2030 ($ million)
Chart on UK - Year-over-year growth 2025-2030 (%)
Data Table on UK - Year-over-year growth 2025-2030 (%)

12.4.4 Italy - Market size and forecast 2025-2030

Chart on Italy - Market size and forecast 2025-2030 ($ million)
Data Table on Italy - Market size and forecast 2025-2030 ($ million)
Chart on Italy - Year-over-year growth 2025-2030 (%)
Data Table on Italy - Year-over-year growth 2025-2030 (%)

12.4.5 Spain - Market size and forecast 2025-2030

Chart on Spain - Market size and forecast 2025-2030 ($ million)
Data Table on Spain - Market size and forecast 2025-2030 ($ million)
Chart on Spain - Year-over-year growth 2025-2030 (%)
Data Table on Spain - Year-over-year growth 2025-2030 (%)

12.4.6 The Netherlands - Market size and forecast 2025-2030

Chart on The Netherlands - Market size and forecast 2025-2030 ($ million)
Data Table on The Netherlands - Market size and forecast 2025-2030 ($ million)
Chart on The Netherlands - Year-over-year growth 2025-2030 (%)
Data Table on The Netherlands - Year-over-year growth 2025-2030 (%)

12.5 North America - Market size and forecast 2025-2030

Chart on North America - Market size and forecast 2025-2030 ($ million)
Data Table on North America - Market size and forecast 2025-2030 ($ million)
Chart on North America - Year-over-year growth 2025-2030 (%)
Data Table on North America - Year-over-year growth 2025-2030 (%)
Chart on Regional Comparison - North America
Data Table on Regional Comparison - North America

12.5.1 US - Market size and forecast 2025-2030

Chart on US - Market size and forecast 2025-2030 ($ million)
Data Table on US - Market size and forecast 2025-2030 ($ million)
Chart on US - Year-over-year growth 2025-2030 (%)
Data Table on US - Year-over-year growth 2025-2030 (%)

12.5.2 Canada - Market size and forecast 2025-2030

Chart on Canada - Market size and forecast 2025-2030 ($ million)
Data Table on Canada - Market size and forecast 2025-2030 ($ million)
Chart on Canada - Year-over-year growth 2025-2030 (%)
Data Table on Canada - Year-over-year growth 2025-2030 (%)

12.5.3 Mexico - Market size and forecast 2025-2030

Chart on Mexico - Market size and forecast 2025-2030 ($ million)
Data Table on Mexico - Market size and forecast 2025-2030 ($ million)
Chart on Mexico - Year-over-year growth 2025-2030 (%)
Data Table on Mexico - Year-over-year growth 2025-2030 (%)

12.6 South America - Market size and forecast 2025-2030

Chart on South America - Market size and forecast 2025-2030 ($ million)
Data Table on South America - Market size and forecast 2025-2030 ($ million)
Chart on South America - Year-over-year growth 2025-2030 (%)
Data Table on South America - Year-over-year growth 2025-2030 (%)
Chart on Regional Comparison - South America
Data Table on Regional Comparison - South America

12.6.1 Brazil - Market size and forecast 2025-2030

Chart on Brazil - Market size and forecast 2025-2030 ($ million)
Data Table on Brazil - Market size and forecast 2025-2030 ($ million)
Chart on Brazil - Year-over-year growth 2025-2030 (%)
Data Table on Brazil - Year-over-year growth 2025-2030 (%)

12.6.2 Argentina - Market size and forecast 2025-2030

Chart on Argentina - Market size and forecast 2025-2030 ($ million)
Data Table on Argentina - Market size and forecast 2025-2030 ($ million)
Chart on Argentina - Year-over-year growth 2025-2030 (%)
Data Table on Argentina - Year-over-year growth 2025-2030 (%)

12.6.3 Colombia - Market size and forecast 2025-2030

Chart on Colombia - Market size and forecast 2025-2030 ($ million)
Data Table on Colombia - Market size and forecast 2025-2030 ($ million)
Chart on Colombia - Year-over-year growth 2025-2030 (%)
Data Table on Colombia - Year-over-year growth 2025-2030 (%)

12.7 Middle East and Africa - Market size and forecast 2025-2030

Chart on Middle East and Africa - Market size and forecast 2025-2030 ($ million)
Data Table on Middle East and Africa - Market size and forecast 2025-2030 ($ million)
Chart on Middle East and Africa - Year-over-year growth 2025-2030 (%)
Data Table on Middle East and Africa - Year-over-year growth 2025-2030 (%)
Chart on Regional Comparison - Middle East and Africa
Data Table on Regional Comparison - Middle East and Africa

12.7.1 South Africa - Market size and forecast 2025-2030

Chart on South Africa - Market size and forecast 2025-2030 ($ million)
Data Table on South Africa - Market size and forecast 2025-2030 ($ million)
Chart on South Africa - Year-over-year growth 2025-2030 (%)
Data Table on South Africa - Year-over-year growth 2025-2030 (%)

12.7.2 Saudi Arabia - Market size and forecast 2025-2030

Chart on Saudi Arabia - Market size and forecast 2025-2030 ($ million)
Data Table on Saudi Arabia - Market size and forecast 2025-2030 ($ million)
Chart on Saudi Arabia - Year-over-year growth 2025-2030 (%)
Data Table on Saudi Arabia - Year-over-year growth 2025-2030 (%)

12.7.3 UAE - Market size and forecast 2025-2030

Chart on UAE - Market size and forecast 2025-2030 ($ million)
Data Table on UAE - Market size and forecast 2025-2030 ($ million)
Chart on UAE - Year-over-year growth 2025-2030 (%)
Data Table on UAE - Year-over-year growth 2025-2030 (%)

12.7.4 Egypt - Market size and forecast 2025-2030

Chart on Egypt - Market size and forecast 2025-2030 ($ million)
Data Table on Egypt - Market size and forecast 2025-2030 ($ million)
Chart on Egypt - Year-over-year growth 2025-2030 (%)
Data Table on Egypt - Year-over-year growth 2025-2030 (%)

12.7.5 Turkey - Market size and forecast 2025-2030

Chart on Turkey - Market size and forecast 2025-2030 ($ million)
Data Table on Turkey - Market size and forecast 2025-2030 ($ million)
Chart on Turkey - Year-over-year growth 2025-2030 (%)
Data Table on Turkey - Year-over-year growth 2025-2030 (%)

12.8 Market opportunity by geography

Market opportunity by geography ($ million)
Data Tables on Market opportunity by geography ($ million)

13. Drivers, Challenges, and Opportunity

13.1 Market drivers

Mainstreaming of biotechnology and precision fermentation
Paradigm shift toward skin longevity and senolytics
Integration of psychodermatology and holistic wellness

13.2 Market challenges

Navigating complex web of regulatory divergence and compliance
Supply chain volatility driven by climate change and raw material scarcity
Economic burden of substantiating sustainability claims

13.3 Impact of drivers and challenges

Impact of drivers and challenges in 2025 and 2030

13.4 Market opportunities

Mainstreaming of neuro-cosmetics
Evolution from anti-aging to cellular longevity
Rise of bioelectronics and electrogenic actives

14. Competitive Landscape

14.1 Overview

14.2

Overview on criticality of inputs and factors of differentiation

14.3 Landscape disruption

Overview on factors of disruption

14.4 Industry risks

Impact of key risks on business

15. Competitive Analysis

15.1 Companies profiled

Companies covered

15.2 Company ranking index

15.3 Market positioning of companies

Matrix on companies position and classification

15.4 Ashland Inc.

Ashland Inc. - Overview
Ashland Inc. - Business segments
Ashland Inc. - Key news
Ashland Inc. - Key offerings
Ashland Inc. - Segment focus
SWOT

15.5 BASF SE

BASF SE - Overview
BASF SE - Business segments
BASF SE - Key news
BASF SE - Key offerings
BASF SE - Segment focus
SWOT

15.6 Clariant International Ltd.

Clariant International Ltd. - Overview
Clariant International Ltd. - Business segments
Clariant International Ltd. - Key news
Clariant International Ltd. - Key offerings
Clariant International Ltd. - Segment focus
SWOT

15.7 Croda International Plc

Croda International Plc - Overview
Croda International Plc - Business segments
Croda International Plc - Key offerings
Croda International Plc - Segment focus
SWOT

15.8 Dow Chemical Co.

Dow Chemical Co. - Overview
Dow Chemical Co. - Business segments
Dow Chemical Co. - Key news
Dow Chemical Co. - Key offerings
Dow Chemical Co. - Segment focus
SWOT

15.9 DSM Firmenich AG

DSM Firmenich AG - Overview
DSM Firmenich AG - Business segments
DSM Firmenich AG - Key news
DSM Firmenich AG - Key offerings
DSM Firmenich AG - Segment focus
SWOT

15.10 Evonik Industries AG

Evonik Industries AG - Overview
Evonik Industries AG - Business segments
Evonik Industries AG - Key news
Evonik Industries AG - Key offerings
Evonik Industries AG - Segment focus
SWOT

15.11 Givaudan SA

Givaudan SA - Overview
Givaudan SA - Business segments
Givaudan SA - Key news
Givaudan SA - Key offerings
Givaudan SA - Segment focus
SWOT

15.12 ICHIMARU PHARCOS Co. Ltd.

ICHIMARU PHARCOS Co. Ltd. - Overview
ICHIMARU PHARCOS Co. Ltd. - Product / Service
ICHIMARU PHARCOS Co. Ltd. - Key offerings
SWOT

15.13 Innospec Inc.

Innospec Inc. - Overview
Innospec Inc. - Business segments
Innospec Inc. - Key offerings
Innospec Inc. - Segment focus
SWOT

15.14 Kraton Corp.

Kraton Corp. - Overview
Kraton Corp. - Product / Service
Kraton Corp. - Key news
Kraton Corp. - Key offerings
SWOT

15.15 Merck KGaA

Merck KGaA - Overview
Merck KGaA - Business segments
Merck KGaA - Key news
Merck KGaA - Key offerings
Merck KGaA - Segment focus
SWOT

15.16 Nouryon Chemicals Holding

Nouryon Chemicals Holding - Overview
Nouryon Chemicals Holding - Product / Service
Nouryon Chemicals Holding - Key offerings
SWOT

15.17 SEPPIC SA

SEPPIC SA - Overview
SEPPIC SA - Product / Service
SEPPIC SA - Key offerings
SWOT

15.18 Solvay SA

Solvay SA - Overview
Solvay SA - Business segments
Solvay SA - Key news
Solvay SA - Key offerings
Solvay SA - Segment focus
SWOT

16. Appendix

16.1 Scope of the report

Market definition
Objectives
Notes and caveats

16.2 Inclusions and exclusions checklist

Inclusions checklist
Exclusions checklist

16.3 Currency conversion rates for US$

16.4 Research methodology

16.5 Data procurement

Information sources

16.6 Data validation

16.7 Validation techniques employed for market sizing

16.8 Data synthesis

16.9 360 degree market analysis

16.10 List of abbreviations

Research Methodology

Technavio presents a detailed picture of the market by way of study, synthesis, and summation of data from multiple sources. The analysts have presented the various facets of the market with a particular focus on identifying the key industry influencers. The data thus presented is comprehensive, reliable, and the result of extensive research, both primary and secondary.

INFORMATION SOURCES

Primary sources

  • Manufacturers and suppliers
  • Channel partners
  • Industry experts
  • Strategic decision makers

Secondary sources

  • Industry journals and periodicals
  • Government data
  • Financial reports of key industry players
  • Historical data
  • Press releases

DATA ANALYSIS

Data Synthesis

  • Collation of data
  • Estimation of key figures
  • Analysis of derived insights

Data Validation

  • Triangulation with data models
  • Reference against proprietary databases
  • Corroboration with industry experts

REPORT WRITING

Qualitative

  • Market drivers
  • Market challenges
  • Market trends
  • Five forces analysis

Quantitative

  • Market size and forecast
  • Market segmentation
  • Geographical insights
  • Competitive landscape

Interested in this report?

Get your sample now to see our research methodology and insights!

Download Now

Frequently Asked Questions

Personal Care Ingredients market growth will increase by USD 3397.1 million during 2026-2030 .

The Personal Care Ingredients market is expected to grow at a CAGR of 4.3% during 2026-2030 .

Personal Care Ingredients market is segmented by Product (Surfactants, Conditioning agents, Emollients, Control agents, Others) Application (Skin care, Cosmetics, Hair care, Oral care, Others) Product type (Synthetic, Natural)

Ashland Inc., BASF SE, Clariant International Ltd., Croda International Plc, Dow Chemical Co., DSM Firmenich AG, Evonik Industries AG, Givaudan SA, ICHIMARU PHARCOS Co. Ltd., Innospec Inc., Kobo Products Inc., Kraton Corp., Merck KGaA, Nouryon Chemicals Holding, SEPPIC SA, Solvay SA, Stepan Co., Symrise Group, The Lubrizol Corp., Vantage Specialty Chemicals are a few of the key vendors in the Personal Care Ingredients market.

APAC will register the highest growth rate of 41.1% among the other regions. Therefore, the Personal Care Ingredients market in APAC is expected to garner significant business opportunities for the vendors during the forecast period.

China, Japan, India, South Korea, Australia, Indonesia, Germany, France, UK, Italy, Spain, The Netherlands, US, Canada, Mexico, Brazil, Argentina, Colombia, South Africa, Saudi Arabia, UAE, Egypt, Turkey

  • Mainstreaming of biotechnology and precision fermentation is the driving factor this market.

The Personal Care Ingredients market vendors should focus on grabbing business opportunities from the Product segment as it accounted for the largest market share in the base year.