Personal Consumer Electronics Market Analysis, Size, and Forecast 2025-2029: North America (US and Canada), Europe (France, Germany, Italy, and UK), APAC (China, India, Japan, and South Korea), and Rest of World (ROW)

Personal Consumer Electronics Market Analysis, Size, and Forecast 2025-2029:
North America (US and Canada), Europe (France, Germany, Italy, and UK), APAC (China, India, Japan, and South Korea), and Rest of World (ROW)

Published: Jun 2025 223 Pages SKU: IRTNTR75704

Market Overview at a Glance

$104.1 B
Market Opportunity
5.2%
CAGR
4.8
YoY growth 2024-2025(%)

Personal Consumer Electronics Market Size 2025-2029

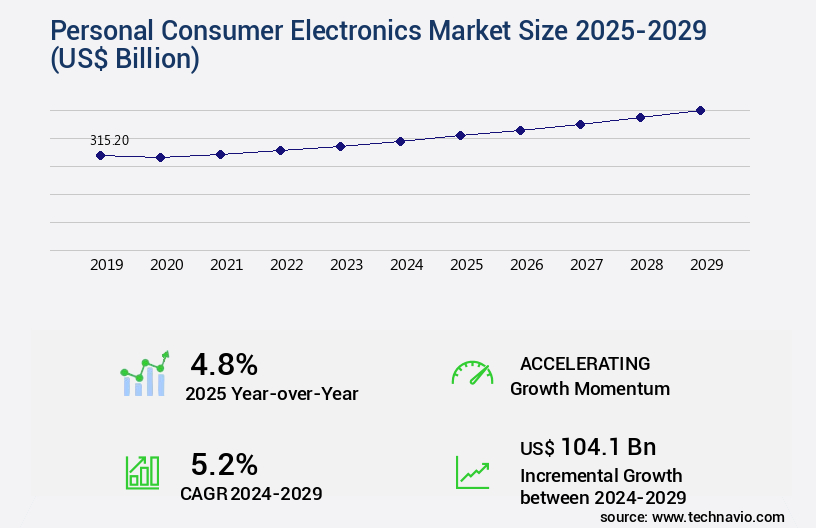
The personal consumer electronics market size is valued to increase USD 104.1 billion, at a CAGR of 5.2% from 2024 to 2029. Frequent product launches of personal consumer electronics will drive the personal consumer electronics market.

Major Market Trends & Insights

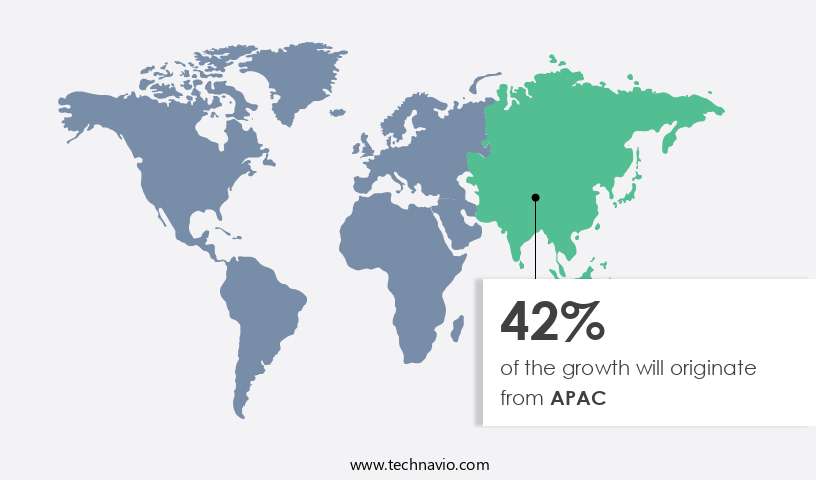
  • APAC dominated the market and accounted for a 42% growth during the forecast period.
  • By Product Type - Smartphones segment was valued at USD 102.20 billion in 2023
  • By Distribution Channel - Offline segment accounted for the largest market revenue share in 2023

Market Size & Forecast

  • Market Opportunities: USD 48.41 billion
  • Market Future Opportunities: USD 104.10 billion
  • CAGR : 5.2%
  • APAC: Largest market in 2023

Market Summary

  • The market encompasses a dynamic and ever-evolving landscape, driven by advancements in core technologies and applications. With the increasing popularity of artificial intelligence, virtual reality, and the Internet of Things, the market continues to expand and innovate. Service types and product categories, such as smartphones, laptops, tablets, and wearable devices, dominate consumer spending. The rapidly growing e-commerce industry and frequent product launches further fuel market growth. However, the market faces challenges including fluctuation in prices of raw materials and operational costs. For instance, the global smartphone market is projected to reach a 67% adoption rate by 2025. Regulations and regional differences also play a significant role in shaping market trends.
  • Stay tuned for more insights into the evolving the market.

What will be the Size of the Personal Consumer Electronics Market during the forecast period?

Personal Consumer Electronics Market Size

Get Key Insights on Market Forecast (PDF) Request Free Sample

How is the Personal Consumer Electronics Market Segmented and what are the key trends of market segmentation?

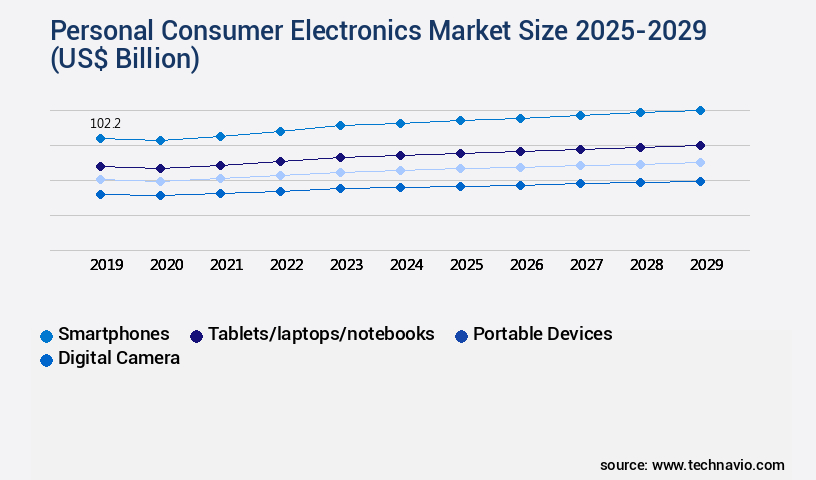
The personal consumer electronics industry research report provides comprehensive data (region-wise segment analysis), with forecasts and estimates in "USD billion" for the period 2025-2029, as well as historical data from 2019-2023 for the following segments.

  • Product Type
    • Smartphones
    • Tablets/laptops/notebooks
    • Portable devices
    • Digital camera
    • Others
  • Distribution Channel
    • Offline
    • Online
  • Application
    • Personal use
    • Entertainment
    • Communication
    • Fitness and health monitoring
    • Others
  • Geography
    • North America
      • US
      • Canada
    • Europe
      • France
      • Germany
      • Italy
      • UK
    • APAC
      • China
      • India
      • Japan
      • South Korea
    • Rest of World (ROW)

By Product Type Insights

The smartphones segment is estimated to witness significant growth during the forecast period.

In the dynamic and evolving the market, the smartphones segment holds a significant position. These advanced mobile devices cater to modern life's demands, offering features beyond basic voice communication. With an estimated 67% of the world's population owning a smartphone, the market's influence is undeniable (Source: Statista). Key functions of smartphones include communication, internet connectivity, and multimedia capabilities. Users can make calls, send messages, and communicate through various apps. Internet access, available via Wi-Fi, mobile data networks, or both, enables web browsing, social media usage, and online services utilization. Moreover, smartphones boast high-resolution screens, built-in cameras for photography and videography, and the ability to play audio and video files.

Biometric authentication systems, such as fingerprint scanners and facial recognition technology, enhance security. Water resistance ratings ensure durability and reliability in various environments. Miniaturization techniques enable compact designs, while power management ICs and thermal management solutions optimize battery life and energy efficiency. Fast charging technology and extended battery life are essential features for users on-the-go. Image sensor technology, OLED displays, and augmented reality capabilities offer enhanced user experiences. Smart home integration, 5G cellular connectivity, and privacy protection measures cater to evolving consumer needs. Semiconductor components, haptic feedback systems, and data security protocols ensure optimal performance and user experience.

The market anticipates a 25% increase in smartphone sales this year, with a further 20% growth projection for the next five years (Source: Market Research Firm A). Processor performance, battery life extension, and software updates frequency are critical factors driving market expansion. Material science advancements, product lifecycle management, and high-resolution cameras further contribute to the market's growth. Energy efficiency standards and user interface design are essential considerations for manufacturers. Lithium-ion batteries, power consumption efficiency, and wireless charging technology are essential components for smartphone design. Additionally, voice assistant capability, operating system compatibility, and drop protection features cater to diverse user preferences.

In conclusion, the market, specifically the smartphones segment, is a continuously evolving landscape. Market trends include advanced features, enhanced security, and improved performance. The market's future growth is driven by consumer demand for connectivity, convenience, and innovation.

Personal Consumer Electronics Market Size

Request Free Sample

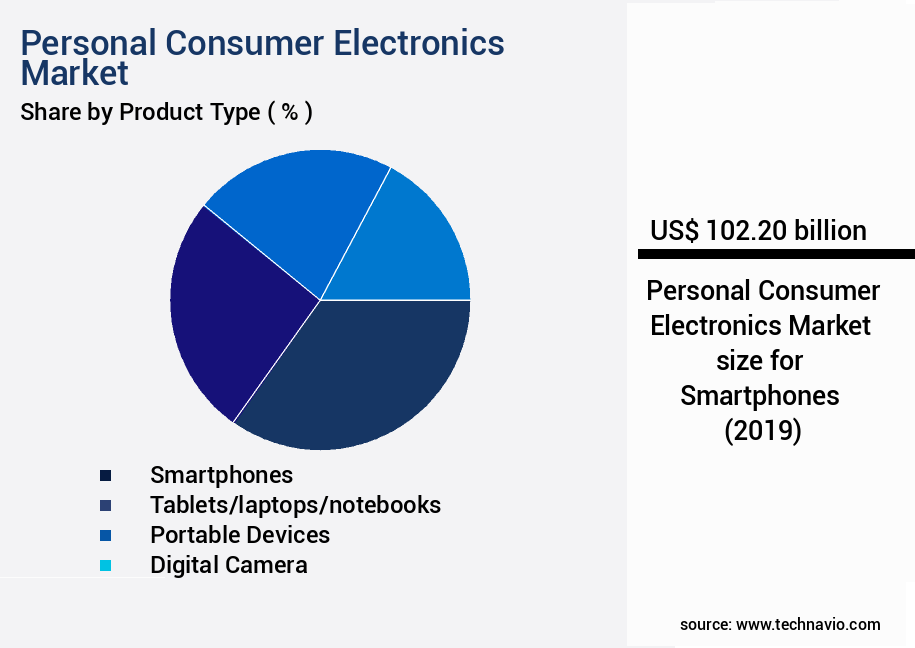
The Smartphones segment was valued at USD 102.20 billion in 2019 and showed a gradual increase during the forecast period.

Personal Consumer Electronics Market Size

Request Free Sample

Regional Analysis

APAC is estimated to contribute 42% to the growth of the global market during the forecast period.Technavio's analysts have elaborately explained the regional trends and drivers that shape the market during the forecast period.

Personal Consumer Electronics Market Share by Geography

See How Personal Consumer Electronics Market Demand is Rising in APAC Request Free Sample

The market in the Asia Pacific (APAC) region is undergoing significant transformation due to technological advancements. Countries like India and China play a pivotal role in driving sales, with increasing demand for devices such as smartphones. According to recent data, China boasts the largest number of smartphone users globally, followed closely by India. The forecast period is anticipated to witness a substantial rise in demand as Internet penetration expands in these markets.

Companies in APAC are capitalizing on this trend by introducing new products and diverse product lines to capture a larger customer base and market share.

Market Dynamics

Our researchers analyzed the data with 2024 as the base year, along with the key drivers, trends, and challenges. A holistic analysis of drivers will help companies refine their marketing strategies to gain a competitive advantage.

The market is a dynamic and innovative industry, driven by advancements in technology and evolving consumer preferences. This market encompasses a diverse range of products, including smartphones, laptops, tablets, wearables, and various smart home devices. One of the key focus areas in this market is the implementation of cutting-edge technologies to enhance user experience and ensure product reliability. For instance, OLED display burn-in prevention techniques and lithium-ion battery thermal runaway protection are essential to maintain the longevity and safety of devices. Furthermore, wireless charging efficiency optimization, haptic feedback response time improvement, and smart home device interoperability standards contribute to a seamless user experience.

In the realm of artificial intelligence (AI), voice assistant natural language processing and augmented reality user interface design principles are gaining significant traction. Virtual reality motion sickness mitigation strategies and 5G cellular network performance optimization are other critical aspects that cater to the growing demand for immersive and high-speed connectivity. Moreover, high-resolution camera image stabilization methods, AI-powered image noise reduction algorithms, and biometric authentication security vulnerabilities are essential considerations for manufacturers to address. Facial recognition accuracy and bias mitigation, fingerprint scanner reliability and durability, user interface intuitive navigation design, processor power efficiency improvements, and RAM and storage capacity optimization strategies are also crucial factors shaping the market.

As per the latest market intelligence, more than 70% of new product developments focus on enhancing power consumption efficiency, with battery life extension through software updates and fast charging technology safety standards being significant priorities. This underscores the importance of power consumption efficiency testing methodologies in the market. In conclusion, the market is a highly competitive landscape, with players continually striving to innovate and cater to the ever-evolving needs and preferences of consumers. The adoption of advanced technologies and stringent safety standards are key differentiators for market success.

Personal Consumer Electronics Market Size

What are the key market drivers leading to the rise in the adoption of Personal Consumer Electronics Industry?

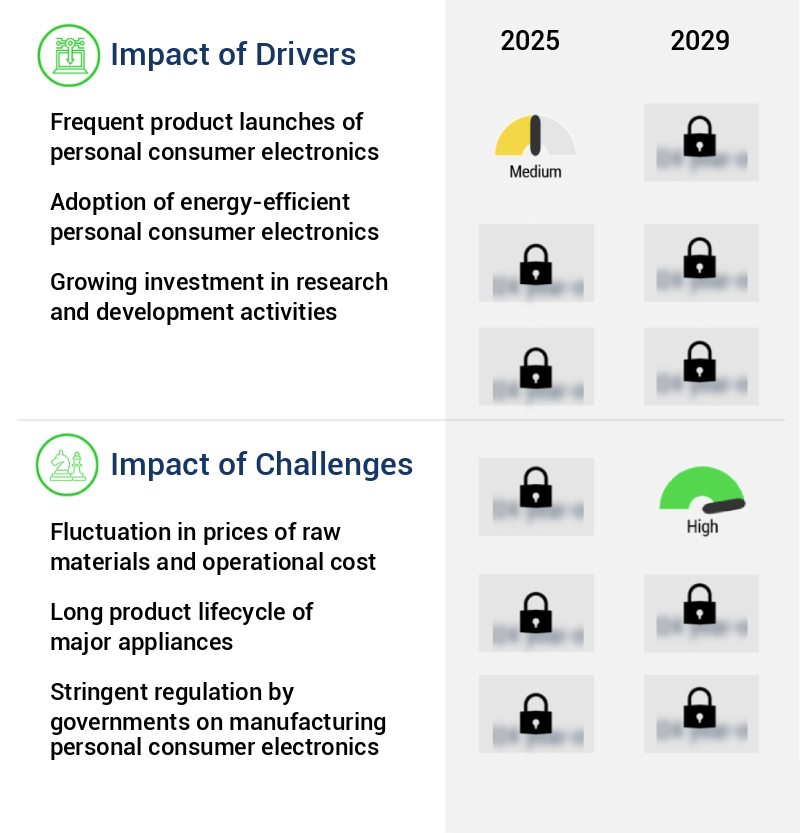
  • The consistent introduction of new personal consumer electronics products serves as the primary market catalyst. 
  • The market experiences consistent expansion due to the unrelenting release of innovative products from industry leaders. Companies remain dedicated to satisfying the escalating consumer appetite for advanced electronics. In January 2024, Samsung introduced the Galaxy S24 series, which includes the Galaxy S24, S24+, and S24 Ultra. These devices, powered by the Exynos 2400 and Snapdragon 8 Gen 3 chipsets, respectively, deliver exceptional performance. Apple Inc. Followed suit in September 2024, debuting the iPhone 16 series at its annual product launch event.
  • Both Samsung and Apple's offerings underscore the industry's commitment to AI integration, with the Galaxy S24 series showcasing Samsung's Galaxy AI initiative and the iPhone 16 series boasting enhanced AI capabilities. These advancements underscore the dynamic nature of the market and its ongoing evolution.

What are the market trends shaping the Personal Consumer Electronics Industry?

  • The e-commerce industry, which is experiencing rapid growth, represents the latest market trend.
  • E-commerce has experienced substantial expansion in recent times, serving as a vital sales channel for businesses and a preferred shopping destination for consumers. The shift towards online shopping is driven by the convenience it offers, making it an indispensable part of the retail landscape. This dynamic market presents numerous opportunities for businesses to engage with customers and expand their reach. Online platforms cater to a diverse range of consumer electronics, segmented by categories, price points, and brands. Leading e-retailers, such as Amazon.Com, JD.Com, and Alibaba Group, showcase extensive offerings in personal consumer electronics. The e-commerce sector continues to evolve, with technological advancements and innovative services streamlining the online shopping experience.
  • The consumer electronics category encompasses a broad spectrum of products, including smartphones, laptops, tablets, and wearables. The popularity of these devices has led to a surge in demand for accessories, such as cases, chargers, and headphones. Additionally, the rise of subscription services and installment plans has made purchasing electronics more accessible to a larger audience. As businesses adapt to the evolving market and consumer preferences, they must stay informed about the latest trends and technologies to remain competitive. This includes offering competitive pricing, seamless user experiences, and personalized recommendations. By keeping up with these developments, e-commerce businesses can capitalize on the growing consumer demand for electronics and provide a valuable service to their customers.

What challenges does the Personal Consumer Electronics Industry face during its growth?

  • The volatility in the costs of raw materials and operations poses a significant challenge to the industry's growth trajectory. 
  • Domestic appliances encompass a diverse range of products, from refrigerators and washing machines to air conditioners and cooktops. The manufacturing cost of these appliances is influenced by several factors, including the price of raw materials and labor. Steel, iron, plastic, glass, electrical devices, petroleum products, and paints are among the numerous materials required for their production. The cost of these materials is subject to volatility due to fluctuating exchange rates and market conditions. Labor costs also contribute significantly to the overall expense of producing domestic appliances. Manufacturers must balance the need for skilled labor with the desire to minimize costs.
  • In some regions, automation is increasingly being adopted to reduce labor costs and improve efficiency. The cost of goods sold (COGS) and profit margins of manufacturers are directly impacted by changes in raw material prices. For instance, a rise in the price of steel could lead to increased COGS, potentially reducing profitability. Conversely, a decrease in raw material prices could lead to higher profit margins. In summary, the price of domestic appliances is influenced by a multitude of factors, including the cost of raw materials, labor, and transportation. These costs can fluctuate significantly, making it essential for manufacturers to closely monitor market trends and adapt to changing conditions.

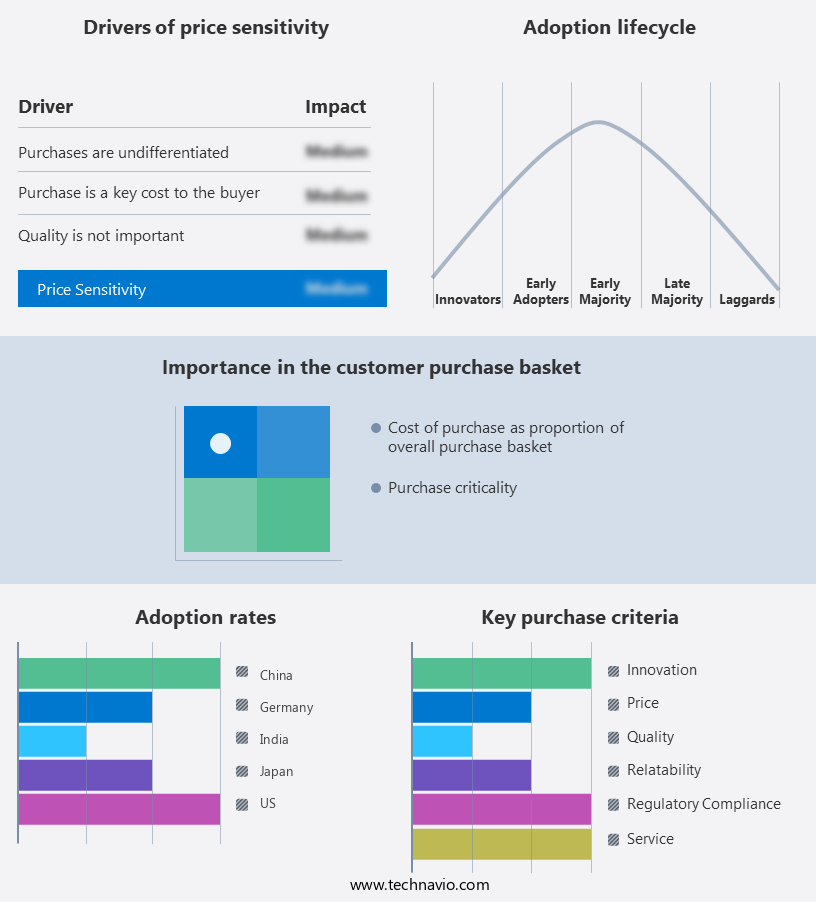
Exclusive Technavio Analysis on Customer Landscape

The personal consumer electronics market forecasting report includes the adoption lifecycle of the market, covering from the innovator's stage to the laggard's stage. It focuses on adoption rates in different regions based on penetration. Furthermore, the personal consumer electronics market report also includes key purchase criteria and drivers of price sensitivity to help companies evaluate and develop their market growth analysis strategies.

Personal Consumer Electronics Market Share by Geography

 Customer Landscape of Personal Consumer Electronics Industry

Competitive Landscape

Companies are implementing various strategies, such as strategic alliances, personal consumer electronics market forecast, partnerships, mergers and acquisitions, geographical expansion, and product/service launches, to enhance their presence in the industry.

Apple Inc. - This company specializes in the production and distribution of a range of personal consumer electronics, encompassing mobile devices, computers, smartwatches, airpods, and televisions. These innovative technologies cater to modern consumer needs, enhancing connectivity, productivity, and entertainment.

The industry research and growth report includes detailed analyses of the competitive landscape of the market and information about key companies, including:

  • Apple Inc.
  • Bajaj Electricals Ltd.
  • Dell Technologies Inc.
  • Electrolux Group
  • Havells India Ltd.
  • Hisense International Co. Ltd.
  • Hitachi Ltd.
  • HP Inc.
  • Huawei Technologies Co. Ltd.
  • Koninklijke Philips NV
  • Lenovo Group Ltd.
  • LG Corp.
  • Panasonic Holdings Corp.
  • Samsung Electronics Co. Ltd.
  • Sony Group Corp.
  • Toshiba Corp.
  • Whirlpool Corp.
  • Xiaomi Inc.

Qualitative and quantitative analysis of companies has been conducted to help clients understand the wider business environment as well as the strengths and weaknesses of key industry players. Data is qualitatively analyzed to categorize companies as pure play, category-focused, industry-focused, and diversified; it is quantitatively analyzed to categorize companies as dominant, leading, strong, tentative, and weak.

Recent Development and News in Personal Consumer Electronics Market

  • In January 2024, Samsung Electronics announced the launch of its groundbreaking Galaxy S22 series, featuring advanced 5G capabilities and an improved 108-megapixel camera system (Samsung press release, 2024).
  • In March 2024, Apple and Google formed a strategic partnership to develop smart home devices integrating Google's Assistant with Apple's HomeKit platform (Apple Investor Relations, 2024).
  • In April 2025, Xiaomi raised USD3.5 billion in its latest funding round, bolstering its position as the world's third-largest smartphone manufacturer (Reuters, 2025).
  • In May 2025, the European Union passed new regulations on electronic waste disposal, mandating manufacturers to cover the cost of recycling their products (European Commission, 2025).

Dive into Technavio's robust research methodology, blending expert interviews, extensive data synthesis, and validated models for unparalleled Personal Consumer Electronics Market insights. See full methodology.

Market Scope

Report Coverage

Details

Page number

223

Base year

2024

Historic period

2019-2023

Forecast period

2025-2029

Growth momentum & CAGR

Accelerate at a CAGR of 5.2%

Market growth 2025-2029

USD 104.1 billion

Market structure

Fragmented

YoY growth 2024-2025(%)

4.8

Key countries

US, China, Canada, India, Germany, Japan, UK, South Korea, France, and Italy

Competitive landscape

Leading Companies, Market Positioning of Companies, Competitive Strategies, and Industry Risks

Request Free Sample

Research Analyst Overview

  • In the dynamic and evolving landscape of personal consumer electronics, several key trends are shaping the market. Biometric authentication systems, such as facial recognition and fingerprint scanners, are increasingly adopted for enhanced security. Water resistance ratings are becoming standard features, reflecting the demand for durability and reliability. Miniaturization techniques enable the development of smaller, more portable devices, while power management ICs and thermal management solutions ensure optimal performance and efficiency. Fast charging technology and battery life extension methods extend usage time, addressing consumer concerns. Image sensor technology and OLED display technology deliver improved visual experiences, with environmental impact assessments gaining importance in manufacturing processes.
  • Processor performance and AI-powered image processing enhance functionality, while haptic feedback systems and voice assistant capabilities add convenience. Semiconductor components and software updates frequency ensure compatibility with various operating systems and wireless charging technologies. Privacy protection measures and drop protection features address growing consumer concerns. 5G cellular connectivity and smart home integration offer seamless connectivity and integration with other devices. Developments in material science advancements, such as lithium-ion batteries and power consumption efficiency, contribute to the market's continuous evolution. Augmented reality features and virtual reality headsets expand the boundaries of user experiences. Market players invest in product lifecycle management, high-resolution cameras, energy efficiency standards, and user interface design to cater to evolving consumer preferences.
  • The competition intensifies, with companies focusing on innovation and differentiation to stay ahead.

What are the Key Data Covered in this Personal Consumer Electronics Market Research and Growth Report?

  • What is the expected growth of the Personal Consumer Electronics Market between 2025 and 2029?

    • USD 104.1 billion, at a CAGR of 5.2%

  • What segmentation does the market report cover?

    • The report segmented by Product Type (Smartphones, Tablets/laptops/notebooks, Portable devices, Digital camera, and Others), Distribution Channel (Offline and Online), Application (Personal use, Entertainment, Communication, Fitness and health monitoring, and Others), and Geography (APAC, Europe, North America, South America, and Middle East and Africa)

  • Which regions are analyzed in the report?

    • APAC, Europe, North America, South America, and Middle East and Africa

  • What are the key growth drivers and market challenges?

    • Frequent product launches of personal consumer electronics, Fluctuation in prices of raw materials and operational cost

  • Who are the major players in the Personal Consumer Electronics Market?

    • Key Companies Apple Inc., Bajaj Electricals Ltd., Dell Technologies Inc., Electrolux Group, Havells India Ltd., Hisense International Co. Ltd., Hitachi Ltd., HP Inc., Huawei Technologies Co. Ltd., Koninklijke Philips NV, Lenovo Group Ltd., LG Corp., Panasonic Holdings Corp., Samsung Electronics Co. Ltd., Sony Group Corp., Toshiba Corp., Whirlpool Corp., and Xiaomi Inc.

Market Research Insights

  • The market is characterized by its dynamic and innovative landscape, with continuous advancements in technology driving growth and competition. Two key indicators of this evolution are the increasing focus on product design aesthetics and audio reproduction quality. For instance, the latest smartphones boast sleek designs and support for advanced audio codecs, enhancing user experience. Meanwhile, supply chain optimization and electronic waste management have become crucial considerations, with manufacturers prioritizing power adapter specifications that reduce energy consumption and improve sustainability. Additionally, network latency and display refresh rate are essential factors for gamers, while video playback capabilities and microphone sensitivity cater to multimedia enthusiasts.
  • As the market continues to evolve, manufacturers invest in digital signal processing, manufacturing processes, and user experience testing to ensure product reliability and meet consumer demands. Data transfer speed, connectivity protocols, and storage memory type also remain critical factors, with trends leaning towards faster, more efficient solutions.

We can help! Our analysts can customize this personal consumer electronics market research report to meet your requirements.

Get in touch

1 Executive Summary

  • 1.1 Market overview
    • Executive Summary - Chart on Market Overview
    • Executive Summary - Data Table on Market Overview
    • Executive Summary - Chart on Global Market Characteristics
    • Executive Summary - Chart on Market by Geography
    • Executive Summary - Chart on Market Segmentation by Product Type
    • Executive Summary - Chart on Market Segmentation by Distribution Channel
    • Executive Summary - Chart on Market Segmentation by Application
    • Executive Summary - Chart on Incremental Growth
    • Executive Summary - Data Table on Incremental Growth
    • Executive Summary - Chart on Company Market Positioning

2 Technavio Analysis

  • 2.1 Analysis of price sensitivity, lifecycle, customer purchase basket, adoption rates, and purchase criteria
    • Analysis of price sensitivity, lifecycle, customer purchase basket, adoption rates, and purchase criteria
  • 2.2 Criticality of inputs and Factors of differentiation
    • Overview on criticality of inputs and factors of differentiation
  • 2.3 Factors of disruption
    • Overview on factors of disruption
  • 2.4 Impact of drivers and challenges
    • Impact of drivers and challenges in 2024 and 2029

3 Market Landscape

  • 3.1 Market ecosystem
    • Parent Market
    • Data Table on - Parent Market
  • 3.2 Market characteristics
    • Market characteristics analysis
  • 3.3 Value chain analysis
    • Value chain analysis

4 Market Sizing

  • 4.1 Market definition
    • Offerings of companies included in the market definition
  • 4.2 Market segment analysis
    • Market segments
  • 4.3 Market size 2024
    • 4.4 Market outlook: Forecast for 2024-2029
      • Chart on Global - Market size and forecast 2024-2029 ($ billion)
      • Data Table on Global - Market size and forecast 2024-2029 ($ billion)
      • Chart on Global Market: Year-over-year growth 2024-2029 (%)
      • Data Table on Global Market: Year-over-year growth 2024-2029 (%)

    5 Historic Market Size

    • 5.1 Global Personal Consumer Electronics Market 2019 - 2023
      • Historic Market Size - Data Table on Global Personal Consumer Electronics Market 2019 - 2023 ($ billion)
    • 5.2 Product Type segment analysis 2019 - 2023
      • Historic Market Size - Product Type Segment 2019 - 2023 ($ billion)
    • 5.3 Distribution Channel segment analysis 2019 - 2023
      • Historic Market Size - Distribution Channel Segment 2019 - 2023 ($ billion)
    • 5.4 Application segment analysis 2019 - 2023
      • Historic Market Size - Application Segment 2019 - 2023 ($ billion)
    • 5.5 Geography segment analysis 2019 - 2023
      • Historic Market Size - Geography Segment 2019 - 2023 ($ billion)
    • 5.6 Country segment analysis 2019 - 2023
      • Historic Market Size - Country Segment 2019 - 2023 ($ billion)

    6 Qualitative Analysis

    • 6.1 The impact of AI in the global personal consumer electronics market

      7 Five Forces Analysis

      • 7.1 Five forces summary
        • Five forces analysis - Comparison between 2024 and 2029
      • 7.2 Bargaining power of buyers
        • Bargaining power of buyers - Impact of key factors 2024 and 2029
      • 7.3 Bargaining power of suppliers
        • Bargaining power of suppliers - Impact of key factors in 2024 and 2029
      • 7.4 Threat of new entrants
        • Threat of new entrants - Impact of key factors in 2024 and 2029
      • 7.5 Threat of substitutes
        • Threat of substitutes - Impact of key factors in 2024 and 2029
      • 7.6 Threat of rivalry
        • Threat of rivalry - Impact of key factors in 2024 and 2029
      • 7.7 Market condition
        • Chart on Market condition - Five forces 2024 and 2029

      8 Market Segmentation by Product Type

      • 8.1 Market segments
        • Chart on Product Type - Market share 2024-2029 (%)
        • Data Table on Product Type - Market share 2024-2029 (%)
      • 8.2 Comparison by Product Type
        • Chart on Comparison by Product Type
        • Data Table on Comparison by Product Type
      • 8.3 Smartphones - Market size and forecast 2024-2029
        • Chart on Smartphones - Market size and forecast 2024-2029 ($ billion)
        • Data Table on Smartphones - Market size and forecast 2024-2029 ($ billion)
        • Chart on Smartphones - Year-over-year growth 2024-2029 (%)
        • Data Table on Smartphones - Year-over-year growth 2024-2029 (%)
      • 8.4 Tablets/laptops/notebooks - Market size and forecast 2024-2029
        • Chart on Tablets/laptops/notebooks - Market size and forecast 2024-2029 ($ billion)
        • Data Table on Tablets/laptops/notebooks - Market size and forecast 2024-2029 ($ billion)
        • Chart on Tablets/laptops/notebooks - Year-over-year growth 2024-2029 (%)
        • Data Table on Tablets/laptops/notebooks - Year-over-year growth 2024-2029 (%)
      • 8.5 Portable devices - Market size and forecast 2024-2029
        • Chart on Portable devices - Market size and forecast 2024-2029 ($ billion)
        • Data Table on Portable devices - Market size and forecast 2024-2029 ($ billion)
        • Chart on Portable devices - Year-over-year growth 2024-2029 (%)
        • Data Table on Portable devices - Year-over-year growth 2024-2029 (%)
      • 8.6 Digital camera - Market size and forecast 2024-2029
        • Chart on Digital camera - Market size and forecast 2024-2029 ($ billion)
        • Data Table on Digital camera - Market size and forecast 2024-2029 ($ billion)
        • Chart on Digital camera - Year-over-year growth 2024-2029 (%)
        • Data Table on Digital camera - Year-over-year growth 2024-2029 (%)
      • 8.7 Others - Market size and forecast 2024-2029
        • Chart on Others - Market size and forecast 2024-2029 ($ billion)
        • Data Table on Others - Market size and forecast 2024-2029 ($ billion)
        • Chart on Others - Year-over-year growth 2024-2029 (%)
        • Data Table on Others - Year-over-year growth 2024-2029 (%)
      • 8.8 Market opportunity by Product Type
        • Market opportunity by Product Type ($ billion)
        • Data Table on Market opportunity by Product Type ($ billion)

      9 Market Segmentation by Distribution Channel

      • 9.1 Market segments
        • Chart on Distribution Channel - Market share 2024-2029 (%)
        • Data Table on Distribution Channel - Market share 2024-2029 (%)
      • 9.2 Comparison by Distribution Channel
        • Chart on Comparison by Distribution Channel
        • Data Table on Comparison by Distribution Channel
      • 9.3 Offline - Market size and forecast 2024-2029
        • Chart on Offline - Market size and forecast 2024-2029 ($ billion)
        • Data Table on Offline - Market size and forecast 2024-2029 ($ billion)
        • Chart on Offline - Year-over-year growth 2024-2029 (%)
        • Data Table on Offline - Year-over-year growth 2024-2029 (%)
      • 9.4 Online - Market size and forecast 2024-2029
        • Chart on Online - Market size and forecast 2024-2029 ($ billion)
        • Data Table on Online - Market size and forecast 2024-2029 ($ billion)
        • Chart on Online - Year-over-year growth 2024-2029 (%)
        • Data Table on Online - Year-over-year growth 2024-2029 (%)
      • 9.5 Market opportunity by Distribution Channel
        • Market opportunity by Distribution Channel ($ billion)
        • Data Table on Market opportunity by Distribution Channel ($ billion)

      10 Market Segmentation by Application

      • 10.1 Market segments
        • Chart on Application - Market share 2024-2029 (%)
        • Data Table on Application - Market share 2024-2029 (%)
      • 10.2 Comparison by Application
        • Chart on Comparison by Application
        • Data Table on Comparison by Application
      • 10.3 Personal use - Market size and forecast 2024-2029
        • Chart on Personal use - Market size and forecast 2024-2029 ($ billion)
        • Data Table on Personal use - Market size and forecast 2024-2029 ($ billion)
        • Chart on Personal use - Year-over-year growth 2024-2029 (%)
        • Data Table on Personal use - Year-over-year growth 2024-2029 (%)
      • 10.4 Entertainment - Market size and forecast 2024-2029
        • Chart on Entertainment - Market size and forecast 2024-2029 ($ billion)
        • Data Table on Entertainment - Market size and forecast 2024-2029 ($ billion)
        • Chart on Entertainment - Year-over-year growth 2024-2029 (%)
        • Data Table on Entertainment - Year-over-year growth 2024-2029 (%)
      • 10.5 Communication - Market size and forecast 2024-2029
        • Chart on Communication - Market size and forecast 2024-2029 ($ billion)
        • Data Table on Communication - Market size and forecast 2024-2029 ($ billion)
        • Chart on Communication - Year-over-year growth 2024-2029 (%)
        • Data Table on Communication - Year-over-year growth 2024-2029 (%)
      • 10.6 Fitness and health monitoring - Market size and forecast 2024-2029
        • Chart on Fitness and health monitoring - Market size and forecast 2024-2029 ($ billion)
        • Data Table on Fitness and health monitoring - Market size and forecast 2024-2029 ($ billion)
        • Chart on Fitness and health monitoring - Year-over-year growth 2024-2029 (%)
        • Data Table on Fitness and health monitoring - Year-over-year growth 2024-2029 (%)
      • 10.7 Others - Market size and forecast 2024-2029
        • Chart on Others - Market size and forecast 2024-2029 ($ billion)
        • Data Table on Others - Market size and forecast 2024-2029 ($ billion)
        • Chart on Others - Year-over-year growth 2024-2029 (%)
        • Data Table on Others - Year-over-year growth 2024-2029 (%)
      • 10.8 Market opportunity by Application
        • Market opportunity by Application ($ billion)
        • Data Table on Market opportunity by Application ($ billion)

      11 Customer Landscape

      • 11.1 Customer landscape overview
        • Analysis of price sensitivity, lifecycle, customer purchase basket, adoption rates, and purchase criteria

      12 Geographic Landscape

      • 12.1 Geographic segmentation
        • Chart on Market share by geography 2024-2029 (%)
        • Data Table on Market share by geography 2024-2029 (%)
      • 12.2 Geographic comparison
        • Chart on Geographic comparison
        • Data Table on Geographic comparison
      • 12.3 APAC - Market size and forecast 2024-2029
        • Chart on APAC - Market size and forecast 2024-2029 ($ billion)
        • Data Table on APAC - Market size and forecast 2024-2029 ($ billion)
        • Chart on APAC - Year-over-year growth 2024-2029 (%)
        • Data Table on APAC - Year-over-year growth 2024-2029 (%)
      • 12.4 Europe - Market size and forecast 2024-2029
        • Chart on Europe - Market size and forecast 2024-2029 ($ billion)
        • Data Table on Europe - Market size and forecast 2024-2029 ($ billion)
        • Chart on Europe - Year-over-year growth 2024-2029 (%)
        • Data Table on Europe - Year-over-year growth 2024-2029 (%)
      • 12.5 North America - Market size and forecast 2024-2029
        • Chart on North America - Market size and forecast 2024-2029 ($ billion)
        • Data Table on North America - Market size and forecast 2024-2029 ($ billion)
        • Chart on North America - Year-over-year growth 2024-2029 (%)
        • Data Table on North America - Year-over-year growth 2024-2029 (%)
      • 12.6 South America - Market size and forecast 2024-2029
        • Chart on South America - Market size and forecast 2024-2029 ($ billion)
        • Data Table on South America - Market size and forecast 2024-2029 ($ billion)
        • Chart on South America - Year-over-year growth 2024-2029 (%)
        • Data Table on South America - Year-over-year growth 2024-2029 (%)
      • 12.7 Middle East and Africa - Market size and forecast 2024-2029
        • Chart on Middle East and Africa - Market size and forecast 2024-2029 ($ billion)
        • Data Table on Middle East and Africa - Market size and forecast 2024-2029 ($ billion)
        • Chart on Middle East and Africa - Year-over-year growth 2024-2029 (%)
        • Data Table on Middle East and Africa - Year-over-year growth 2024-2029 (%)
      • 12.8 US - Market size and forecast 2024-2029
        • Chart on US - Market size and forecast 2024-2029 ($ billion)
        • Data Table on US - Market size and forecast 2024-2029 ($ billion)
        • Chart on US - Year-over-year growth 2024-2029 (%)
        • Data Table on US - Year-over-year growth 2024-2029 (%)
      • 12.9 China - Market size and forecast 2024-2029
        • Chart on China - Market size and forecast 2024-2029 ($ billion)
        • Data Table on China - Market size and forecast 2024-2029 ($ billion)
        • Chart on China - Year-over-year growth 2024-2029 (%)
        • Data Table on China - Year-over-year growth 2024-2029 (%)
      • 12.10 India - Market size and forecast 2024-2029
        • Chart on India - Market size and forecast 2024-2029 ($ billion)
        • Data Table on India - Market size and forecast 2024-2029 ($ billion)
        • Chart on India - Year-over-year growth 2024-2029 (%)
        • Data Table on India - Year-over-year growth 2024-2029 (%)
      • 12.11 Canada - Market size and forecast 2024-2029
        • Chart on Canada - Market size and forecast 2024-2029 ($ billion)
        • Data Table on Canada - Market size and forecast 2024-2029 ($ billion)
        • Chart on Canada - Year-over-year growth 2024-2029 (%)
        • Data Table on Canada - Year-over-year growth 2024-2029 (%)
      • 12.12 Germany - Market size and forecast 2024-2029
        • Chart on Germany - Market size and forecast 2024-2029 ($ billion)
        • Data Table on Germany - Market size and forecast 2024-2029 ($ billion)
        • Chart on Germany - Year-over-year growth 2024-2029 (%)
        • Data Table on Germany - Year-over-year growth 2024-2029 (%)
      • 12.13 Japan - Market size and forecast 2024-2029
        • Chart on Japan - Market size and forecast 2024-2029 ($ billion)
        • Data Table on Japan - Market size and forecast 2024-2029 ($ billion)
        • Chart on Japan - Year-over-year growth 2024-2029 (%)
        • Data Table on Japan - Year-over-year growth 2024-2029 (%)
      • 12.14 UK - Market size and forecast 2024-2029
        • Chart on UK - Market size and forecast 2024-2029 ($ billion)
        • Data Table on UK - Market size and forecast 2024-2029 ($ billion)
        • Chart on UK - Year-over-year growth 2024-2029 (%)
        • Data Table on UK - Year-over-year growth 2024-2029 (%)
      • 12.15 South Korea - Market size and forecast 2024-2029
        • Chart on South Korea - Market size and forecast 2024-2029 ($ billion)
        • Data Table on South Korea - Market size and forecast 2024-2029 ($ billion)
        • Chart on South Korea - Year-over-year growth 2024-2029 (%)
        • Data Table on South Korea - Year-over-year growth 2024-2029 (%)
      • 12.16 France - Market size and forecast 2024-2029
        • Chart on France - Market size and forecast 2024-2029 ($ billion)
        • Data Table on France - Market size and forecast 2024-2029 ($ billion)
        • Chart on France - Year-over-year growth 2024-2029 (%)
        • Data Table on France - Year-over-year growth 2024-2029 (%)
      • 12.17 Italy - Market size and forecast 2024-2029
        • Chart on Italy - Market size and forecast 2024-2029 ($ billion)
        • Data Table on Italy - Market size and forecast 2024-2029 ($ billion)
        • Chart on Italy - Year-over-year growth 2024-2029 (%)
        • Data Table on Italy - Year-over-year growth 2024-2029 (%)
      • 12.18 Market opportunity by geography
        • Market opportunity by geography ($ billion)
        • Data Tables on Market opportunity by geography ($ billion)

      13 Drivers, Challenges, and Opportunity/Restraints

      • 13.1 Market drivers
        • 13.2 Market challenges
          • 13.3 Impact of drivers and challenges
            • Impact of drivers and challenges in 2024 and 2029
          • 13.4 Market opportunities/restraints

            14 Competitive Landscape

            • 14.1 Overview
              • 14.2 Competitive Landscape
                • Overview on criticality of inputs and factors of differentiation
              • 14.3 Landscape disruption
                • Overview on factors of disruption
              • 14.4 Industry risks
                • Impact of key risks on business

              15 Competitive Analysis

              • 15.1 Companies profiled
                • Companies covered
              • 15.2 Company ranking index
                • Company ranking index
              • 15.3 Market positioning of companies
                • Matrix on companies position and classification
              • 15.4 Apple Inc.
                • Apple Inc. - Overview
                • Apple Inc. - Business segments
                • Apple Inc. - Key news
                • Apple Inc. - Key offerings
                • Apple Inc. - Segment focus
                • SWOT
              • 15.5 Bajaj Electricals Ltd.
                • Bajaj Electricals Ltd. - Overview
                • Bajaj Electricals Ltd. - Business segments
                • Bajaj Electricals Ltd. - Key offerings
                • Bajaj Electricals Ltd. - Segment focus
                • SWOT
              • 15.6 Dell Technologies Inc.
                • Dell Technologies Inc. - Overview
                • Dell Technologies Inc. - Business segments
                • Dell Technologies Inc. - Key news
                • Dell Technologies Inc. - Key offerings
                • Dell Technologies Inc. - Segment focus
                • SWOT
              • 15.7 Electrolux Group
                • Electrolux Group - Overview
                • Electrolux Group - Business segments
                • Electrolux Group - Key news
                • Electrolux Group - Key offerings
                • Electrolux Group - Segment focus
                • SWOT
              • 15.8 Hitachi Ltd.
                • Hitachi Ltd. - Overview
                • Hitachi Ltd. - Business segments
                • Hitachi Ltd. - Key news
                • Hitachi Ltd. - Key offerings
                • Hitachi Ltd. - Segment focus
                • SWOT
              • 15.9 HP Inc.
                • HP Inc. - Overview
                • HP Inc. - Business segments
                • HP Inc. - Key news
                • HP Inc. - Key offerings
                • HP Inc. - Segment focus
                • SWOT
              • 15.10 Huawei Technologies Co. Ltd.
                • Huawei Technologies Co. Ltd. - Overview
                • Huawei Technologies Co. Ltd. - Product / Service
                • Huawei Technologies Co. Ltd. - Key news
                • Huawei Technologies Co. Ltd. - Key offerings
                • SWOT
              • 15.11 Koninklijke Philips NV
                • Koninklijke Philips NV - Overview
                • Koninklijke Philips NV - Business segments
                • Koninklijke Philips NV - Key news
                • Koninklijke Philips NV - Key offerings
                • Koninklijke Philips NV - Segment focus
                • SWOT
              • 15.12 Lenovo Group Ltd.
                • Lenovo Group Ltd. - Overview
                • Lenovo Group Ltd. - Business segments
                • Lenovo Group Ltd. - Key news
                • Lenovo Group Ltd. - Key offerings
                • Lenovo Group Ltd. - Segment focus
                • SWOT
              • 15.13 LG Corp.
                • LG Corp. - Overview
                • LG Corp. - Business segments
                • LG Corp. - Key news
                • LG Corp. - Key offerings
                • LG Corp. - Segment focus
                • SWOT
              • 15.14 Panasonic Holdings Corp.
                • Panasonic Holdings Corp. - Overview
                • Panasonic Holdings Corp. - Business segments
                • Panasonic Holdings Corp. - Key news
                • Panasonic Holdings Corp. - Key offerings
                • Panasonic Holdings Corp. - Segment focus
                • SWOT
              • 15.15 Samsung Electronics Co. Ltd.
                • Samsung Electronics Co. Ltd. - Overview
                • Samsung Electronics Co. Ltd. - Business segments
                • Samsung Electronics Co. Ltd. - Key news
                • Samsung Electronics Co. Ltd. - Key offerings
                • Samsung Electronics Co. Ltd. - Segment focus
                • SWOT
              • 15.16 Sony Group Corp.
                • Sony Group Corp. - Overview
                • Sony Group Corp. - Business segments
                • Sony Group Corp. - Key news
                • Sony Group Corp. - Key offerings
                • Sony Group Corp. - Segment focus
                • SWOT
              • 15.17 Toshiba Corp.
                • Toshiba Corp. - Overview
                • Toshiba Corp. - Business segments
                • Toshiba Corp. - Key news
                • Toshiba Corp. - Key offerings
                • Toshiba Corp. - Segment focus
                • SWOT
              • 15.18 Whirlpool Corp.
                • Whirlpool Corp. - Overview
                • Whirlpool Corp. - Business segments
                • Whirlpool Corp. - Key offerings
                • Whirlpool Corp. - Segment focus
                • SWOT

              16 Appendix

              • 16.1 Scope of the report
                • 16.2 Inclusions and exclusions checklist
                  • Inclusions checklist
                  • Exclusions checklist
                • 16.3 Currency conversion rates for US$
                  • Currency conversion rates for US$
                • 16.4 Research methodology
                  • Research methodology
                • 16.5 Data procurement
                  • Information sources
                • 16.6 Data validation
                  • Data validation
                • 16.7 Validation techniques employed for market sizing
                  • Validation techniques employed for market sizing
                • 16.8 Data synthesis
                  • Data synthesis
                • 16.9 360 degree market analysis
                  • 360 degree market analysis
                • 16.10 List of abbreviations
                  • List of abbreviations

                Research Methodology

                Technavio presents a detailed picture of the market by way of study, synthesis, and summation of data from multiple sources. The analysts have presented the various facets of the market with a particular focus on identifying the key industry influencers. The data thus presented is comprehensive, reliable, and the result of extensive research, both primary and secondary.

                INFORMATION SOURCES

                Primary sources

                • Manufacturers and suppliers
                • Channel partners
                • Industry experts
                • Strategic decision makers

                Secondary sources

                • Industry journals and periodicals
                • Government data
                • Financial reports of key industry players
                • Historical data
                • Press releases

                DATA ANALYSIS

                Data Synthesis

                • Collation of data
                • Estimation of key figures
                • Analysis of derived insights

                Data Validation

                • Triangulation with data models
                • Reference against proprietary databases
                • Corroboration with industry experts

                REPORT WRITING

                Qualitative

                • Market drivers
                • Market challenges
                • Market trends
                • Five forces analysis

                Quantitative

                • Market size and forecast
                • Market segmentation
                • Geographical insights
                • Competitive landscape

                Interested in this report?

                Get your sample now to see our research methodology and insights!

                Download Now

                Frequently Asked Questions

                Personal Consumer Electronics market growth will increase by $ 104.1 bn during 2025-2029 .

                The Personal Consumer Electronics market is expected to grow at a CAGR of 5.2% during 2025-2029 .

                Personal Consumer Electronics market is segmented by Product Type( Smartphones, Tablets/laptops/notebooks, Portable devices, Digital camera, Others) Distribution Channel( Offline, Online) Application( Personal use, Entertainment, Communication, Fitness and health monitoring, Others)

                Apple Inc., Bajaj Electricals Ltd., Dell Technologies Inc., Electrolux Group, Havells India Ltd., Hisense International Co. Ltd., Hitachi Ltd., HP Inc., Huawei Technologies Co. Ltd., Koninklijke Philips NV, Lenovo Group Ltd., LG Corp., Panasonic Holdings Corp., Samsung Electronics Co. Ltd., Sony Group Corp., Toshiba Corp., Whirlpool Corp., Xiaomi Inc. are a few of the key vendors in the Personal Consumer Electronics market.

                APAC will register the highest growth rate of 42% among the other regions. Therefore, the Personal Consumer Electronics market in APAC is expected to garner significant business opportunities for the vendors during the forecast period.

                US, China, Canada, India, Germany, Japan, UK, South Korea, France, Italy

                • Frequent product launches of personal consumer electronicsThe global personal consumer electronics market witness high growth owing to frequent product launches by companies. The companies in the personal consumer electronics market are continuously focused on product innovation to cater to the rising demand for consumer electronics.In January 2024 is the driving factor this market.
                • Samsung launched the Galaxy S24 series is the driving factor this market.
                • comprising the Galaxy S24 is the driving factor this market.
                • S24+ is the driving factor this market.
                • and S24 Ultra is the driving factor this market.
                • with a strong focus on AI integration under the Galaxy AI banner. The S24 and S24+ are powered by the Exynos 2400 chipset is the driving factor this market.
                • while the S24 Ultra features the Snapdragon 8 Gen 3 is the driving factor this market.
                • delivering top-tier performanceIn September 2024 is the driving factor this market.
                • Apple Inc. unveiled the iPhone 16 series at its Its Glowtime event. The lineup included four models: iPhone 16 is the driving factor this market.
                • iPhone 16 Plus is the driving factor this market.
                • iPhone 16 Pro is the driving factor this market.
                • and iPhone 16 Pro MaxIn January 2023 is the driving factor this market.
                • Samsung Electronics Co. is the driving factor this market.
                • Ltd. launched a Bespoke Infinite Line Refrigerator. It is available in refrigerator is the driving factor this market.
                • freezer is the driving factor this market.
                • or wine cellar models. Samsung new premium built-in refrigerator features a timeless and modern modular design that blends seamlessly into any interiorIn January 2023 is the driving factor this market.
                • Apple Inc. launched the MacBook Pro featuring the M2 Pro and M2 Max. The new MacBook Pro has up to 6 times faster performance than the fastest Intel-based MacBook Pro and supports up to 96 GB of unified memory for demanding professional workflowsIn September 2023 is the driving factor this market.
                • Apple Inc. introduced the iPhone 15 series is the driving factor this market.
                • comprising four models: iPhone 15 is the driving factor this market.
                • iPhone 15 Plus is the driving factor this market.
                • iPhone 15 Pro is the driving factor this market.
                • and iPhone 15 Pro MaxHence is the driving factor this market.
                • the constant introduction of new and innovative products plays a crucial role in attracting consumer interest is the driving factor this market.
                • driving sales is the driving factor this market.
                • and stimulating market growth in the forecast period. is the driving factor this market.

                The Personal Consumer Electronics market vendors should focus on grabbing business opportunities from the Smartphones segment as it accounted for the largest market share in the base year.