Laptop Market Size 2025-2029
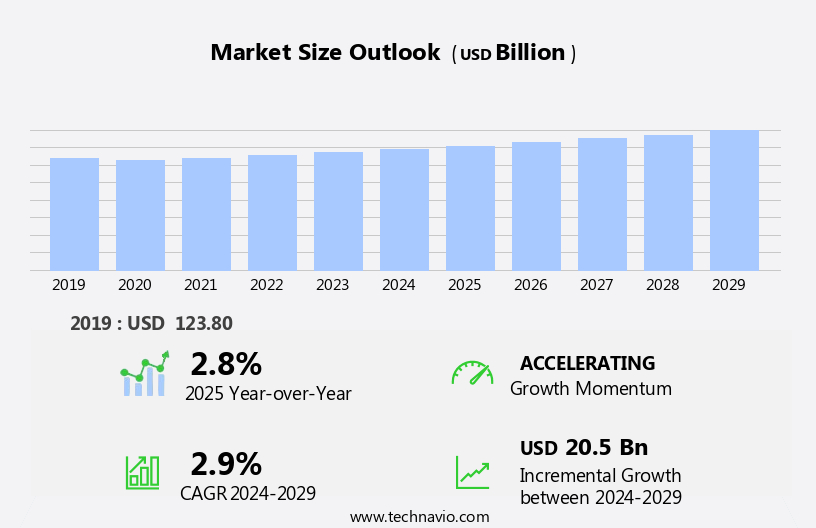
The laptop market size is estimated to increase by USD 20.5 billion at a CAGR of 2.9% between 2024 and 2029.
In the dynamic technology landscape, the laptop market continues to evolve, driven by several key factors. The growth of the corporate sector, with its increasing demand for portable and powerful computing devices, fuels market expansion. Strategic partnerships between industry leaders and technology innovators further propel advancements, enabling the creation of innovative and efficient laptops.
Additionally, the growing capabilities of smartphones and tablets have raised the bar for laptop performance, compelling manufacturers to deliver more powerful and feature-rich laptops to remain competitive. These market trends, coupled with the challenges of keeping up with evolving consumer preferences and maintaining cost competitiveness, shape the laptop market's future trajectory.
What will be the Size of the Laptop Market during the Forecast Period?

To learn more about the market report, Request Free Sample
How is the Laptop Market Segmented?
The market forecasting report provides comprehensive data (region-wise segment analysis), with forecasts and estimates in "USD billion" for the period 2025-2029, as well as historical data from 2019 - 2023 for the following segments.
- End-user
- Type
- Traditional laptop
- 2-in-1 laptop
- Screen Size
- Up to 10.9"
- 11" to 12.9"
- 13" to 14.9"
- 15.0" to 16.9"
- More than 17"
- Price
- Up to USD 500
- USD 501 to USD 1000
- USD 1001 to USD 1500
- USD 1501 to USD 2000
- Above USD 2001
- Geography
- North America
- Europe
- APAC
- South America
- Middle East and Africa
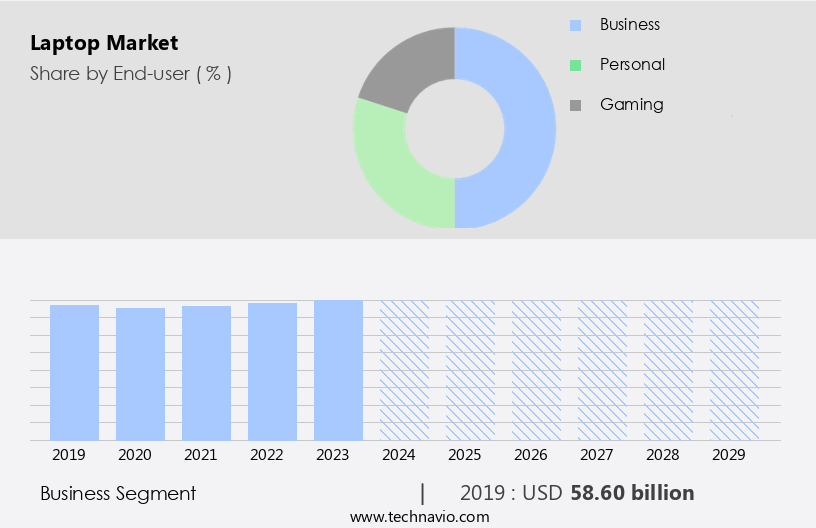
Which is the largest segment driving market growth?
- The business segment is estimated to witness significant growth during the forecast period. The global laptop market experiences significant growth due to rising disposable incomes and expanding internet connectivity. Advanced laptops, with superior system performance, design, and price-performance ratio, are increasingly preferred by individuals and businesses alike. Hardware life is another crucial factor driving the market, particularly in developing countries where the adoption of technology is on the rise. The gaming industry's growth, fueled by high-demand for high-speed graphic cards and ultra-thin body designs, contributes substantially to the market. Internet users, particularly in metropolitan cities and emerging economies, are increasingly relying on laptops for e-commerce, digital payments, and internet infrastructure needs.

Get a glance at the market share of various regions. Download the PDF Sample
- The business segment was valued at USD 58.6 billion in 2019. Affordable Android laptops cater to the personal segment, while original equipment manufacturers continue to innovate, integrating digital transformation technologies such as artificial intelligence (AI) and personalized learning into their offerings. The supply chain network, manufacturing, and the solid-state drive technology further enhance the laptop's capabilities, enabling faster processing speed, multitasking, and flexibility.
- The traditional laptop segment and the 2-in-1 laptop segment cater to diverse user needs, with mobility and computing power being key selling points. The work-from-home model and BYOD trends have also fueled the demand for laptops in both the personal and business segments. In summary, the laptop market is witnessing robust growth, driven by factors such as rising disposable incomes, expanding internet connectivity, advanced technology, and the increasing need for mobility and flexibility in both personal and professional settings.
Which region is leading the market?

For more insights on the market share of various regions, Request Free Sample
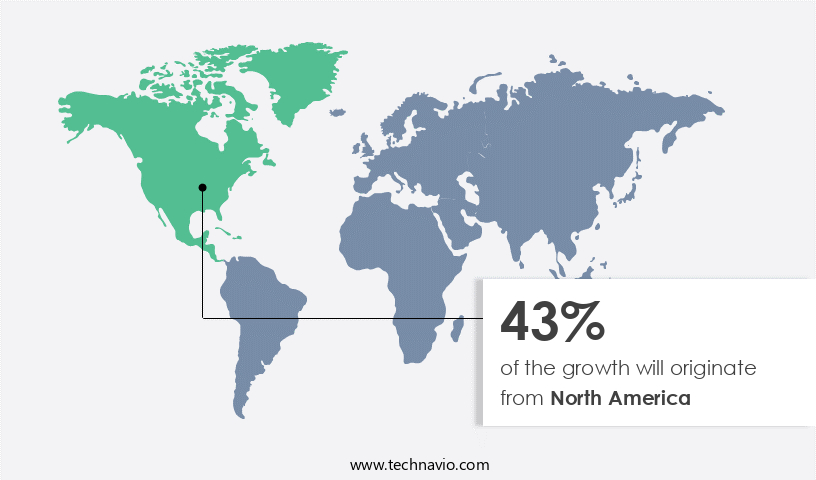
North America is estimated to contribute 43% to the growth of the global market during the forecast period. Technavio's analysts have elaborately explained the regional trends and drivers that shape the market during the forecast period.
The North American laptop market is anticipated to lead the global industry due to the region's robust gaming culture, the presence of professional eSports gamers, and the increasing availability of budget-friendly gaming laptops. Key companies, such as Apple Inc., Dell Technologies Inc., HP Inc., and Microsoft Corp., are headquartered in North America, granting them a competitive edge in supplying and distributing laptops. The popularity of video games among adults in the region, with millions engaging in gaming activities in 2020, further bolsters the market's growth.
Game development and eCommerce platforms contribute to the online sales of laptops, catering to mid-range consumers seeking high-performance graphic cards, cooled solutions, and high-refresh-rate displays for their gaming needs. Gaming laptop suppliers face intense competition analysis, necessitating the provision of advanced features to attract eSports participants and cater to the demands of gaming tournaments.
How can Technavio assist you in making critical decisions?

What is the market structure and year-over-year growth of the Laptop Market?
Market structure
|
Fragmented
|
YoY growth 2024-2025
|
2.8
|
What are the Laptop Market Dynamics Shaping Growth?
- The laptop market is experiencing significant growth due to the increasing popularity of gaming culture, eSports participants, and gaming tournaments. Advanced laptops with high-speed graphic cards and ultra-thin body designs are in high demand, catering to both mid-range consumers and professional eSports gamers. The growing internet connectivity enables online sales on eCommerce platforms, making these advanced laptops more accessible. Digital transformation in various sectors, including education, has led to an increased need for computing power and flexibility.
- Original Equipment Manufacturers (OEMs) are responding by producing laptops with high-refresh-rate displays, cooling solutions, and multitasking capabilities. The work-from-home model and BYOD (Bring Your Own Device) trends in the personal segment have further fueled the demand for laptops. Artificial Intelligence (AI) integration in laptops is a growing trend, offering personalized learning experiences and enhancing system performance. Digital payments have made purchasing these laptops more convenient, making them an affordable option for a wider audience. The laptop market is expected to continue its growth trajectory, driven by the evolving needs of consumers and the digital transformation across various industries.
- The next generation of smart devices is defined by cutting-edge technologies and features that prioritize both performance and user experience. Smart cooling systems ensure optimal thermal management, while AI processors and quantum computing power seamless, high-performance operations. Modular designs with lightweight chassis, often made from carbon fiber, enhance portability without compromising durability. Devices equipped with foldable screens, touchscreen displays, and privacy screens provide versatility and enhanced privacy. Voice recognition and gesture controls elevate user interaction, while haptic feedback and backlit keyboards improve usability in various environments. Wireless charging and extended batteries support uninterrupted use, and eco-friendly materials reflect a growing focus on sustainability. For immersive entertainment, features like cloud gaming, virtual reality, and augmented reality are powered by high-refresh displays and noise cancellation technologies. Security is bolstered through biometric systems and blockchain, ensuring data protection. Customizable hardware, port expanders, and energy-efficient designs allow users to personalize devices according to their needs, while durability features ensure long-term reliability.
Our researchers analyzed the data with 2024 as the base year, market research and growth, along with the key drivers, trends, and challenges. A holistic analysis of drivers will help companies refine their marketing strategies to gain a competitive advantage.
What are the primary factors driving the market growth?
- The increasing application of laptops in educational institutions is one of the key factors driving the market growth. The laptop market is experiencing substantial growth due to several factors. Rising disposable incomes and growing internet connectivity have expanded the consumer base for advanced laptops. System performance, design, and price-performance ratio are key considerations for both individual and enterprise clients. In developing countries, the number of internet users continues to increase, driving demand for affordable Android laptops. Original Equipment Manufacturers (OEMs) are responding to this trend by offering innovative solutions, such as digital transformation in the education sector through personalized learning and artificial intelligence (AI) in the business supply chain network.
- Additionally, the gaming industry is also a significant contributor to the market, with the demand for high-speed graphic cards and ultra-thin body designs fueling the growth of gaming laptops. The work-from-home model and BYOD trends have further increased the need for laptops in metropolitan cities and small towns alike. The 2-in-1 laptop segment and mobility offer flexibility and processing speed for multitasking professionals. Ports and docking solutions cater to the need for connectivity, while the price-performance ratio remains a crucial factor for consumers. The forecast period is expected to witness continued growth in the personal segment, as well as in emerging economies, due to the increasing popularity of e-commerce, digital payments, and internet infrastructure. The traditional laptop segment and manufacturing sectors are also adapting to the trend, with the integration of solid-state drives and manufacturing advancements.
What are the significant trends being witnessed in the market?
- The increasing adoption of gaming laptops is a key factor shaping the market growth. The laptop market is experiencing significant growth due to several factors, including rising disposable incomes, expanding internet connectivity, and the increasing demand for advanced laptops. With improved system performance, design, and price-performance ratio, laptops have become an essential tool for individuals and businesses alike. In developing countries, the growing number of internet users and the rise of e-commerce and digital payments have fueled the demand for laptops. Moreover, the laptop market is witnessing innovation in various segments.
- For instance, the gaming industry is driving the demand for laptops with high-speed graphic cards and ultra-thin body designs. The education sector is adopting laptops for personalized learning, while the supply chain network is focusing on manufacturing and solid-state drives to enhance mobility and computing power. The 2-in-1 laptop segment and work-from-home model are also contributing to the market's growth. The flexibility and processing speed of laptops make them an ideal choice for multitasking and work-from-home trends. Original equipment manufacturers (OEMs) are collaborating to develop laptops with advanced features, such as AI, to cater to the evolving needs of consumers.
- Furthermore, the laptop market is witnessing the emergence of affordable Android laptops, catering to the needs of the personal segment and small towns in metropolitan cities and emerging economies. The market is also witnessing the integration of ports and docking to enhance connectivity and productivity. Overall, the laptop market is poised for continued growth, driven by digital transformation and the increasing need for mobility and flexibility in today's world.
What are the major market challenges?
- Increasing the capabilities of smartphones and tablets is one of the key challenges hindering the market growth. The global laptop market is experiencing a shift due to the rising disposable incomes and growing internet connectivity in developing countries. Advanced laptops with superior system performance, design, and price-performance ratio are in high demand among internet users. Original Equipment Manufacturers (OEMs) are responding to this trend by introducing affordable Android laptops and 2-in-1 laptops with ultra-thin body designs, solid state drives, and high-speed graphic cards.
- The gaming industry and education sector are key growth areas, with gaming laptops featuring advanced processing speed, multitasking capabilities, and ports and docking options. The digital transformation has led to an increase in e-commerce, digital payments, and internet infrastructure development. This has created a significant demand for laptops in small towns and metropolitan cities of emerging economies. The work-from-home model and BYOD trends have further boosted the personal segment of the laptop market.
- However, the increasing capabilities of smartphones and tablets, including artificial intelligence (AI) and personalized learning, may restrict the market's growth during the forecast period. The traditional laptop segment continues to face competition from the mobility and computing power of smartphones and tablets. The 2-in-1 laptop segment, with its flexibility and processing speed, is gaining popularity among consumers. The supply chain network and manufacturing processes are being optimized to meet the demand for affordable laptops. Overall, the laptop market is expected to grow, driven by the need for advanced computing devices in various sectors and the ongoing digital transformation.
Customer Landscape
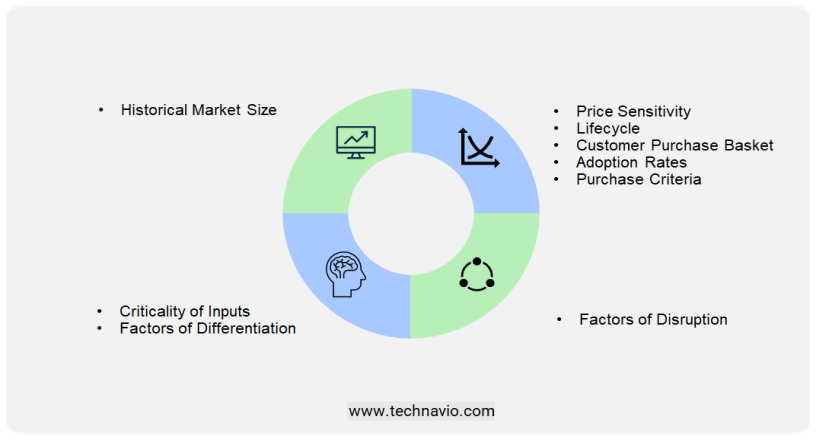
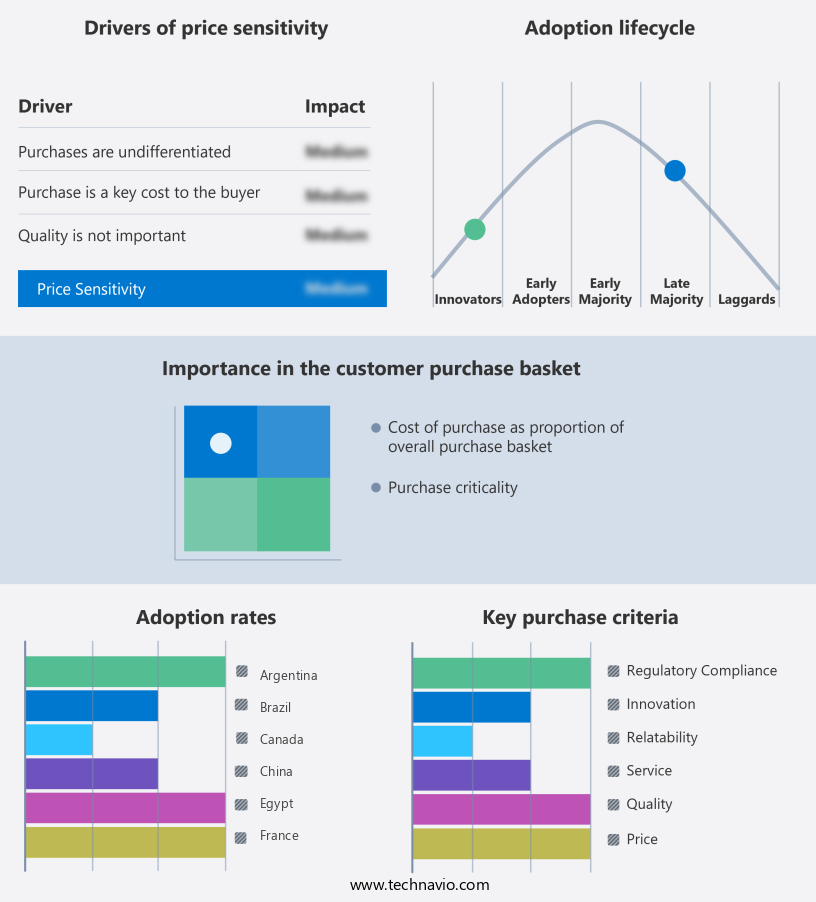
The market forecasting report includes the adoption lifecycle of the market, covering from the innovator's stage to the laggard's stage. It focuses on adoption rates in different regions based on penetration. Furthermore, the market growth analysis report also includes key purchase criteria and drivers of price sensitivity to help companies evaluate and develop their market growth analysis strategies.

Customer Landscape
How do company ranking index and market positioning come to your aid?
Companies are implementing various strategies, such as strategic alliances, partnerships, mergers and acquisitions, geographical expansion, and product/service launches, to enhance their presence in the market.
Acer Inc: The company offers laptops such as Predator Helios 300, Nitro 5, Aspire 7, and Aspire 5.
Technavio provides the ranking index for the top 20 companies along with insights on the market positioning of:
- Acer Inc.
- Alphabet Inc.
- Apple Inc.
- ASUSTeK Computer Inc.
- Dell Technologies Inc.
- HP Inc.
- Huawei Technologies Co. Ltd.
- Lenovo Group Ltd.
- LG Corp.
- Micro Star International Co. Ltd.
- Microsoft Corp
- Razer Inc.
- Samsung Electronics Co. Ltd.
- Sony Group Corp.
- Toshiba Corp.
Explore our company rankings and market positioning. Request Free Sample
What are the Latest Market Developments and News?
-
In November 2024, Dell launched a new line of ultra-lightweight laptops designed for remote work and education. The XPS 13 Plus, featuring improved processing power and a longer battery life, targets professionals and students looking for portable and high-performance computing solutions.
-
In October 2024, HP entered a partnership with Intel to incorporate the latest Intel Core Ultra processors into its new range of laptops. The collaboration aims to enhance the performance of HP's laptops, particularly in gaming and content creation, by providing faster speeds and improved power efficiency.
-
In September 2024, Apple introduced a new MacBook Pro with Apple's custom M3 chip, which offers significant performance improvements in both graphics and computing power. The new MacBook Pro is designed to cater to creative professionals who require advanced hardware for video editing, 3D rendering, and other demanding tasks.
-
In August 2024, Lenovo acquired a smaller competitor in the laptop manufacturing space, Msi Laptop Solutions, for USD 900 million. This acquisition strengthens Lenovo's position in the gaming laptop market, expanding its portfolio with high-performance models and enhancing its presence in emerging gaming regions.
Will Innovations Drive Market Growth?
- The laptop market is a significant sector in the technology industry, driven by the increasing demand for portable computing devices. With the advancement of technology, laptops have become an essential tool for both personal and professional use. The market is characterized by various segments, including display size, operating system, and price range. The demand for larger display laptops has been increasing due to their enhanced productivity and multitasking capabilities. Operating systems like Windows and macOS continue to dominate the market, offering users a wide range of applications and features.
- Moreover, the price range segment includes budget laptops, mid-range laptops, and high-end laptops, catering to different consumer needs and preferences. The market is also witnessing the emergence of new technologies like SSDs, touchscreens, and 2-in-1 laptops, adding to the market's growth. The laptop market is expected to grow further due to the increasing trend of remote work and online learning, fueled by the COVID-19 pandemic.
- Additionally, the ongoing innovation in laptop technology is expected to drive the market's growth in the coming years. In conclusion, the laptop market is a dynamic and evolving sector, driven by various factors like increasing demand, technological advancements, and changing consumer preferences. The market offers a wide range of products catering to different segments and price points, making it an exciting space to watch.
Market Scope
|
Report Coverage
|
Details
|
Page number
|
201
|
Base year
|
2024
|
Historic period
|
2019 - 2023 |
Forecast period
|
2025-2029
|
Growth momentum & CAGR
|
Accelerate at a CAGR of 2.9%
|
Market growth 2025-2029
|
USD 20.5 billion
|
Regional analysis
|
North America, Europe, APAC, South America, and Middle East and Africa
|
Performing market contribution
|
North America at 43%
|
Key countries
|
US, Germany, China, UK, Japan, Canada, France, India, Italy, and Brazil
|
Competitive landscape
|
Leading Companies, Market Positioning of Companies, Competitive Strategies, and Industry Risks |
Key companies profiled
|
Acer Inc., Alphabet Inc., Apple Inc., ASUSTeK Computer Inc., Dell Technologies Inc., HP Inc., Huawei Technologies Co. Ltd., Lenovo Group Ltd., LG Corp., Micro Star International Co. Ltd., Microsoft Corp, Razer Inc., Samsung Electronics Co. Ltd., Sony Group Corp., and Toshiba Corp.
|
Market Segmentation
|
End-user (Business, Personal, and Gaming), Type (Traditional laptop and 2-in-1 laptop), and Geography (North America, Europe, APAC, South America, and Middle East and Africa)
|
Customization purview
|
If our market forecast report has not included the data that you are looking for, you can reach out to our analysts and get segments customized.
|
Download PDF Sample
What are the Key Data Covered in this Market Research Report?
- CAGR of the market during the forecast period
- Detailed information on factors that will drive the market growth and forecasting between 2025 and 2029
- Precise estimation of the size of the market and its contribution of the market in focus to the parent market
- Accurate predictions about upcoming market growth and trends and changes in consumer behavior
- Growth of the market across North America, Europe, APAC, South America, and Middle East and Africa
- Thorough analysis of the market's competitive landscape and detailed information about companies
- Comprehensive analysis of factors that will challenge the growth of market companies
1 Executive Summary
- 1.1 Market overview
- Executive Summary - Chart on Market Overview
- Executive Summary - Data Table on Market Overview
- Executive Summary - Chart on Global Market Characteristics
- Executive Summary - Chart on Market by Geography
- Executive Summary - Chart on Market Segmentation by End-user
- Executive Summary - Chart on Market Segmentation by Type
- Executive Summary - Chart on Incremental Growth
- Executive Summary - Data Table on Incremental Growth
- Executive Summary - Chart on Company Market Positioning
2 Technavio Analysis
- 2.1 Analysis of price sensitivity, lifecycle, customer purchase basket, adoption rates, and purchase criteria
- Analysis of price sensitivity, lifecycle, customer purchase basket, adoption rates, and purchase criteria
- 2.2 Criticality of inputs and Factors of differentiation
- Overview on criticality of inputs and factors of differentiation
- 2.3 Factors of disruption
- Overview on factors of disruption
- 2.4 Impact of drivers and challenges
- Impact of drivers and challenges in 2024 and 2029
3 Market Landscape
- 3.1 Market ecosystem
- Parent Market
- Data Table on - Parent Market
- 3.2 Market characteristics
- Market characteristics analysis
4 Market Sizing
- 4.1 Market definition
- Offerings of companies included in the market definition
- 4.2 Market segment analysis
- 4.4 Market outlook: Forecast for 2024-2029
- Chart on Global - Market size and forecast 2024-2029 ($ billion)
- Data Table on Global - Market size and forecast 2024-2029 ($ billion)
- Chart on Global Market: Year-over-year growth 2024-2029 (%)
- Data Table on Global Market: Year-over-year growth 2024-2029 (%)
5 Historic Market Size
- 5.1 Global Laptop Market 2019 - 2023
- Historic Market Size - Data Table on Global Laptop Market 2019 - 2023 ($ billion)
- 5.2 End-user segment analysis 2019 - 2023
- Historic Market Size - End-user Segment 2019 - 2023 ($ billion)
- 5.3 Type segment analysis 2019 - 2023
- Historic Market Size - Type Segment 2019 - 2023 ($ billion)
- 5.4 Geography segment analysis 2019 - 2023
- Historic Market Size - Geography Segment 2019 - 2023 ($ billion)
- 5.5 Country segment analysis 2019 - 2023
- Historic Market Size - Country Segment 2019 - 2023 ($ billion)
6 Qualitative Analysis
- 6.1 The AI impact on Global Laptop Market
7 Five Forces Analysis
- 7.1 Five forces summary
- Five forces analysis - Comparison between 2024 and 2029
- 7.2 Bargaining power of buyers
- Bargaining power of buyers - Impact of key factors 2024 and 2029
- 7.3 Bargaining power of suppliers
- Bargaining power of suppliers - Impact of key factors in 2024 and 2029
- 7.4 Threat of new entrants
- Threat of new entrants - Impact of key factors in 2024 and 2029
- 7.5 Threat of substitutes
- Threat of substitutes - Impact of key factors in 2024 and 2029
- 7.6 Threat of rivalry
- Threat of rivalry - Impact of key factors in 2024 and 2029
- 7.7 Market condition
- Chart on Market condition - Five forces 2024 and 2029
8 Market Segmentation by End-user
- 8.1 Market segments
- Chart on End-user - Market share (2024-2029) (%)
- Data Table on End-user - Market share (2024-2029) (%)
- 8.2 Comparison by End-user
- Chart on Comparison by End-user
- Data Table on Comparison by End-user
- 8.3 Business - Market size and forecast (2024-2029)
- Chart on Business - Market size and forecast (2024-2029) ($ billion)
- Data Table on Business - Market size and forecast (2024-2029) ($ billion)
- Chart on Business - Year-over-year growth (2024-2029) (%)
- Data Table on Business - Year-over-year growth (2024-2029) (%)
- 8.4 Personal - Market size and forecast (2024-2029)
- Chart on Personal - Market size and forecast (2024-2029) ($ billion)
- Data Table on Personal - Market size and forecast (2024-2029) ($ billion)
- Chart on Personal - Year-over-year growth (2024-2029) (%)
- Data Table on Personal - Year-over-year growth (2024-2029) (%)
- 8.5 Gaming - Market size and forecast (2024-2029)
- Chart on Gaming - Market size and forecast (2024-2029) ($ billion)
- Data Table on Gaming - Market size and forecast (2024-2029) ($ billion)
- Chart on Gaming - Year-over-year growth (2024-2029) (%)
- Data Table on Gaming - Year-over-year growth (2024-2029) (%)
- 8.6 Market opportunity by End-user
- Market opportunity by End-user ($ billion)
- Data Table on Market opportunity by End-user ($ billion)
9 Market Segmentation by Type
- 9.1 Market segments
- Chart on Type - Market share (2024-2029) (%)
- Data Table on Type - Market share (2024-2029) (%)
- 9.2 Comparison by Type
- Chart on Comparison by Type
- Data Table on Comparison by Type
- 9.3 Traditional laptop - Market size and forecast (2024-2029)
- Chart on Traditional laptop - Market size and forecast (2024-2029) ($ billion)
- Data Table on Traditional laptop - Market size and forecast (2024-2029) ($ billion)
- Chart on Traditional laptop - Year-over-year growth (2024-2029) (%)
- Data Table on Traditional laptop - Year-over-year growth (2024-2029) (%)
- 2-in-1 laptop - Market size and forecast (2024-2029)
- Chart on 2-in-1 laptop - Market size and forecast (2024-2029) ($ billion)
- Data Table on 2-in-1 laptop - Market size and forecast (2024-2029) ($ billion)
- Chart on 2-in-1 laptop - Year-over-year growth (2024-2029) (%)
- Data Table on 2-in-1 laptop - Year-over-year growth (2024-2029) (%)
- 9.5 Market opportunity by Type
- Market opportunity by Type ($ billion)
- Data Table on Market opportunity by Type ($ billion)
10 Market Segmentation by Screen Size
- 10.1 Market segments
- Chart on Screen Size - Market share (2024-2029) (%)
- Data Table on Screen Size - Market share (2024-2029) (%)
- 10.2 Comparison by Screen Size
- Chart on Comparison by Screen Size
- Data Table on Comparison by Screen Size
- 10.3 Up to 10.9" - Market size and forecast (2024-2029)
- Chart on Up to 10.9" - Market size and forecast (2024-2029) ($ billion)
- Data Table on Up to 10.9" - Market size and forecast (2024-2029) ($ billion)
- Chart on Up to 10.9" - Year-over-year growth (2024-2029) (%)
- Data Table on Up to 10.9" - Year-over-year growth (2024-2029) (%)
- 11" to 12.9" - Market size and forecast (2024-2029)
- Chart on 11" to 12.9" - Market size and forecast (2024-2029) ($ billion)
- Data Table on 11" to 12.9" - Market size and forecast (2024-2029) ($ billion)
- Chart on 11" to 12.9" - Year-over-year growth (2024-2029) (%)
- Data Table on 11" to 12.9" - Year-over-year growth (2024-2029) (%)
- 13" to 14.9" - Market size and forecast (2024-2029)
- Chart on 13" to 14.9" - Market size and forecast (2024-2029) ($ billion)
- Data Table on 13" to 14.9" - Market size and forecast (2024-2029) ($ billion)
- Chart on 13" to 14.9" - Year-over-year growth (2024-2029) (%)
- Data Table on 13" to 14.9" - Year-over-year growth (2024-2029) (%)
- 15.0" to 16.9" - Market size and forecast (2024-2029)
- Chart on 15.0" to 16.9" - Market size and forecast (2024-2029) ($ billion)
- Data Table on 15.0" to 16.9" - Market size and forecast (2024-2029) ($ billion)
- Chart on 15.0" to 16.9" - Year-over-year growth (2024-2029) (%)
- Data Table on 15.0" to 16.9" - Year-over-year growth (2024-2029) (%)
- 10.7 More than 17" - Market size and forecast (2024-2029)
- Chart on More than 17" - Market size and forecast (2024-2029) ($ billion)
- Data Table on More than 17" - Market size and forecast (2024-2029) ($ billion)
- Chart on More than 17" - Year-over-year growth (2024-2029) (%)
- Data Table on More than 17" - Year-over-year growth (2024-2029) (%)
- 10.8 Market opportunity by Screen Size
- Market opportunity by Screen Size ($ billion)
- Data Table on Market opportunity by Screen Size ($ billion)
11 Market Segmentation by Price
- 11.1 Market segments
- Chart on Price - Market share (2024-2029) (%)
- Data Table on Price - Market share (2024-2029) (%)
- 11.2 Comparison by Price
- Chart on Comparison by Price
- Data Table on Comparison by Price
- 11.3 Up to USD 500 - Market size and forecast (2024-2029)
- Chart on Up to USD 500 - Market size and forecast (2024-2029) ($ billion)
- Data Table on Up to USD 500 - Market size and forecast (2024-2029) ($ billion)
- Chart on Up to USD 500 - Year-over-year growth (2024-2029) (%)
- Data Table on Up to USD 500 - Year-over-year growth (2024-2029) (%)
- 11.4 USD 501 to USD 1000 - Market size and forecast (2024-2029)
- Chart on USD 501 to USD 1000 - Market size and forecast (2024-2029) ($ billion)
- Data Table on USD 501 to USD 1000 - Market size and forecast (2024-2029) ($ billion)
- Chart on USD 501 to USD 1000 - Year-over-year growth (2024-2029) (%)
- Data Table on USD 501 to USD 1000 - Year-over-year growth (2024-2029) (%)
- 11.5 USD 1001 to USD 1500 - Market size and forecast (2024-2029)
- Chart on USD 1001 to USD 1500 - Market size and forecast (2024-2029) ($ billion)
- Data Table on USD 1001 to USD 1500 - Market size and forecast (2024-2029) ($ billion)
- Chart on USD 1001 to USD 1500 - Year-over-year growth (2024-2029) (%)
- Data Table on USD 1001 to USD 1500 - Year-over-year growth (2024-2029) (%)
- 11.6 USD 1501 to USD 2000 - Market size and forecast (2024-2029)
- Chart on USD 1501 to USD 2000 - Market size and forecast (2024-2029) ($ billion)
- Data Table on USD 1501 to USD 2000 - Market size and forecast (2024-2029) ($ billion)
- Chart on USD 1501 to USD 2000 - Year-over-year growth (2024-2029) (%)
- Data Table on USD 1501 to USD 2000 - Year-over-year growth (2024-2029) (%)
- 11.7 Above USD 2001 - Market size and forecast (2024-2029)
- Chart on Above USD 2001 - Market size and forecast (2024-2029) ($ billion)
- Data Table on Above USD 2001 - Market size and forecast (2024-2029) ($ billion)
- Chart on Above USD 2001 - Year-over-year growth (2024-2029) (%)
- Data Table on Above USD 2001 - Year-over-year growth (2024-2029) (%)
- 11.8 Market opportunity by Price
- Market opportunity by Price ($ billion)
- Data Table on Market opportunity by Price ($ billion)
12 Customer Landscape
- 12.1 Customer landscape overview
- Analysis of price sensitivity, lifecycle, customer purchase basket, adoption rates, and purchase criteria
13 Geographic Landscape
- 13.1 Geographic segmentation
- Chart on Market share by geography 2024-2029 (%)
- Data Table on Market share by geography 2024-2029 (%)
- 13.2 Geographic comparison
- Chart on Geographic comparison
- Data Table on Geographic comparison
- 13.3 North America - Market size and forecast 2024-2029
- Chart on North America - Market size and forecast 2024-2029 ($ billion)
- Data Table on North America - Market size and forecast 2024-2029 ($ billion)
- Chart on North America - Year-over-year growth 2024-2029 (%)
- Data Table on North America - Year-over-year growth 2024-2029 (%)
- 13.4 Europe - Market size and forecast 2024-2029
- Chart on Europe - Market size and forecast 2024-2029 ($ billion)
- Data Table on Europe - Market size and forecast 2024-2029 ($ billion)
- Chart on Europe - Year-over-year growth 2024-2029 (%)
- Data Table on Europe - Year-over-year growth 2024-2029 (%)
- 13.5 APAC - Market size and forecast 2024-2029
- Chart on APAC - Market size and forecast 2024-2029 ($ billion)
- Data Table on APAC - Market size and forecast 2024-2029 ($ billion)
- Chart on APAC - Year-over-year growth 2024-2029 (%)
- Data Table on APAC - Year-over-year growth 2024-2029 (%)
- 13.6 South America - Market size and forecast 2024-2029
- Chart on South America - Market size and forecast 2024-2029 ($ billion)
- Data Table on South America - Market size and forecast 2024-2029 ($ billion)
- Chart on South America - Year-over-year growth 2024-2029 (%)
- Data Table on South America - Year-over-year growth 2024-2029 (%)
- 13.7 Middle East and Africa - Market size and forecast 2024-2029
- Chart on Middle East and Africa - Market size and forecast 2024-2029 ($ billion)
- Data Table on Middle East and Africa - Market size and forecast 2024-2029 ($ billion)
- Chart on Middle East and Africa - Year-over-year growth 2024-2029 (%)
- Data Table on Middle East and Africa - Year-over-year growth 2024-2029 (%)
- 13.8 US - Market size and forecast 2024-2029
- Chart on US - Market size and forecast 2024-2029 ($ billion)
- Data Table on US - Market size and forecast 2024-2029 ($ billion)
- Chart on US - Year-over-year growth 2024-2029 (%)
- Data Table on US - Year-over-year growth 2024-2029 (%)
- 13.9 Germany - Market size and forecast 2024-2029
- Chart on Germany - Market size and forecast 2024-2029 ($ billion)
- Data Table on Germany - Market size and forecast 2024-2029 ($ billion)
- Chart on Germany - Year-over-year growth 2024-2029 (%)
- Data Table on Germany - Year-over-year growth 2024-2029 (%)
- 13.10 China - Market size and forecast 2024-2029
- Chart on China - Market size and forecast 2024-2029 ($ billion)
- Data Table on China - Market size and forecast 2024-2029 ($ billion)
- Chart on China - Year-over-year growth 2024-2029 (%)
- Data Table on China - Year-over-year growth 2024-2029 (%)
- 13.11 UK - Market size and forecast 2024-2029
- Chart on UK - Market size and forecast 2024-2029 ($ billion)
- Data Table on UK - Market size and forecast 2024-2029 ($ billion)
- Chart on UK - Year-over-year growth 2024-2029 (%)
- Data Table on UK - Year-over-year growth 2024-2029 (%)
- 13.12 Japan - Market size and forecast 2024-2029
- Chart on Japan - Market size and forecast 2024-2029 ($ billion)
- Data Table on Japan - Market size and forecast 2024-2029 ($ billion)
- Chart on Japan - Year-over-year growth 2024-2029 (%)
- Data Table on Japan - Year-over-year growth 2024-2029 (%)
- 13.13 Canada - Market size and forecast 2024-2029
- Chart on Canada - Market size and forecast 2024-2029 ($ billion)
- Data Table on Canada - Market size and forecast 2024-2029 ($ billion)
- Chart on Canada - Year-over-year growth 2024-2029 (%)
- Data Table on Canada - Year-over-year growth 2024-2029 (%)
- 13.14 France - Market size and forecast 2024-2029
- Chart on France - Market size and forecast 2024-2029 ($ billion)
- Data Table on France - Market size and forecast 2024-2029 ($ billion)
- Chart on France - Year-over-year growth 2024-2029 (%)
- Data Table on France - Year-over-year growth 2024-2029 (%)
- 13.15 India - Market size and forecast 2024-2029
- Chart on India - Market size and forecast 2024-2029 ($ billion)
- Data Table on India - Market size and forecast 2024-2029 ($ billion)
- Chart on India - Year-over-year growth 2024-2029 (%)
- Data Table on India - Year-over-year growth 2024-2029 (%)
- 13.16 Italy - Market size and forecast 2024-2029
- Chart on Italy - Market size and forecast 2024-2029 ($ billion)
- Data Table on Italy - Market size and forecast 2024-2029 ($ billion)
- Chart on Italy - Year-over-year growth 2024-2029 (%)
- Data Table on Italy - Year-over-year growth 2024-2029 (%)
- 13.17 Brazil - Market size and forecast 2024-2029
- Chart on Brazil - Market size and forecast 2024-2029 ($ billion)
- Data Table on Brazil - Market size and forecast 2024-2029 ($ billion)
- Chart on Brazil - Year-over-year growth 2024-2029 (%)
- Data Table on Brazil - Year-over-year growth 2024-2029 (%)
- 13.18 Market opportunity by geography
- Market opportunity by geography ($ billion)
- Data Tables on Market opportunity by geography ($ billion)
- 13.19 UAE - Market size and forecast (2024-2029)
- Chart on UAE - Market size and forecast (2024-2029) ($ billion)
- Data Table on UAE - Market size and forecast (2024-2029) ($ billion)
- Chart on UAE - Year-over-year growth (2024-2029) (%)
- Data Table on UAE - Year-over-year growth (2024-2029) (%)
- 13.20 Rest of World (ROW) - Market size and forecast (2024-2029)
- Chart on Rest of World (ROW) - Market size and forecast (2024-2029) ($ billion)
- Data Table on Rest of World (ROW) - Market size and forecast (2024-2029) ($ billion)
- Chart on Rest of World (ROW) - Year-over-year growth (2024-2029) (%)
- Data Table on Rest of World (ROW) - Year-over-year growth (2024-2029) (%)
14 Drivers, Challenges, and Opportunity/Restraints
- 14.3 Impact of drivers and challenges
- Impact of drivers and challenges in 2024 and 2029
- 14.4 Market opportunities/restraints
15 Competitive Landscape
- 15.2 Competitive Landscape
- Overview on criticality of inputs and factors of differentiation
- 15.3 Landscape disruption
- Overview on factors of disruption
- 15.4 Industry risks
- Impact of key risks on business
16 Competitive Analysis
- 16.2 Market positioning of companies
- Matrix on companies position and classification
- 16.3 Apple Inc. (United States)
- Apple Inc. (United States) - Overview
- Apple Inc. (United States) - Product / Service
- Apple Inc. (United States) - Key offerings
- 16.4 Dell Technologies Inc. (United States)
- Dell Technologies Inc. (United States) - Overview
- Dell Technologies Inc. (United States) - Product / Service
- Dell Technologies Inc. (United States) - Key offerings
- 16.5 HP Inc. (United States)
- HP Inc. (United States) - Overview
- HP Inc. (United States) - Product / Service
- HP Inc. (United States) - Key offerings
- 16.6 Lenovo Group Ltd. (China)
- Lenovo Group Ltd. (China) - Overview
- Lenovo Group Ltd. (China) - Product / Service
- Lenovo Group Ltd. (China) - Key offerings
- 16.7 AsusTek Computer Inc. (Taiwan)
- AsusTek Computer Inc. (Taiwan) - Overview
- AsusTek Computer Inc. (Taiwan) - Product / Service
- AsusTek Computer Inc. (Taiwan) - Key offerings
- 16.8 Acer Inc. (Taiwan)
- Acer Inc. (Taiwan) - Overview
- Acer Inc. (Taiwan) - Product / Service
- Acer Inc. (Taiwan) - Key offerings
- 16.9 Microsoft Corporation (United States)
- Microsoft Corporation (United States) - Overview
- Microsoft Corporation (United States) - Product / Service
- Microsoft Corporation (United States) - Key offerings
- 16.10 Toshiba Corporation (Japan)
- Toshiba Corporation (Japan) - Overview
- Toshiba Corporation (Japan) - Product / Service
- Toshiba Corporation (Japan) - Key offerings
- 16.11 Fujitsu Limited (Japan)
- Fujitsu Limited (Japan) - Overview
- Fujitsu Limited (Japan) - Product / Service
- Fujitsu Limited (Japan) - Key offerings
- 16.12 Razer Inc. (United States)
- Razer Inc. (United States) - Overview
- Razer Inc. (United States) - Product / Service
- Razer Inc. (United States) - Key offerings
- 16.13 Alienware (United States)
- Alienware (United States) - Overview
- Alienware (United States) - Product / Service
- Alienware (United States) - Key offerings
- 16.14 Wistron Corporation (Taiwan, operations)
- Wistron Corporation (Taiwan, operations) - Overview
- Wistron Corporation (Taiwan, operations) - Product / Service
- Wistron Corporation (Taiwan, operations) - Key offerings
- 16.15 Quanta Computer Inc. (Taiwan, operations)
- Quanta Computer Inc. (Taiwan, operations) - Overview
- Quanta Computer Inc. (Taiwan, operations) - Product / Service
- Quanta Computer Inc. (Taiwan, operations) - Key offerings
- 16.16 Compal Electronics Inc. (Taiwan, operations)
- Compal Electronics Inc. (Taiwan, operations) - Overview
- Compal Electronics Inc. (Taiwan, operations) - Product / Service
- Compal Electronics Inc. (Taiwan, operations) - Key offerings
- 16.17 Inventec Corporation (Taiwan, operations)
- Inventec Corporation (Taiwan, operations) - Overview
- Inventec Corporation (Taiwan, operations) - Product / Service
- Inventec Corporation (Taiwan, operations) - Key offerings
- 16.18 Pegatron Corporation (Taiwan, operations)
- Pegatron Corporation (Taiwan, operations) - Overview
- Pegatron Corporation (Taiwan, operations) - Product / Service
- Pegatron Corporation (Taiwan, operations) - Key offerings
- 16.19 Clevo Corporation (Taiwan, operations)
- Clevo Corporation (Taiwan, operations) - Overview
- Clevo Corporation (Taiwan, operations) - Product / Service
- Clevo Corporation (Taiwan, operations) - Key offerings
- 16.20 HCL Technologies Ltd. (India, operations)
- HCL Technologies Ltd. (India, operations) - Overview
- HCL Technologies Ltd. (India, operations) - Product / Service
- HCL Technologies Ltd. (India, operations) - Key offerings
- 16.21 Wipro Ltd. (India, operations)
- Wipro Ltd. (India, operations) - Overview
- Wipro Ltd. (India, operations) - Product / Service
- Wipro Ltd. (India, operations) - Key offerings
- 16.22 Positivo Tecnologia S.A. (Brazil)
- Positivo Tecnologia S.A. (Brazil) - Overview
- Positivo Tecnologia S.A. (Brazil) - Product / Service
- Positivo Tecnologia S.A. (Brazil) - Key offerings
- 16.23 Acer Inc.
- Acer Inc. - Overview
- Acer Inc. - Product / Service
- Acer Inc. - Key offerings
- 16.24 Alphabet Inc.
- Alphabet Inc. - Overview
- Alphabet Inc. - Product / Service
- Alphabet Inc. - Key offerings
- 16.25 Apple Inc.
- Apple Inc. - Overview
- Apple Inc. - Product / Service
- Apple Inc. - Key offerings
- 16.26 ASUSTeK Computer Inc.
- ASUSTeK Computer Inc. - Overview
- ASUSTeK Computer Inc. - Product / Service
- ASUSTeK Computer Inc. - Key offerings
- 16.27 Dell Technologies Inc.
- Dell Technologies Inc. - Overview
- Dell Technologies Inc. - Product / Service
- Dell Technologies Inc. - Key offerings
- 16.28 HP Inc.
- HP Inc. - Overview
- HP Inc. - Product / Service
- HP Inc. - Key offerings
- 16.29 Huawei Technologies Co. Ltd.
- Huawei Technologies Co. Ltd. - Overview
- Huawei Technologies Co. Ltd. - Product / Service
- Huawei Technologies Co. Ltd. - Key offerings
- 16.30 Lenovo Group Ltd.
- Lenovo Group Ltd. - Overview
- Lenovo Group Ltd. - Product / Service
- Lenovo Group Ltd. - Key offerings
- 16.31 LG Corp.
- LG Corp. - Overview
- LG Corp. - Product / Service
- LG Corp. - Key offerings
- 16.32 Micro Star International Co. Ltd.
- Micro Star International Co. Ltd. - Overview
- Micro Star International Co. Ltd. - Product / Service
- Micro Star International Co. Ltd. - Key offerings
- 16.33 Microsoft Corp
- Microsoft Corp - Overview
- Microsoft Corp - Product / Service
- Microsoft Corp - Key offerings
- 16.34 Razer Inc.
- Razer Inc. - Overview
- Razer Inc. - Product / Service
- Razer Inc. - Key offerings
- 16.35 Samsung Electronics Co. Ltd.
- Samsung Electronics Co. Ltd. - Overview
- Samsung Electronics Co. Ltd. - Product / Service
- Samsung Electronics Co. Ltd. - Key offerings
- 16.36 Sony Group Corp.
- Sony Group Corp. - Overview
- Sony Group Corp. - Product / Service
- Sony Group Corp. - Key offerings
- 16.37 Toshiba Corp.
- Toshiba Corp. - Overview
- Toshiba Corp. - Product / Service
- Toshiba Corp. - Key offerings
17 Appendix
- 17.2 Inclusions and exclusions checklist
- Inclusions checklist
- Exclusions checklist
- 17.3 Currency conversion rates for US$
- Currency conversion rates for US$
- 17.4 Research methodology
- 17.7 Validation techniques employed for market sizing
- Validation techniques employed for market sizing
- 17.9 360 degree market analysis
- 360 degree market analysis
- 17.10 List of abbreviations
Research Framework
Technavio presents a detailed picture of the market by way of study, synthesis, and summation of data from multiple sources. The analysts have presented the various facets of the market with a particular focus on identifying the key industry influencers. The data thus presented is comprehensive, reliable, and the result of extensive research, both primary and secondary.
INFORMATION SOURCES
Primary sources
- Manufacturers and suppliers
- Channel partners
- Industry experts
- Strategic decision makers
Secondary sources
- Industry journals and periodicals
- Government data
- Financial reports of key industry players
- Historical data
- Press releases

DATA ANALYSIS
Data Synthesis
- Collation of data
- Estimation of key figures
- Analysis of derived insights
Data Validation
- Triangulation with data models
- Reference against proprietary databases
- Corroboration with industry experts

REPORT WRITING
Qualitative
- Market drivers
- Market challenges
- Market trends
- Five forces analysis
Quantitative
- Market size and forecast
- Market segmentation
- Geographical insights
- Competitive landscape