PET Bottle Market Analysis APAC, Europe, North America, Middle East and Africa, South America - US, China, India, Germany, UK, Japan, Canada, South Korea, France, Italy - Size and Forecast 2024-2028

PET Bottle Market Analysis APAC, Europe, North America, Middle East and Africa, South America - US, China, India, Germany, UK, Japan, Canada, South Korea, France, Italy - Size and Forecast 2024-2028

Published: Nov 2024 164 Pages SKU: IRTNTR72006

Market Overview at a Glance

$9.21 B
Market Opportunity
3.4%
CAGR
3.3
YoY growth 2023-2024(%)

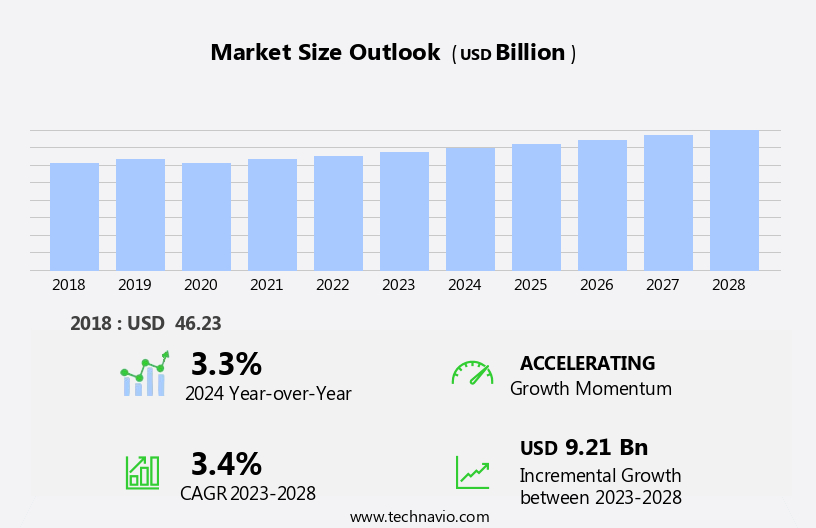
PET Bottle Market Size 2024-2028

The PET bottle market size is forecast to increase by USD 9.21 billion, at a CAGR of 3.4% between 2023 and 2028.

  • The market is witnessing significant growth, driven by the increasing adoption of PET as a preferred packaging solution due to its lightweight, shatter-resistant, and recyclable properties. This trend is particularly prominent in the food and beverage industries, where consumer preferences for convenient, portable, and sustainable packaging options are on the rise. However, the market faces challenges from stringent government regulations and policies on the use of plastics, aimed at reducing environmental impact and promoting eco-friendly alternatives. These regulations may increase production costs and potentially restrict market growth.
  • Additionally, the growing popularity of lightweight packaging, while beneficial for reducing transportation costs and carbon emissions, poses challenges in maintaining the required strength and durability for certain applications. Companies in the market must navigate these regulatory and technical challenges to capitalize on the market's potential and meet evolving consumer demands for sustainable and convenient packaging solutions.

What will be the Size of the PET Bottle Market during the forecast period?

PET Bottle Market Size

Explore in-depth regional segment analysis with market size data - historical 2018-2022 and forecasts 2024-2028 - in the full report.  
Request Free Sample

The market continues to evolve, shaped by various dynamics and applications across diverse sectors. Consumer preferences for sustainable packaging solutions and extended shelf life drive the demand for oxygen barrier properties and lightweight packaging. Polyethylene terephthalate (PET) remains a popular choice due to its UV resistance and circular economy potential. EU regulations and FDA approval processes influence market activities, ensuring food safety and regulatory compliance. Blow molding techniques, such as extrusion and injection, offer versatility in manufacturing preforms. Recycling infrastructure and waste management strategies play a crucial role in the circular economy, with recycled PET content gaining traction. Closure systems and neck finishes are essential components, ensuring product differentiation and brand perception.

Supply chain complexities and distribution networks require quality control measures. Packaging films with barrier properties enhance product protection and shelf life. The market's continuous dynamism is reflected in the evolving use of PET resins, including PET flakes, post-industrial recycled PET, and post-consumer recycled PET. Mechanical and chemical recycling processes contribute to the circular economy, while sorting technologies and reprocessing plants optimize waste management. Market players navigate these intricacies, focusing on innovation, cost analysis, and sustainability to meet consumer demands and regulatory requirements. The market's ongoing evolution underscores its significance in various industries, from food and beverage to pharmaceuticals and beyond.

How is this PET Bottle Industry segmented?

The PET bottle industry research report provides comprehensive data (region-wise segment analysis), with forecasts and estimates in "USD billion" for the period 2024-2028, as well as historical data from 2018-2022 for the following segments.

  • End-user
    • Food and beverage
    • Household
    • Personal care
    • Others
  • Geography
    • North America
      • US
    • Europe
      • Germany
      • UK
    • APAC
      • China
      • India
    • Rest of World (ROW)

By End-user Insights

The food and beverage segment is estimated to witness significant growth during the forecast period.

The market is driven by the food and beverage industry, which holds the largest market share due to the increasing consumption of packaged beverages worldwide. Urbanization and changing food habits, population growth, and rising purchasing power have fueled the demand for convenient, single-serve packaging solutions. The global consumption of packaged beverages, including alcoholic and non-alcoholic varieties, has been on the rise for over a decade. Food safety is a critical factor in the market, with regulatory bodies like the FDA imposing strict approval processes. The use of recycled PET content, both post-industrial and post-consumer, is a significant trend in the market, contributing to the circular economy and reducing carbon footprint.

The circular economy also necessitates a robust recycling infrastructure, including sorting technologies and reprocessing plants, to ensure effective collection and processing of PET bottles. PET bottles offer advantages such as long shelf life, UV resistance, and oxygen barrier properties, making them ideal for various applications. Consumer preferences for lightweight packaging and cost-effective solutions have led to the development of advanced packaging films and technologies like extrusion blow molding and stretch blow molding. Injection molding and blow molding are common manufacturing processes, while pharmaceutical and food-grade PET is used in specialized applications. Regulatory compliance, including EU regulations, is crucial in the market.

Quality control measures and supply chain optimization are essential to maintain brand perception and product differentiation. The market also encompasses various technologies like mechanical and chemical recycling, neck finishes, and closure systems, ensuring the versatility and adaptability of PET bottles in diverse industries.

PET Bottle Market Size

Request Free Sample

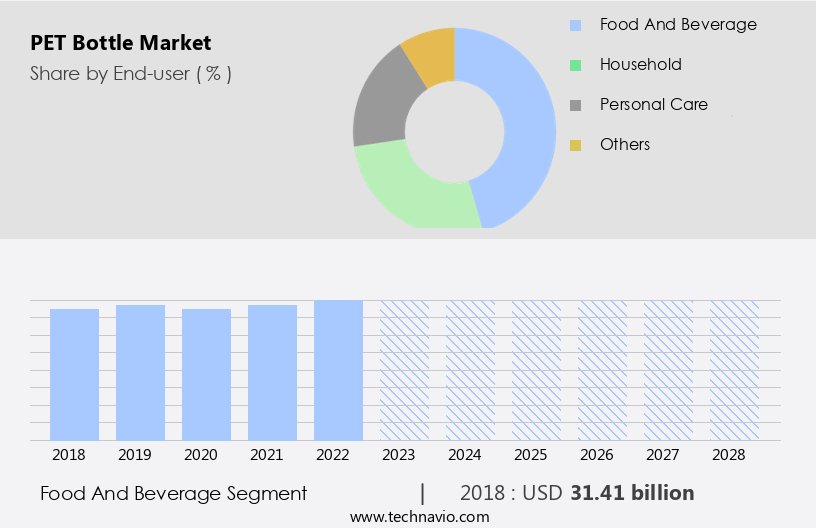
The Food and beverage segment was valued at USD 31.41 billion in 2018 and showed a gradual increase during the forecast period.

Regional Analysis

APAC is estimated to contribute 54% to the growth of the global market during the forecast period.Technavio's analysts have elaborately explained the regional trends and drivers that shape the market during the forecast period.

PET Bottle Market Share by Geography

 Request Free Sample

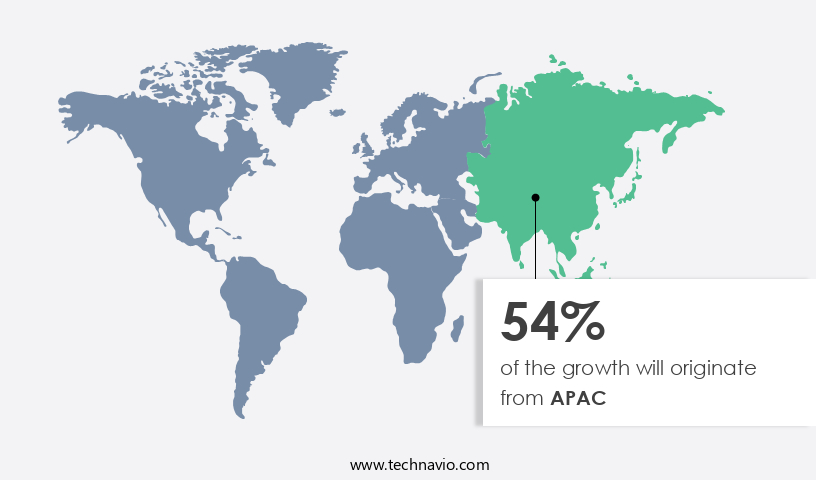
The market is witnessing significant growth, particularly in the Asia Pacific (APAC) region, which accounted for the largest market share in 2023. This trend is attributed to the increasing adoption of PET bottles in key developing countries like China, India, Indonesia, Thailand, and Singapore. The rising disposable income in these nations is fueling the demand for processed and packaged food and beverages, leading to a shift from traditional package formats to PET bottles. Additionally, the APAC market for packaged beverages is projected to reach approximately 45 billion liters by 2025. Food safety is a crucial factor driving the market, with stringent regulations, such as FDA approval, ensuring the production of food-grade PET bottles.

The circular economy is another significant trend, with the focus on recycling PET bottles to produce recycled PET content. Polyethylene terephthalate (PET) resin is the primary raw material, with recycled PET flakes and post-industrial recycled PET being key contributors. Blow molding and injection molding are common manufacturing processes, while extrusion blow molding and stretch blow molding are gaining popularity for their cost-effectiveness and versatility. Closure systems, neck finishes, and bottle designs are essential aspects of PET bottle production, with regulatory compliance and quality control being crucial considerations. The recycling infrastructure is essential for the circular economy, with sorting technologies and reprocessing plants playing a vital role in the production of recycled PET.

Lightweight packaging, shelf life, UV resistance, oxygen barrier, and moisture barrier are essential properties that influence consumer preferences. The pharmaceutical industry also utilizes PET bottles due to their chemical resistance and suitability for pharmaceutical-grade applications. Carbon footprint reduction is a critical concern, with the industry focusing on reducing waste through efficient supply chain management and distribution networks. Product differentiation, brand perception, and regulatory compliance are essential factors influencing market dynamics. Overall, the market is a dynamic and evolving industry, with ongoing innovations and trends shaping its future.

Market Dynamics

Our researchers analyzed the data with 2023 as the base year, along with the key drivers, trends, and challenges. A holistic analysis of drivers will help companies refine their marketing strategies to gain a comPETitive advantage.

What are the key market drivers leading to the rise in the adoption of PET Bottle Industry?

  • The increasing preference for PET (Polyethylene Terephthalate) as a packaging solution is the primary growth driver in the market. 
  • PET bottles have gained significant popularity in the global market for packaging various consumer goods, including beverages, food, perfumes and sprays, toiletries, pharmaceuticals, and more. In Europe, for instance, approximately half of the beer bottles were manufactured using PET in 2018. The preference for PET bottles in Romania and other European countries can be attributed to their convenience and aesthetics. PET bottles offer several advantages over traditional glass and metal containers. They are lighter in weight, leading to reduced transportation emissions and resource consumption in the supply chain.
  • This makes PET bottles an ideal packaging solution for various industries seeking to minimize their carbon footprint and optimize their logistics. The adoption of PET bottles is not limited to Europe; they are increasingly being used in other regions as well due to their numerous benefits.

What are the market trends shaping the PET Bottle Industry?

  • The increasing preference for lightweight packaging is a notable market trend. This trend is driven by several factors, including sustainability concerns, cost savings, and consumer demand for convenience.
  • The market is experiencing significant growth due to the increasing demand for lightweight packaging solutions that prioritize food safety and sustainability. PET bottles, made from polyethylene terephthalate, offer several advantages that cater to these consumer preferences and industry trends. One of the most notable benefits is their lightweight design, which not only makes them easier for consumers to handle but also reduces transportation costs for manufacturers and distributors. This cost savings becomes increasingly valuable as logistics expenses continue to rise. Additionally, the use of recycled PET content in these bottles contributes to the circular economy and aligns with the food industry's focus on reducing waste and improving sustainability.
  • Furthermore, food-grade PET bottles offer excellent shelf life, UV resistance, and FDA approval, making them a popular choice for food and beverage packaging. The adoption of PET bottles over heavier alternatives, such as glass or aluminum, is a strategic move that not only benefits the environment but also offers cost savings.

What challenges does the PET Bottle Industry face during its growth?

  • The strict government regulations and policies concerning plastic use pose a significant challenge to the industry's growth trajectory. 
  • The market is influenced by various factors, with consumer preferences and regulations playing significant roles. Consumers increasingly demand eco-friendly packaging solutions, leading to a focus on oxygen barrier properties, lightweight packaging, and closure systems that ensure product freshness. EU regulations, for instance, require strict adherence to standards for neck finishes and supply chain transparency. Manufacturers must invest in advanced packaging films and recycling infrastructure to meet these requirements. Recycling infrastructure development is crucial for the circular economy, but it comes with costs. Regulations mandating a minimum percentage of recycled content in PET bottles can lead to increased expenses for companies, potentially impacting consumer prices and profit margins.
  • These regulations, while promoting sustainability, can pose challenges for the PET bottle industry. However, they also create opportunities for innovation and growth, as companies adapt to the changing market landscape and find ways to meet consumer demands for eco-friendly packaging while complying with regulations.

Exclusive Customer Landscape

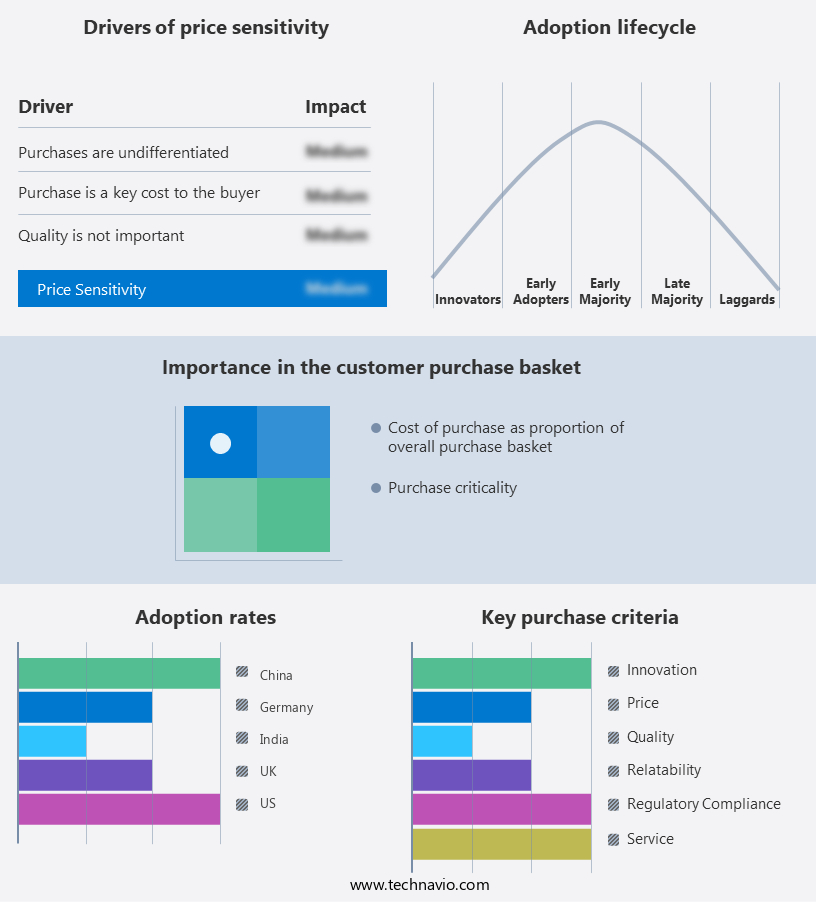
The PET bottle market forecasting report includes the adoption lifecycle of the market, covering from the innovator's stage to the laggard's stage. It focuses on adoption rates in different regions based on penetration. Furthermore, the PET bottle market report also includes key purchase criteria and drivers of price sensitivity to help companies evaluate and develop their market growth analysis strategies.

PET Bottle Market Share by Geography

 Customer Landscape

Key Companies & Market Insights

Companies are implementing various strategies, such as strategic alliances, PET bottle market forecast, partnerships, mergers and acquisitions, geographical expansion, and product/service launches, to enhance their presence in the industry.

Alpha Plastics Inc. - This company specializes in producing high-quality PET bottles for pharmaceuticals and vaccines, adhering to stringent industry standards for safety and efficacy.

The industry research and growth report includes detailed analyses of the comPETitive landscape of the market and information about key companies, including:

  • Alpha Plastics Inc.
  • Altium Packaging
  • Amcor Plc
  • BASF SE
  • BERICAP Holding GmbH
  • Berry Global Inc.
  • Captiva Co.
  • Cospack America Corp.
  • Graham Packaging Co. LP
  • GTX Hanex Plastic Sp. z o.o.
  • Indorama Ventures Public Co. Ltd.
  • Nampak Ltd.
  • NEO GROUP UAB
  • NovaPET SA
  • Ontario Plastic Container Producers Ltd.
  • Plastipak Holdings Inc.
  • Saudi Basic Industries Corp.
  • Sheth PET and Polymers Pvt Ltd.
  • Silgan Holdings Inc.

Qualitative and quantitative analysis of companies has been conducted to help clients understand the wider business environment as well as the strengths and weaknesses of key industry players. Data is qualitatively analyzed to categorize companies as pure play, category-focused, industry-focused, and diversified; it is quantitatively analyzed to categorize companies as dominant, leading, strong, tentative, and weak.

Recent Development and News in PET Bottle Market

  • In January 2024, global beverage company Coca-Cola announced the launch of its new PET bottle design, featuring 100% recycled content, in collaboration with Danone and Nestlé (Coca-Cola Company Press Release, 2024). This initiative marked a significant step towards increasing the use of recycled materials in PET bottles.
  • In March 2024, LG Chem and TotalEnergies entered into a strategic partnership to construct a new PET resin production facility in South Korea, with an annual capacity of 500,000 tons (TotalEnergies Press Release, 2024). This collaboration aimed to strengthen their positions in the global PET market and meet the growing demand for sustainable packaging solutions.
  • In May 2024, PepsiCo completed the acquisition of SodaStream, a leading manufacturer of home beverage systems, for approximately USD 3.2 billion (PepsiCo Press Release, 2024). This strategic move expanded PepsiCo's product portfolio and enabled it to offer reusable PET bottles as an alternative to disposable ones, aligning with the global trend towards reducing plastic waste.
  • In April 2025, the European Union (EU) passed a regulation mandating a 30% recycled content in all PET bottles by 2030 (European Commission Press Release, 2025). This regulatory initiative will significantly impact the market, driving demand for recycled materials and encouraging investments in recycling technologies.

Research Analyst Overview

  • The market encompasses various processes, including sheet extrusion and bottle filling equipment, to produce bottles for diverse applications. Label application methods have evolved, with advancements in 3D printing filaments and ink adhesion. Anisotropic and isotropic PET resins exhibit distinct properties, such as different heat deflection temperatures and flexural moduli, influencing bottle design and performance. Thermal degradation and PET degradation are critical concerns, necessitating research on monomer recovery and additive manufacturing techniques. Melt flow index and molecular weight are essential factors in the production of packaging films and barrier coatings, ensuring impact resistance and gas permeability.
  • Textile applications and composite materials expand the market scope, utilizing polyester fiber and terephthalic acid. Cold fill and hot fill processes cater to various industries, while capping machines streamline packaging lines. Aseptic packaging and barrier coatings enhance product preservation and shelf life. Innovations in additive manufacturing and printing techniques offer potential for enhanced bottle production and customization. The industry's focus on sustainability and reducing thermal degradation drives research on improving tensile strength and heat deflection temperature.

Dive into Technavio's robust research methodology, blending expert interviews, extensive data synthesis, and validated models for unparalleled PET Bottle Market insights. See full methodology.

Market Scope

Report Coverage

Details

Page number

164

Base year

2023

Historic period

2018-2022

Forecast period

2024-2028

Growth momentum & CAGR

Accelerate at a CAGR of 3.4%

Market growth 2024-2028

USD 9.21 billion

Market structure

Fragmented

YoY growth 2023-2024(%)

3.3

Key countries

US, China, India, Germany, and UK

ComPETitive landscape

Leading Companies, Market Positioning of Companies, ComPETitive Strategies, and Industry Risks

Request Free Sample

What are the Key Data Covered in this PET Bottle Market Research and Growth Report?

  • CAGR of the PET Bottle industry during the forecast period
  • Detailed information on factors that will drive the growth and forecasting between 2024 and 2028
  • Precise estimation of the size of the market and its contribution of the industry in focus to the parent market
  • Accurate predictions about upcoming growth and trends and changes in consumer behaviour
  • Growth of the market across APAC, Europe, North America, Middle East and Africa, and South America
  • Thorough analysis of the market's comPETitive landscape and detailed information about companies
  • Comprehensive analysis of factors that will challenge the PET bottle market growth of industry companies

We can help! Our analysts can customize this PET bottle market research report to meet your requirements.

Get in touch

1 Executive Summary

  • 1.1 Market overview
    • Executive Summary - Chart on Market Overview
    • Executive Summary - Data Table on Market Overview
    • Executive Summary - Chart on Global Market Characteristics
    • Executive Summary - Chart on Market by Geography
    • Executive Summary - Chart on Market Segmentation by End-user
    • Executive Summary - Chart on Incremental Growth
    • Executive Summary - Data Table on Incremental Growth
    • Executive Summary - Chart on Company Market Positioning

2 Technavio Analysis

  • 2.1 Analysis of price sensitivity, lifecycle, customer purchase basket, adoption rates, and purchase criteria
    • Analysis of price sensitivity, lifecycle, customer purchase basket, adoption rates, and purchase criteria
  • 2.2 Criticality of inputs and Factors of differentiation
    • Overview on criticality of inputs and factors of differentiation
  • 2.3 Factors of disruption
    • Overview on factors of disruption
  • 2.4 Impact of drivers and challenges
    • Impact of drivers and challenges in 2023 and 2028

3 Market Landscape

  • 3.1 Market ecosystem
    • Parent Market
    • Data Table on - Parent Market
  • 3.2 Market characteristics
    • Market characteristics analysis
  • 3.3 Value chain analysis
    • Value Chain Analysis

4 Market Sizing

  • 4.1 Market definition
    • Offerings of companies included in the market definition
  • 4.2 Market segment analysis
    • Market segments
  • 4.3 Market size 2023
    • 4.4 Market outlook: Forecast for 2023-2028
      • Chart on Global - Market size and forecast 2023-2028 ($ million)
      • Data Table on Global - Market size and forecast 2023-2028 ($ million)
      • Chart on Global Market: Year-over-year growth 2023-2028 (%)
      • Data Table on Global Market: Year-over-year growth 2023-2028 (%)

    5 Historic Market Size

    • 5.1 Global PET Bottle Market 2018 - 2022
      • Historic Market Size - Data Table on Global PET Bottle Market 2018 - 2022 ($ million)
    • 5.2 End-user segment analysis 2018 - 2022
      • Historic Market Size - End-user Segment 2018 - 2022 ($ million)
    • 5.3 Geography segment analysis 2018 - 2022
      • Historic Market Size - Geography Segment 2018 - 2022 ($ million)
    • 5.4 Country segment analysis 2018 - 2022
      • Historic Market Size - Country Segment 2018 - 2022 ($ million)

    6 Five Forces Analysis

    • 6.1 Five forces summary
      • Five forces analysis - Comparison between 2023 and 2028
    • 6.2 Bargaining power of buyers
      • Bargaining power of buyers - Impact of key factors 2023 and 2028
    • 6.3 Bargaining power of suppliers
      • Bargaining power of suppliers - Impact of key factors in 2023 and 2028
    • 6.4 Threat of new entrants
      • Threat of new entrants - Impact of key factors in 2023 and 2028
    • 6.5 Threat of substitutes
      • Threat of substitutes - Impact of key factors in 2023 and 2028
    • 6.6 Threat of rivalry
      • Threat of rivalry - Impact of key factors in 2023 and 2028
    • 6.7 Market condition
      • Chart on Market condition - Five forces 2023 and 2028

    7 Market Segmentation by End-user

    • 7.1 Market segments
      • Chart on End-user - Market share 2023-2028 (%)
      • Data Table on End-user - Market share 2023-2028 (%)
    • 7.2 Comparison by End-user
      • Chart on Comparison by End-user
      • Data Table on Comparison by End-user
    • 7.3 Food and beverage - Market size and forecast 2023-2028
      • Chart on Food and beverage - Market size and forecast 2023-2028 ($ million)
      • Data Table on Food and beverage - Market size and forecast 2023-2028 ($ million)
      • Chart on Food and beverage - Year-over-year growth 2023-2028 (%)
      • Data Table on Food and beverage - Year-over-year growth 2023-2028 (%)
    • 7.4 Household - Market size and forecast 2023-2028
      • Chart on Household - Market size and forecast 2023-2028 ($ million)
      • Data Table on Household - Market size and forecast 2023-2028 ($ million)
      • Chart on Household - Year-over-year growth 2023-2028 (%)
      • Data Table on Household - Year-over-year growth 2023-2028 (%)
    • 7.5 Personal care - Market size and forecast 2023-2028
      • Chart on Personal care - Market size and forecast 2023-2028 ($ million)
      • Data Table on Personal care - Market size and forecast 2023-2028 ($ million)
      • Chart on Personal care - Year-over-year growth 2023-2028 (%)
      • Data Table on Personal care - Year-over-year growth 2023-2028 (%)
    • 7.6 Others - Market size and forecast 2023-2028
      • Chart on Others - Market size and forecast 2023-2028 ($ million)
      • Data Table on Others - Market size and forecast 2023-2028 ($ million)
      • Chart on Others - Year-over-year growth 2023-2028 (%)
      • Data Table on Others - Year-over-year growth 2023-2028 (%)
    • 7.7 Market opportunity by End-user
      • Market opportunity by End-user ($ million)
      • Data Table on Market opportunity by End-user ($ million)

    8 Customer Landscape

    • 8.1 Customer landscape overview
      • Analysis of price sensitivity, lifecycle, customer purchase basket, adoption rates, and purchase criteria

    9 Geographic Landscape

    • 9.1 Geographic segmentation
      • Chart on Market share by geography 2023-2028 (%)
      • Data Table on Market share by geography 2023-2028 (%)
    • 9.2 Geographic comparison
      • Chart on Geographic comparison
      • Data Table on Geographic comparison
    • 9.3 APAC - Market size and forecast 2023-2028
      • Chart on APAC - Market size and forecast 2023-2028 ($ million)
      • Data Table on APAC - Market size and forecast 2023-2028 ($ million)
      • Chart on APAC - Year-over-year growth 2023-2028 (%)
      • Data Table on APAC - Year-over-year growth 2023-2028 (%)
    • 9.4 Europe - Market size and forecast 2023-2028
      • Chart on Europe - Market size and forecast 2023-2028 ($ million)
      • Data Table on Europe - Market size and forecast 2023-2028 ($ million)
      • Chart on Europe - Year-over-year growth 2023-2028 (%)
      • Data Table on Europe - Year-over-year growth 2023-2028 (%)
    • 9.5 North America - Market size and forecast 2023-2028
      • Chart on North America - Market size and forecast 2023-2028 ($ million)
      • Data Table on North America - Market size and forecast 2023-2028 ($ million)
      • Chart on North America - Year-over-year growth 2023-2028 (%)
      • Data Table on North America - Year-over-year growth 2023-2028 (%)
    • 9.6 Middle East and Africa - Market size and forecast 2023-2028
      • Chart on Middle East and Africa - Market size and forecast 2023-2028 ($ million)
      • Data Table on Middle East and Africa - Market size and forecast 2023-2028 ($ million)
      • Chart on Middle East and Africa - Year-over-year growth 2023-2028 (%)
      • Data Table on Middle East and Africa - Year-over-year growth 2023-2028 (%)
    • 9.7 South America - Market size and forecast 2023-2028
      • Chart on South America - Market size and forecast 2023-2028 ($ million)
      • Data Table on South America - Market size and forecast 2023-2028 ($ million)
      • Chart on South America - Year-over-year growth 2023-2028 (%)
      • Data Table on South America - Year-over-year growth 2023-2028 (%)
    • 9.8 US - Market size and forecast 2023-2028
      • Chart on US - Market size and forecast 2023-2028 ($ million)
      • Data Table on US - Market size and forecast 2023-2028 ($ million)
      • Chart on US - Year-over-year growth 2023-2028 (%)
      • Data Table on US - Year-over-year growth 2023-2028 (%)
    • 9.9 China - Market size and forecast 2023-2028
      • Chart on China - Market size and forecast 2023-2028 ($ million)
      • Data Table on China - Market size and forecast 2023-2028 ($ million)
      • Chart on China - Year-over-year growth 2023-2028 (%)
      • Data Table on China - Year-over-year growth 2023-2028 (%)
    • 9.10 India - Market size and forecast 2023-2028
      • Chart on India - Market size and forecast 2023-2028 ($ million)
      • Data Table on India - Market size and forecast 2023-2028 ($ million)
      • Chart on India - Year-over-year growth 2023-2028 (%)
      • Data Table on India - Year-over-year growth 2023-2028 (%)
    • 9.11 Germany - Market size and forecast 2023-2028
      • Chart on Germany - Market size and forecast 2023-2028 ($ million)
      • Data Table on Germany - Market size and forecast 2023-2028 ($ million)
      • Chart on Germany - Year-over-year growth 2023-2028 (%)
      • Data Table on Germany - Year-over-year growth 2023-2028 (%)
    • 9.12 Japan - Market size and forecast 2023-2028
      • Chart on Japan - Market size and forecast 2023-2028 ($ million)
      • Data Table on Japan - Market size and forecast 2023-2028 ($ million)
      • Chart on Japan - Year-over-year growth 2023-2028 (%)
      • Data Table on Japan - Year-over-year growth 2023-2028 (%)
    • 9.13 UK - Market size and forecast 2023-2028
      • Chart on UK - Market size and forecast 2023-2028 ($ million)
      • Data Table on UK - Market size and forecast 2023-2028 ($ million)
      • Chart on UK - Year-over-year growth 2023-2028 (%)
      • Data Table on UK - Year-over-year growth 2023-2028 (%)
    • 9.14 Canada - Market size and forecast 2023-2028
      • Chart on Canada - Market size and forecast 2023-2028 ($ million)
      • Data Table on Canada - Market size and forecast 2023-2028 ($ million)
      • Chart on Canada - Year-over-year growth 2023-2028 (%)
      • Data Table on Canada - Year-over-year growth 2023-2028 (%)
    • 9.15 South Korea - Market size and forecast 2023-2028
      • Chart on South Korea - Market size and forecast 2023-2028 ($ million)
      • Data Table on South Korea - Market size and forecast 2023-2028 ($ million)
      • Chart on South Korea - Year-over-year growth 2023-2028 (%)
      • Data Table on South Korea - Year-over-year growth 2023-2028 (%)
    • 9.16 France - Market size and forecast 2023-2028
      • Chart on France - Market size and forecast 2023-2028 ($ million)
      • Data Table on France - Market size and forecast 2023-2028 ($ million)
      • Chart on France - Year-over-year growth 2023-2028 (%)
      • Data Table on France - Year-over-year growth 2023-2028 (%)
    • 9.17 Italy - Market size and forecast 2023-2028
      • Chart on Italy - Market size and forecast 2023-2028 ($ million)
      • Data Table on Italy - Market size and forecast 2023-2028 ($ million)
      • Chart on Italy - Year-over-year growth 2023-2028 (%)
      • Data Table on Italy - Year-over-year growth 2023-2028 (%)
    • 9.18 Market opportunity by geography
      • Market opportunity by geography ($ million)
      • Data Tables on Market opportunity by geography ($ million)

    10 Drivers, Challenges, and Opportunity/Restraints

    • 10.1 Market drivers
      • 10.2 Market challenges
        • 10.3 Impact of drivers and challenges
          • Impact of drivers and challenges in 2023 and 2028
        • 10.4 Market opportunities/restraints

          11 Competitive Landscape

          • 11.1 Overview
            • 11.2 Competitive Landscape
              • Overview on criticality of inputs and factors of differentiation
            • 11.3 Landscape disruption
              • Overview on factors of disruption
            • 11.4 Industry risks
              • Impact of key risks on business

            12 Competitive Analysis

            • 12.1 Companies profiled
              • Companies covered
            • 12.2 Company ranking index
              • Company ranking index
            • 12.3 Market positioning of companies
              • Matrix on companies position and classification
            • 12.4 Alpha Plastics Inc.
              • Alpha Plastics Inc. - Overview
              • Alpha Plastics Inc. - Product / Service
              • Alpha Plastics Inc. - Key offerings
              • SWOT
            • 12.5 Amcor Plc
              • Amcor Plc - Overview
              • Amcor Plc - Business segments
              • Amcor Plc - Key news
              • Amcor Plc - Key offerings
              • Amcor Plc - Segment focus
              • SWOT
            • 12.6 BASF SE
              • BASF SE - Overview
              • BASF SE - Business segments
              • BASF SE - Key news
              • BASF SE - Key offerings
              • BASF SE - Segment focus
              • SWOT
            • 12.7 BERICAP Holding GmbH
              • BERICAP Holding GmbH - Overview
              • BERICAP Holding GmbH - Product / Service
              • BERICAP Holding GmbH - Key offerings
              • SWOT
            • 12.8 Berry Global Inc.
              • Berry Global Inc. - Overview
              • Berry Global Inc. - Business segments
              • Berry Global Inc. - Key news
              • Berry Global Inc. - Key offerings
              • Berry Global Inc. - Segment focus
              • SWOT
            • 12.9 Captiva Co.
              • Captiva Co. - Overview
              • Captiva Co. - Product / Service
              • Captiva Co. - Key offerings
              • SWOT
            • 12.10 Cospack America Corp.
              • Cospack America Corp. - Overview
              • Cospack America Corp. - Product / Service
              • Cospack America Corp. - Key offerings
              • SWOT
            • 12.11 Graham Packaging Co. LP
              • Graham Packaging Co. LP - Overview
              • Graham Packaging Co. LP - Product / Service
              • Graham Packaging Co. LP - Key offerings
              • SWOT
            • 12.12 Ontario Plastic Container Producers Ltd.
              • Ontario Plastic Container Producers Ltd. - Overview
              • Ontario Plastic Container Producers Ltd. - Product / Service
              • Ontario Plastic Container Producers Ltd. - Key offerings
              • SWOT
            • 12.13 Plastipak Holdings Inc.
              • Plastipak Holdings Inc. - Overview
              • Plastipak Holdings Inc. - Product / Service
              • Plastipak Holdings Inc. - Key offerings
              • SWOT

            13 Appendix

            • 13.1 Scope of the report
              • 13.2 Inclusions and exclusions checklist
                • Inclusions checklist
                • Exclusions checklist
              • 13.3 Currency conversion rates for US$
                • Currency conversion rates for US$
              • 13.4 Research methodology
                • Research methodology
              • 13.5 Data procurement
                • Information sources
              • 13.6 Data validation
                • Data validation
              • 13.7 Validation techniques employed for market sizing
                • Validation techniques employed for market sizing
              • 13.8 Data synthesis
                • Data synthesis
              • 13.9 360 degree market analysis
                • 360 degree market analysis
              • 13.10 List of abbreviations
                • List of abbreviations
                • o Strong financial performance

              Research Methodology

              Technavio presents a detailed picture of the market by way of study, synthesis, and summation of data from multiple sources. The analysts have presented the various facets of the market with a particular focus on identifying the key industry influencers. The data thus presented is comprehensive, reliable, and the result of extensive research, both primary and secondary.

              INFORMATION SOURCES

              Primary sources

              • Manufacturers and suppliers
              • Channel partners
              • Industry experts
              • Strategic decision makers

              Secondary sources

              • Industry journals and periodicals
              • Government data
              • Financial reports of key industry players
              • Historical data
              • Press releases

              DATA ANALYSIS

              Data Synthesis

              • Collation of data
              • Estimation of key figures
              • Analysis of derived insights

              Data Validation

              • Triangulation with data models
              • Reference against proprietary databases
              • Corroboration with industry experts

              REPORT WRITING

              Qualitative

              • Market drivers
              • Market challenges
              • Market trends
              • Five forces analysis

              Quantitative

              • Market size and forecast
              • Market segmentation
              • Geographical insights
              • Competitive landscape

              Interested in this report?

              Get your sample now to see our research methodology and insights!

              Download Now

              Frequently Asked Questions

              PET Bottle market growth will increase by $ 9.21 bn during 2024-2028 .

              The PET Bottle market is expected to grow at a CAGR of 3.4% during 2024-2028 .

              PET Bottle market is segmented by End-user( Food and beverage, Household, Personal care, Others)

              Alpha Plastics Inc., Altium Packaging, Amcor Plc, BASF SE, BERICAP Holding GmbH, Berry Global Inc., Captiva Co., Cospack America Corp., Graham Packaging Co. LP, GTX Hanex Plastic Sp. z o.o., Indorama Ventures Public Co. Ltd., Nampak Ltd., NEO GROUP UAB, Novapet SA, Ontario Plastic Container Producers Ltd., Plastipak Holdings Inc., Saudi Basic Industries Corp., Sheth PET and Polymers Pvt Ltd., Silgan Holdings Inc. are a few of the key vendors in the PET Bottle market.

              APAC will register the highest growth rate of 54% among the other regions. Therefore, the PET Bottle market in APAC is expected to garner significant business opportunities for the vendors during the forecast period.

              US, China, India, Germany, UK

              • Rising adoption of PET as packaging solutionThe PET packaging solution is globally implemented successfully for encasing products such as beverages is the driving factor this market.
              • food is the driving factor this market.
              • perfumes and sprays is the driving factor this market.
              • toiletries is the driving factor this market.
              • food is the driving factor this market.
              • and pharmaceuticals. For instance is the driving factor this market.
              • in 2018 is the driving factor this market.
              • in Romania (Europe) is the driving factor this market.
              • about 50% of the beer bottles were made from PET. This is because beer consumers in the country found PET bottles to be convenient and aesthetically appealing. Similarly is the driving factor this market.
              • the use of PET bottles for beer is gaining popularity in the eastern and central parts of Europe. PET bottles have the primary advantage of weighing less than glass and metal ones. These PET bottles are the preferred packaging option across various end-user industries for reduced transportation emissions and resources in the supply chain. As a result is the driving factor this market.
              • the global demand for PET bottles is rising and will register a CAGR of about 4.07% during the forecast period. This will facilitate the growth of the global PET bottle market during the forecast period. The growing use of PET bottles in the packaging of products such as laundry and floor cleaners is the driving factor this market.
              • perfumes is the driving factor this market.
              • pediatrics and geriatric medicines is the driving factor this market.
              • oral liquids is the driving factor this market.
              • and tablets in the pharmaceutical industry will drive the growth of the global PET bottle market during the forecast period. Also is the driving factor this market.
              • the growing use of PET bottles in different end-user industries will strengthen the global PET bottle market during the forecast period. is the driving factor this market.

              The PET Bottle market vendors should focus on grabbing business opportunities from the Food and beverage segment as it accounted for the largest market share in the base year.