
Pharmaceutical Contract Manufacturing Market Size 2026-2030
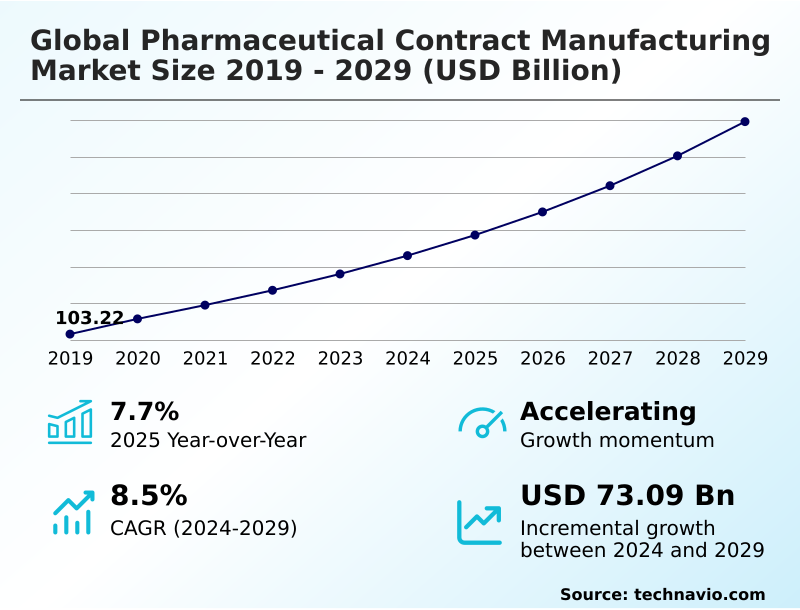
The Pharmaceutical Contract Manufacturing Market size was valued at USD 157.23 billion in 2025, growing at a CAGR of 8.2% during the forecast period 2026-2030.
Major Market Trends & Insights
- Asia dominated the market and accounted for a 36.6% growth during the forecast period.
- By End-user - Big pharmaceutical companies segment was valued at USD 85.61 billion in 2024
- By Service - API and bulk drug manufacturing segment accounted for the largest market revenue share in 2024
Market Size & Forecast
- Historic Market Opportunities 2020-2024: USD 122.11 billion
- Market Future Opportunities 2025-2030: USD 76.40 billion
- CAGR from 2025 to 2030 : 8.2%
Market Summary
- The pharmaceutical contract manufacturing market is characterized by deep specialization, with over 60% of emerging biopharma firms relying entirely on external partners for development and manufacturing. The drive for operational efficiency is paramount; a 10% reduction in production cycle times through effective technology transfer can substantially accelerate market entry for a new therapeutic.
- A primary driver is the escalating R&D complexity, especially for biologics like monoclonal antibodies, which requires specialized bioprocessing capabilities that are often too costly for companies to build in-house.
- For instance, a small biotech firm will outsource sterile fill-finish operations to a specialized contract development and manufacturing organization to de-risk its supply chain and avoid the multimillion-dollar capital outlay for an aseptic facility.
- However, the industry faces the challenge of heightened regulatory scrutiny, where navigating divergent international GMP compliance standards adds significant cost and complexity, potentially delaying drug product batch release and market launch.
What will be the Size of the Pharmaceutical Contract Manufacturing Market during the forecast period?
Get Key Insights on Market Forecast (PDF) Request Free Sample
How is the Pharmaceutical Contract Manufacturing Market Segmented?
The pharmaceutical contract manufacturing industry research report provides comprehensive data (region-wise segment analysis), with forecasts and analysis for the period 2026-2030, as well as historical data from 2020-2024 for the following segments.
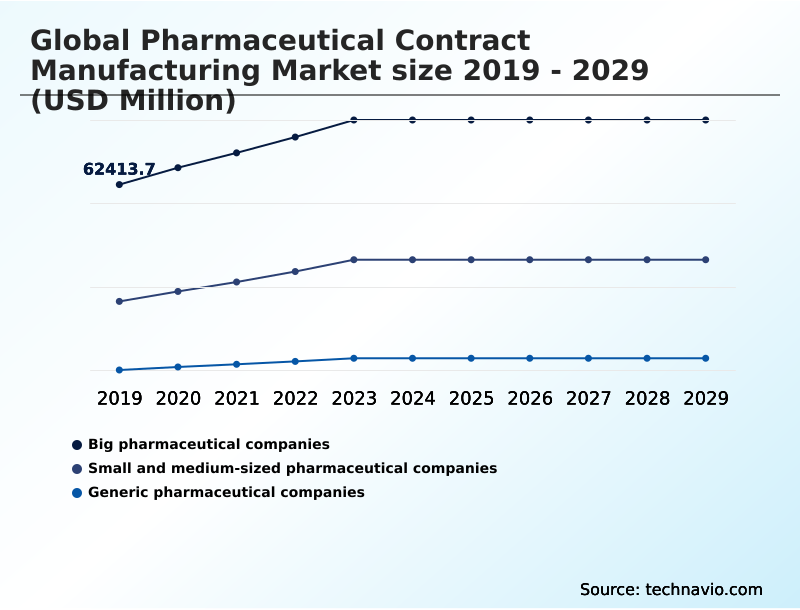
- End-user
- Big pharmaceutical companies
- Small and medium-sized pharmaceutical companies
- Generic pharmaceutical companies
- Service
- API and bulk drug manufacturing
- Final dosage form
- Secondary packaging
- Application
- Infectious diseases
- Cardiovascular diseases
- Oncology
- Geography
- North America
- US
- Canada
- Mexico
- Asia
- Europe
- Germany
- UK
- France
- Rest of World (ROW)
- North America
How is the Pharmaceutical Contract Manufacturing Market Segmented by End-user?
The big pharmaceutical companies segment is estimated to witness significant growth during the forecast period.
Big pharmaceutical companies represent over 58% of the outsourcing expenditure in the pharmaceutical contract manufacturing market, prioritizing strategic partnerships with a contract development and manufacturing organization to manage complex global supply chains.
These enterprises leverage outsourcing for commercial scale-up and to mitigate risks tied to large-volume production, focusing less on short-term cost savings and more on long-term reliability and GMP compliance.
Engagements often involve multi-year master service agreements where a 5% improvement in production yield directly impacts revenue.
Unlike smaller firms, their selection criteria emphasize a partner's global footprint, regulatory history, and technological capabilities in areas like continuous manufacturing implementation, ensuring consistent pharmaceutical supply chain logistics and product quality across diverse international markets.
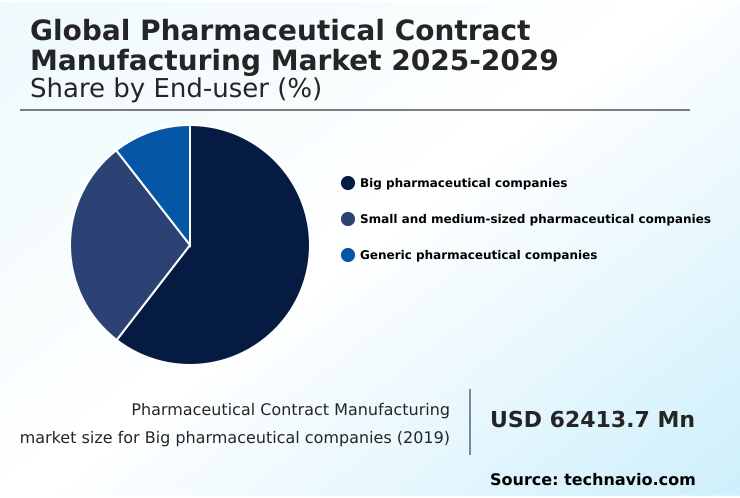
The Big pharmaceutical companies segment was valued at USD 85.61 billion in 2024 and showed a gradual increase during the forecast period.
How demand for the Pharmaceutical Contract Manufacturing market is rising in the leading region?
Asia is estimated to contribute 36.6% to the growth of the global market during the forecast period.Technavio’s analysts have elaborately explained the regional trends and drivers that shape the market during the forecast period.
See How Pharmaceutical Contract Manufacturing Market demand is rising in Asia Request Free Sample
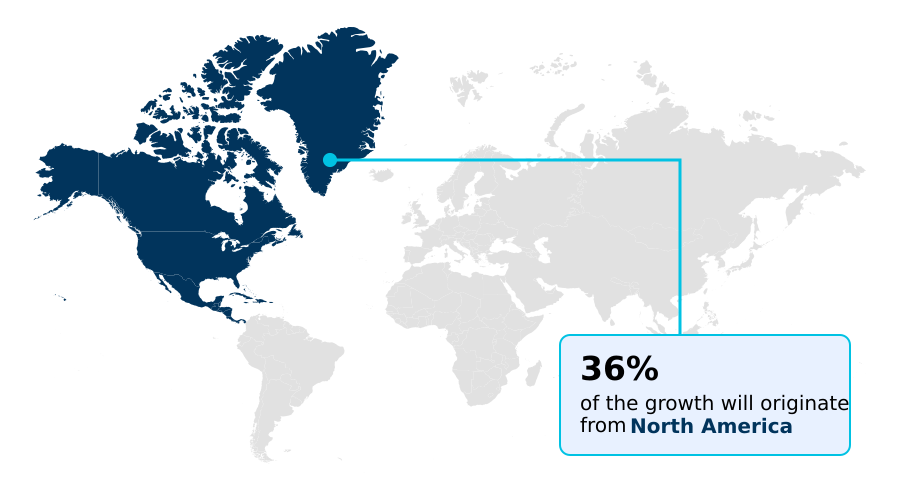
The geographic landscape of pharmaceutical contract manufacturing is distinctly divided, with North America leading in market value at nearly 35% share due to its focus on high-value biopharmaceutical processing and complex sterile injectables.
In contrast, Asia is the fastest-growing region, outpacing North America by approximately 1.5 percentage points annually, driven by cost-effective active pharmaceutical ingredient synthesis in India and China.
Within North America, the US commands over 75% of the market, serving as a hub for innovation and advanced regulatory affairs support.
This regional divergence requires tailored business strategies; companies partnering in Asia often focus on cost optimization and process scale-up strategy, while partnerships in North America prioritize advanced technology access and robust cold chain management to ensure quality.
This dynamic reflects a global push for operational excellence in pharma, balanced between cost containment and specialized capabilities.
What are the key Drivers, Trends, and Challenges in the Pharmaceutical Contract Manufacturing Market?
Our researchers analyzed the data with 2025 as the base year, along with the key drivers, trends, and challenges. A holistic analysis of drivers will help companies refine their marketing strategies to gain a competitive advantage.
- Over 70% of new biologic drugs in development pipelines utilize outsourced manufacturing, underscoring the critical role of specialized partners. The evaluation of the total cost of pharmaceutical contract manufacturing has evolved, shifting from simple price-per-batch comparisons to a more holistic assessment of a partner's ability to mitigate risks and accelerate timelines.
- For instance, selecting an experienced partner for sterile injectable contract manufacturing services can reduce the risk of batch failure by up to 15%, a crucial factor when dealing with high-value drug products. This highlights why robust CDMO selection criteria for pharma now weigh regulatory track record and technical expertise as heavily as pricing.
- While small molecule API contract manufacturing remains a significant market segment driven by cost competition, the technical demands of pharmaceutical contract manufacturing for biologics are reshaping partnerships. The complexity of handling monoclonal antibodies or cell therapies requires advanced aseptic processing and quality control, making a provider's scientific expertise and infrastructure non-negotiable.
- Consequently, sponsors are adopting more strategic, long-term relationships, integrating their partners into the development lifecycle to ensure a seamless transition from clinical trials to commercial launch, a stark contrast to the more transactional relationships common a decade ago.
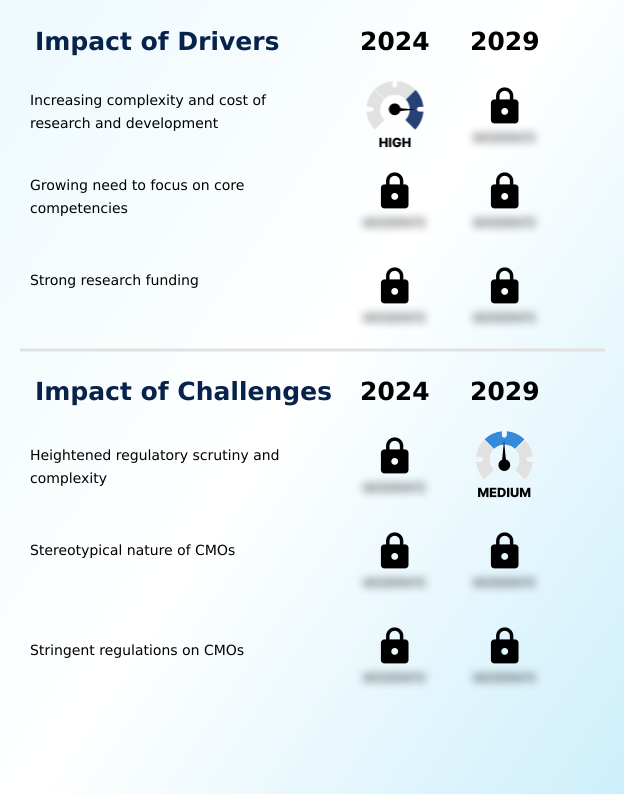
What are the key market drivers leading to the rise in the adoption of Pharmaceutical Contract Manufacturing Industry?
- The primary driver is the increasing complexity and cost associated with pharmaceutical research and development, which compels companies to outsource manufacturing.
- A key driver is the growing complexity of drug pipelines, with biologics now comprising over 40% of all assets in development, up from 25% a decade prior.
- This surge in complex modalities, including cell and gene therapy manufacturing, requires specialized expertise and facilities that increase capital costs by over 50% compared to small-molecule plants.
- As a result, many pharmaceutical companies, particularly those without established infrastructure, outsource biologics drug substance manufacturing to access necessary technologies and de-risk their investments. This allows them to focus on core R&D activities and clinical trial material supply.
- This outsourcing strategy is critical during pre-formulation studies and for developing an effective process scale-up strategy, converting high upfront capital expenditures into more manageable operational costs.
What are the market trends shaping the Pharmaceutical Contract Manufacturing Industry?
- A definitive trend is the strategic shift toward onshoring and enhancing supply chain resilience, particularly within North America and Europe, to mitigate geopolitical risks.
- A primary trend reshaping the market is the strategic regionalization of supply chains to enhance security and reduce geopolitical risk, which has increased capital investment in North American and European facilities by over 30%. This shift, driven by recent global disruptions, prioritizes supply chain risk management over pure cost savings.
- As a result, companies are actively engaged in manufacturing capacity planning to build resilient, dual-sourcing networks, often reducing cross-continental logistics lead times by up to 25%. This trend directly impacts drug product lifecycle management, as sponsors now favor regional partners who can ensure manufacturing continuity and withstand a stringent regulatory compliance audit.
- For sterile products, this also means local partners must demonstrate impeccable aseptic technique validation to win high-value contracts.
What challenges does the Pharmaceutical Contract Manufacturing Industry face during its growth?
- A key challenge affecting industry growth is the heightened regulatory scrutiny and increasing compliance complexity across global jurisdictions.
- A significant challenge is heightened regulatory scrutiny, with inspections increasing by nearly 20% and data integrity failures causing over 50% of all GMP compliance-related citations. This intensified oversight from agencies like the FDA and EMA forces contract manufacturers to make substantial investments in advanced quality systems and personnel training to avoid costly production delays.
- Navigating divergent international standards requires deep expertise in regulatory affairs support and meticulous quality control testing. This complexity raises operational costs and barriers to entry, particularly for smaller players. For manufacturers of sterile and high-potency products, the pressure is even greater, demanding flawless cross-contamination control protocols and state-of-the-art cleanroom facility design to meet evolving expectations.
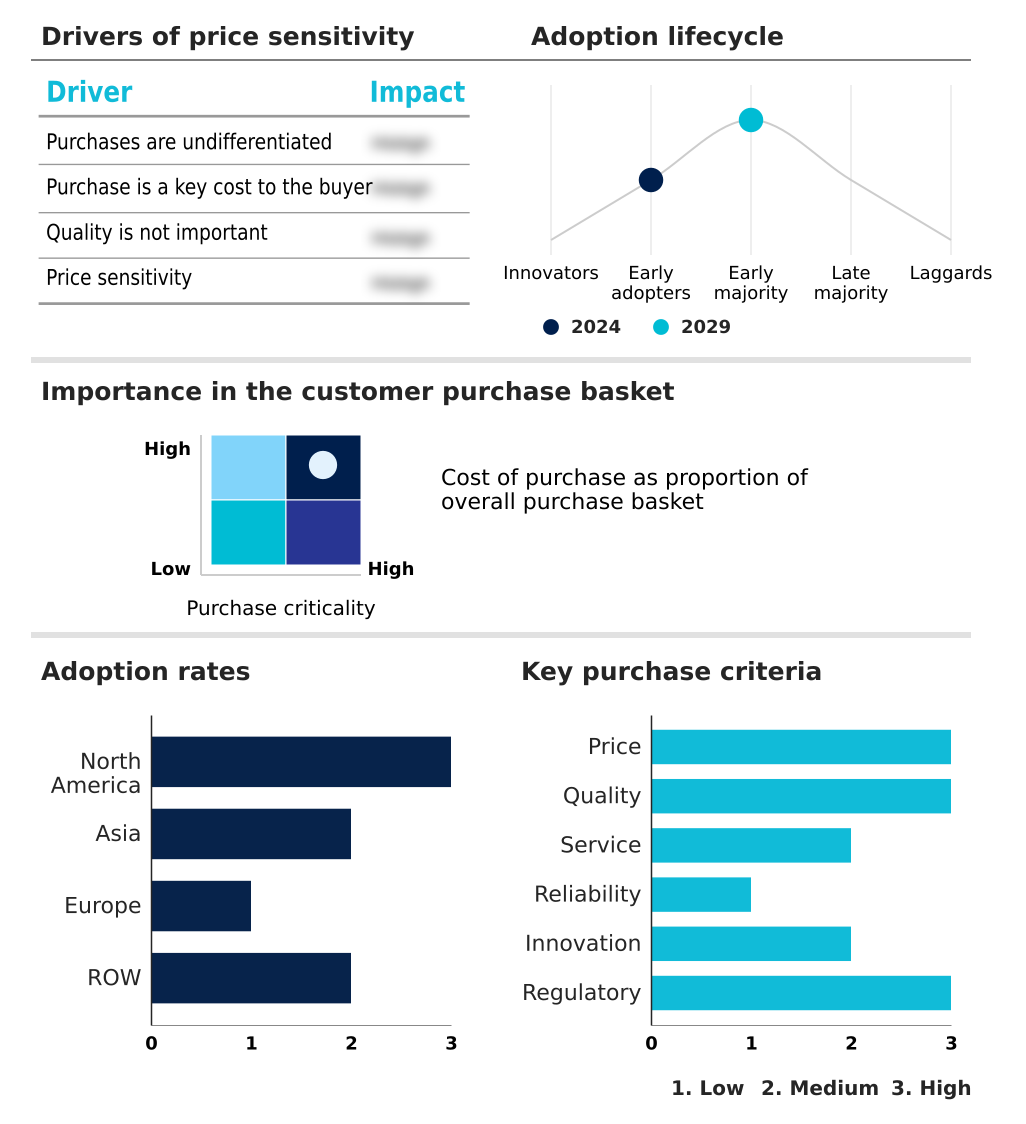
Exclusive Technavio Analysis on Customer Landscape
The pharmaceutical contract manufacturing market forecasting report includes the adoption lifecycle of the market, covering from the innovator’s stage to the laggard’s stage. It focuses on adoption rates in different regions based on penetration. Furthermore, the pharmaceutical contract manufacturing market report also includes key purchase criteria and drivers of price sensitivity to help companies evaluate and develop their market growth analysis strategies.
Customer Landscape of Pharmaceutical Contract Manufacturing Industry
Competitive Landscape
Companies are implementing various strategies, such as strategic alliances, pharmaceutical contract manufacturing market forecast, partnerships, mergers and acquisitions, geographical expansion, and product/service launches, to enhance their presence in the industry.
AbbVie Inc. - Providers deliver integrated services from active pharmaceutical ingredient synthesis and biologics drug substance manufacturing to final dosage form production, supporting the entire drug product lifecycle.
The industry research and growth report includes detailed analyses of the competitive landscape of the market and information about key companies, including:
- AbbVie Inc.
- Aenova Holding GmbH
- Ajinomoto Co. Inc.
- Almac Group Ltd.
- Boehringer Ingelheim GmbH
- Cadila Pharmaceuticals Ltd.
- Cambrex Corp.
- Catalent Inc.
- Charles River Laboratories
- Cmic Holdings Co. Ltd.
- Corden Pharma Intl. GmbH
- Dr. Reddys Laboratories Ltd.
- Evonik Industries AG
- Lonza Group Ltd.
- PCI Pharma Services
- Recipharm AB
- Samsung Biologics Co. Ltd.
- Siegfried Holding AG
- Thermo Fisher Scientific Inc.
- WuXi Biologics Cayman Inc.
Qualitative and quantitative analysis of companies has been conducted to help clients understand the wider business environment as well as the strengths and weaknesses of key industry players. Data is qualitatively analyzed to categorize companies as pure play, category-focused, industry-focused, and diversified; it is quantitatively analyzed to categorize companies as dominant, leading, strong, tentative, and weak.
Market Intelligence Radar: High-Impact Developments & Growth Signals
- In the Health Care Equipment industry, the adoption of digital manufacturing platforms and IoT-enabled devices has set new standards for process control and data integrity, directly compelling the pharmaceutical contract manufacturing market to invest in similar process analytical technology and quality management system frameworks to ensure GMP compliance and operational excellence in pharma.
- Stringent unique device identification (UDI) and serialization and track-and-trace regulations for medical devices are creating a precedent for end-to-end traceability, increasing pressure on contract manufacturers to implement robust systems for drug product batch release and pharmaceutical supply chain logistics.
- Heightened focus on supply chain risk management, driven by geopolitical shifts, has accelerated nearshoring and regionalization strategies for critical medical components, influencing CDMO selection criteria toward partners who demonstrate supply chain resilience and localized sourcing capabilities.
- Increased regulatory and investor pressure for sustainable operations has led to the integration of energy-efficient designs and waste-reduction protocols in medical device production, a trend now shaping master service agreement negotiation in pharmaceutical contract manufacturing to include sustainability metrics and circular economy principles.
Dive into Technavio’s robust research methodology, blending expert interviews, extensive data synthesis, and validated models for unparalleled Pharmaceutical Contract Manufacturing Market insights. See full methodology.
| Market Scope | |
|---|---|
| Page number | 296 |
| Base year | 2025 |
| Historic period | 2020-2024 |
| Forecast period | 2026-2030 |
| Growth momentum & CAGR | Accelerate at a CAGR of 8.2% |
| Market growth 2026-2030 | USD 76396.2 million |
| Market structure | Fragmented |
| YoY growth 2025-2026(%) | 7.9% |
| Key countries | US, Canada, Mexico, China, India, Japan, South Korea, Singapore, Indonesia, Thailand, Germany, UK, France, The Netherlands, Italy, Spain, Switzerland, Brazil, Australia, Saudi Arabia, UAE, South Africa and Turkey |
| Competitive landscape | Leading Companies, Market Positioning of Companies, Competitive Strategies, and Industry Risks |
Research Analyst Overview
- The market ecosystem is an integrated network where contract manufacturers produce over 40% of all final dosage form pharmaceuticals, relying on a global base of raw material suppliers for excipients and APIs. Regulatory bodies like the FDA and EMA heavily influence operations; adherence to GMP standards is mandatory, and a single deviation can halt production for up to 6 months.
- CDMOs provide end-to-end CDMO services, from process development incorporating quality by design principles to commercial-scale parenteral drug manufacturing. Logistics partners specializing in cold chain management are essential for distributing temperature-sensitive biologics. The end-users—pharmaceutical and biotech companies—drive demand based on their R&D pipelines.
- This intricate value chain is focused on ensuring product integrity, as evidenced by the critical importance of processes like container closure integrity testing for sterile products.
What are the Key Data Covered in this Pharmaceutical Contract Manufacturing Market Research and Growth Report?
-
What is the expected growth of the Pharmaceutical Contract Manufacturing Market between 2026 and 2030?
-
The Pharmaceutical Contract Manufacturing Market is expected to grow by USD 76.40 billion during 2026-2030, registering a CAGR of 8.2%. Year-over-year growth in 2026 is estimated at 7.9%%. This acceleration is shaped by increasing complexity and cost of research and development, which is intensifying demand across multiple end-use verticals covered in the report.
-
-
What segmentation does the market report cover?
-
The report is segmented by End-user (Big pharmaceutical companies, Small and medium-sized pharmaceutical companies, and Generic pharmaceutical companies), Service (API and bulk drug manufacturing, Final dosage form, and Secondary packaging), Application (Infectious diseases, Cardiovascular diseases, and Oncology) and Geography (North America, Asia, Europe, Rest of World (ROW)). Among these, the Big pharmaceutical companies segment is estimated to witness significant growth during the forecast period, driven by rising adoption across key application areas. Each segment includes detailed qualitative and quantitative analysis, along with historical data from 2020-2024 and forecasts through 2030 with year-over-year growth rates.
-
-
Which regions are analyzed in the report?
-
The report covers North America, Asia, Europe and Rest of World (ROW). Asia is estimated to contribute 36.6% to market growth during the forecast period. Country-level analysis includes US, Canada, Mexico, China, India, Japan, South Korea, Singapore, Indonesia, Thailand, Germany, UK, France, The Netherlands, Italy, Spain, Switzerland, Brazil, Australia, Saudi Arabia, UAE, South Africa and Turkey, with dedicated market size tables and year-over-year growth for each.
-
-
What are the key growth drivers and market challenges?
-
The primary driver is increasing complexity and cost of research and development, which is accelerating investment and industry demand. The main challenge is heightened regulatory scrutiny and complexity, creating operational barriers for key market participants. The report quantifies the impact of each driver and challenge across 2026 and 2030 with comparative analysis.
-
-
Who are the major players in the Pharmaceutical Contract Manufacturing Market?
-
Key vendors include AbbVie Inc., Aenova Holding GmbH, Ajinomoto Co. Inc., Almac Group Ltd., Boehringer Ingelheim GmbH, Cadila Pharmaceuticals Ltd., Cambrex Corp., Catalent Inc., Charles River Laboratories, Cmic Holdings Co. Ltd., Corden Pharma Intl. GmbH, Dr. Reddys Laboratories Ltd., Evonik Industries AG, Lonza Group Ltd., PCI Pharma Services, Recipharm AB, Samsung Biologics Co. Ltd., Siegfried Holding AG, Thermo Fisher Scientific Inc. and WuXi Biologics Cayman Inc.. The report provides qualitative and quantitative analysis categorizing companies as dominant, leading, strong, tentative, and weak based on their market positioning. Company profiles include business segment analysis, SWOT assessment, key offerings, and recent strategic developments.
-
Market Research Insights
- The competitive landscape is shaped by ongoing consolidation, with the top ten contract development and manufacturing organizations now accounting for over 35% of the market through strategic capacity acquisitions.
- Key players like Catalent and Lonza are aggressively expanding their capabilities in advanced modalities; for example, recent investments have expanded gene therapy manufacturing capacity by more than 40% to address a critical industry bottleneck. These expansions are a direct response to the robust pipeline of biologics and cell and gene therapies from both large pharma and emerging biotech companies.
- Such strategic moves enable end-to-end CDMO services, from early-phase development to commercial supply. However, the industry still grapples with significant capacity constraints, especially for viral vector production and sterile fill-finish services, which continues to drive M&A activity and premium pricing for specialized assets.
We can help! Our analysts can customize this pharmaceutical contract manufacturing market research report to meet your requirements.
 RIA -
RIA - 
