Photogrammetry Software Market Analysis, Size, and Forecast 2026-2030: North America (US, Canada, and Mexico), Europe (Germany, UK, and France), APAC (China, Japan, and India), South America (Brazil and Argentina), Middle East and Africa (South Africa, UAE, and Saudi Arabia), and Rest of World (ROW)

Photogrammetry Software Market Analysis, Size, and Forecast 2026-2030:
North America (US, Canada, and Mexico), Europe (Germany, UK, and France), APAC (China, Japan, and India), South America (Brazil and Argentina), Middle East and Africa (South Africa, UAE, and Saudi Arabia), and Rest of World (ROW)

Published: Dec 2025 301 Pages SKU: IRTNTR76540

Market Overview at a Glance

$1.70 B
Market Opportunity
15.9%
CAGR 2025 - 2030
44.6%
North America Growth
$489.8 Mn
3D printing segment 2024

Photogrammetry Software Market Size 2026-2030

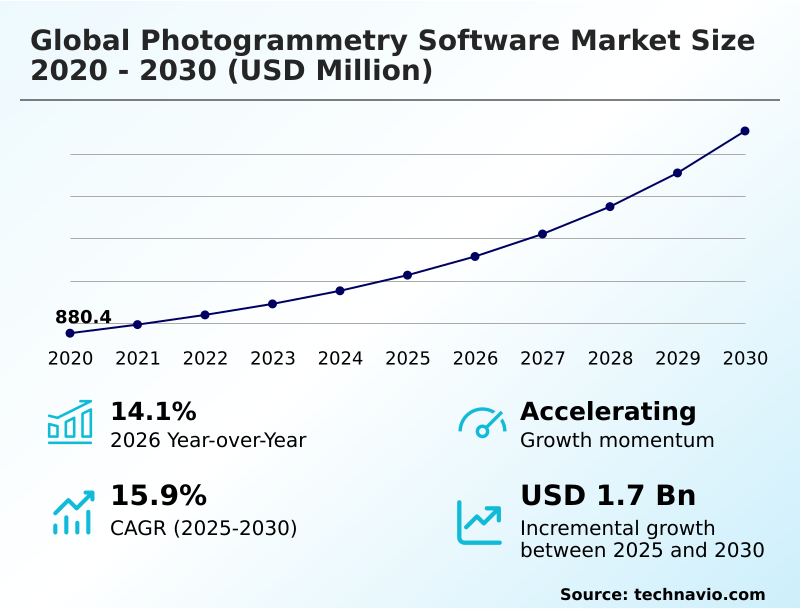
The photogrammetry software market size is valued to increase by USD 1.70 billion, at a CAGR of 15.9% from 2025 to 2030. Growing use of 3D mapping and modeling in building and construction will drive the photogrammetry software market.

Major Market Trends & Insights

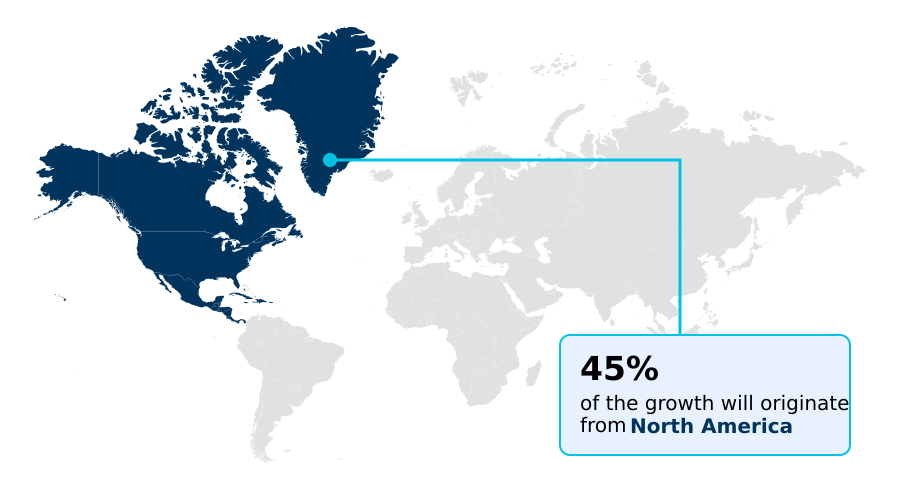
  • North America dominated the market and accounted for a 44.6% growth during the forecast period.
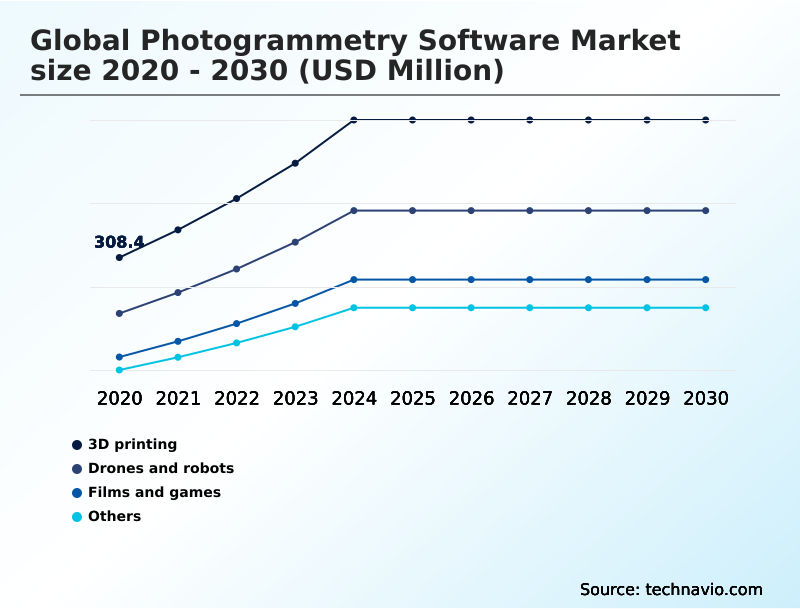
  • By Application - 3D printing segment was valued at USD 489.8 million in 2024
  • By Deployment - On-premises segment accounted for the largest market revenue share in 2024

Market Size & Forecast

  • Market Opportunities: USD 2.39 billion
  • Market Future Opportunities: USD 1.70 billion
  • CAGR from 2025 to 2030 : 15.9%

Market Summary

  • The Photogrammetry Software Market is fundamentally reshaping how industries interact with physical assets by converting photographic data into precise, actionable digital replicas. Key drivers include the widespread adoption of 3D mapping and modeling in construction and engineering, where firms leverage the technology for progress monitoring and clash detection, significantly reducing rework.
  • The entertainment industry similarly benefits, using it for creating hyper-realistic digital assets and environments. Trends are moving toward greater automation through AI and cloud-based processing, which democratizes access to powerful computational resources and enables firms to process vast datasets from drone imagery more efficiently.
  • For instance, a civil engineering firm can now deploy drones to survey a bridge, process the data overnight in the cloud, and have a detailed 3D model for inspection by the next morning, improving safety and operational speed.
  • However, the market grapples with challenges such as the need for specialized expertise to ensure survey-grade accuracy and potential inaccuracies stemming from suboptimal image capture conditions, which can impact the reliability of the final models.

What will be the Size of the Photogrammetry Software Market during the forecast period?

Get Key Insights on Market Forecast (PDF) Request Free Sample

How is the Photogrammetry Software Market Segmented?

The photogrammetry software industry research report provides comprehensive data (region-wise segment analysis), with forecasts and estimates in "USD million" for the period 2026-2030, as well as historical data from 2020-2024 for the following segments.

  • Application
    • 3D printing
    • Drones and robots
    • Films and games
    • Others
  • Deployment
    • On-premises
    • Cloud
  • Type
    • Aerial photogrammetry
    • Terrestrial photogrammetry
    • Satellite photogrammetry
    • Macro photogrammetry
  • Geography
    • North America
      • US
      • Canada
      • Mexico
    • Europe
      • Germany
      • UK
      • France
    • APAC
      • China
      • Japan
      • India
    • South America
      • Brazil
      • Argentina
    • Middle East and Africa
      • South Africa
      • UAE
      • Saudi Arabia
    • Rest of World (ROW)

By Application Insights

The 3d printing segment is estimated to witness significant growth during the forecast period.

The drones and robotics segment represents the market's most dynamic application, primarily driven by construction, agriculture, and mining industries.

The use of unmanned aerial vehicles for site surveying and construction monitoring is integral, as drone imagery is transformed via photogrammetry software into actionable geospatial data.

This process generates precise point clouds and digital surface models essential for volumetric measurements and as-built verification. Image processing algorithms now offer a 30% improvement in processing speeds, enabling faster turnaround for change detection analysis.

This application of reality capture is critical for environmental monitoring and creating detailed urban planning models, where remote sensing provides the foundational data for complex 3D reconstruction.

Request Free Sample

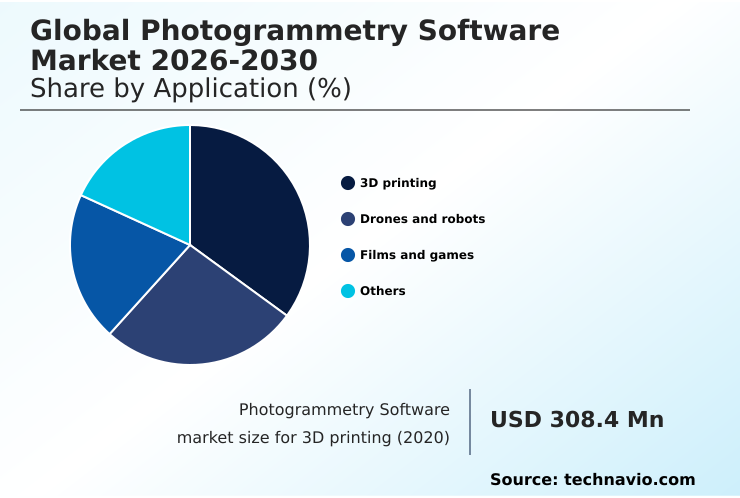
The 3D printing segment was valued at USD 489.8 million in 2024 and showed a gradual increase during the forecast period.

Request Free Sample

Regional Analysis

North America is estimated to contribute 44.6% to the growth of the global market during the forecast period.Technavio’s analysts have elaborately explained the regional trends and drivers that shape the market during the forecast period.

See How Photogrammetry Software Market Demand is Rising in North America Request Free Sample

The market landscape is shaped by distinct regional priorities. North America leads, driven by strong adoption in construction and defense, where 3D modeling for building information modeling and terrain analysis is standard.

The use of aerial photogrammetry in this region has reduced site survey times by up to 40%. Europe shows strong demand in industrial metrology and cultural heritage preservation, utilizing terrestrial photogrammetry for digital archiving.

In APAC, rapid infrastructure growth fuels demand for large-scale topographic mapping and 3D visualization, with government initiatives driving adoption.

The integration of computer vision and SLAM is critical across all regions for creating accurate digital twins, with a focus on achieving over 98% accuracy in as-built verification for major projects.

Market Dynamics

Our researchers analyzed the data with 2025 as the base year, along with the key drivers, trends, and challenges. A holistic analysis of drivers will help companies refine their marketing strategies to gain a competitive advantage.

  • The practical applications of this technology are rapidly expanding, addressing specific industry needs. For instance, photogrammetry for construction monitoring has become an industry standard, while drone-based aerial mapping software is crucial for large-scale projects. In creative sectors, 3D modeling from photos for games and creating 3D assets for virtual production are essential for achieving realism.
  • The core technological debate often centers on photogrammetry vs LiDAR for surveying, with each having distinct advantages. A key enabler of modern workflows is cloud-based photogrammetry processing, which handles massive datasets for tasks like automating change detection with photogrammetry. This is essential for using photogrammetry for infrastructure inspection and enabling the reality capture for digital twin creation.
  • Industries are automating 3D reconstruction from images to improve efficiency. Specific use cases like photogrammetry in precision agriculture, cultural heritage documentation with photogrammetry, and photogrammetry software for accident reconstruction highlight its versatility. The technology now enables high-precision forensic analysis photogrammetry and environmental monitoring with satellite photogrammetry.
  • Advanced unmanned aerial vehicle surveying software is used for both large-scale topographic mapping with drones and generating digital surface models photogrammetry. Furthermore, photogrammetry for volumetric analysis and building information modeling integration photogrammetry are critical functions in mining and AEC, respectively. Cloud platforms now manage datasets more than twice the size of legacy on-premise systems, enhancing analytical capabilities.

What are the key market drivers leading to the rise in the adoption of Photogrammetry Software Industry?

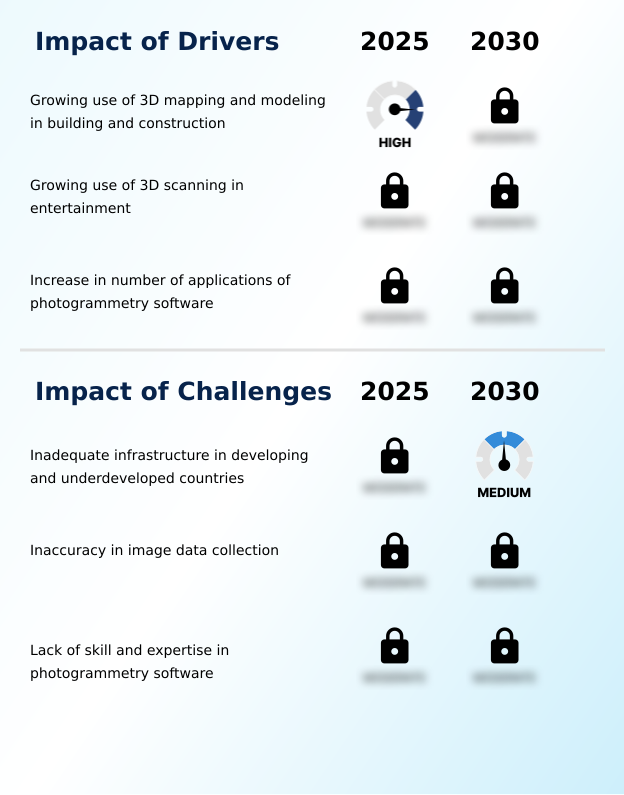
  • The increasing adoption of 3D mapping and modeling within the building and construction sectors is a key driver for market growth.

  • The market's growth is propelled by its expanding applications in core industries. The use of 3D modeling and 3D mapping in construction and engineering has become a primary driver, reducing design-to-build rework by 15% through enhanced pre-construction visualization.
  • In the entertainment sector, terrestrial photogrammetry and 3D scanning are critical for creating hyper-realistic characters and environments, accelerating digital asset creation for games by up to 50%.
  • The expanding use of unmanned aerial systems for collecting high-resolution imagery enables a broader range of applications, from subsea photogrammetry for offshore inspections to stockpile measurement in mining.
  • The demand for survey-grade accuracy in creating orthomosaics and 3D mesh models for as-built verification and legal documentation continues to fuel adoption across professional services.

What are the market trends shaping the Photogrammetry Software Industry?

  • The expanding application of 3D printing for manufacturing drone and quadcopter models is an emerging trend. This synergy enhances rapid prototyping and customized designs for aerial data capture.

  • Market trends are shaped by the convergence of advanced technologies. The synergy between 3D printing and 3D scanning is enabling rapid prototyping, with manufacturers reporting a 20% faster design-to-production cycle for custom components. Strategic alliances are pivotal, fostering the integration of AI-powered geospatial intelligence into software suites, which improves image alignment and texture mapping accuracy.
  • This has allowed for a 25% improvement in automated workflow efficiency. Technological advancements in reality modeling and Structure from Motion algorithms are enhancing the creation of detailed digital elevation models.
  • Furthermore, the rise of Multi-View Stereo technology is driving the development of more sophisticated tools for damage assessment and open-pit mine mapping, making photogrammetry a more versatile tool for industrial and environmental applications.

What challenges does the Photogrammetry Software Industry face during its growth?

  • Inadequate infrastructure in developing and underdeveloped nations presents a significant challenge to the widespread adoption and growth of the photogrammetry software industry.

  • Despite its growth, the market faces persistent challenges that impact widespread adoption. The demand for skilled professionals who can ensure survey-grade accuracy and perform complex volumetric analysis creates a significant skills gap, which increases project onboarding times by an estimated 20%.
  • Inaccuracy in data collection, stemming from poor lighting or uncalibrated sensors, remains a critical issue, potentially causing model deviations of up to 5% and requiring extensive post-processing. Furthermore, inadequate infrastructure in developing regions hinders the adoption of cloud-based platforms and unmanned aerial systems.
  • This limits the application of satellite photogrammetry and macro photogrammetry in markets that could greatly benefit from forensic analysis and modern site surveying techniques, thereby constraining the full potential of these powerful computer vision tools.

Exclusive Technavio Analysis on Customer Landscape

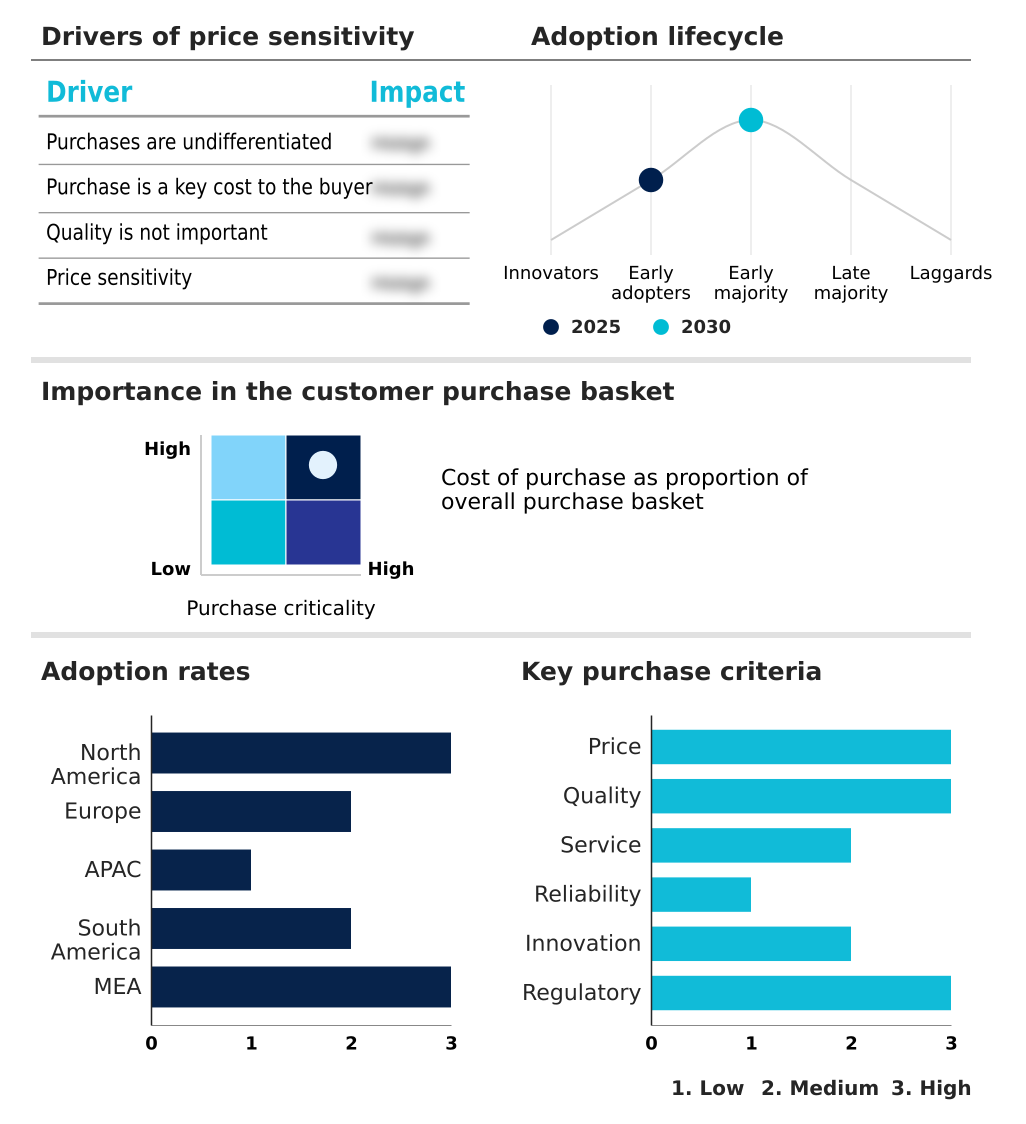
The photogrammetry software market forecasting report includes the adoption lifecycle of the market, covering from the innovator’s stage to the laggard’s stage. It focuses on adoption rates in different regions based on penetration. Furthermore, the photogrammetry software market report also includes key purchase criteria and drivers of price sensitivity to help companies evaluate and develop their market growth analysis strategies.

Customer Landscape of Photogrammetry Software Industry

Competitive Landscape

Companies are implementing various strategies, such as strategic alliances, photogrammetry software market forecast, partnerships, mergers and acquisitions, geographical expansion, and product/service launches, to enhance their presence in the industry.

3Dflow SRL - Advanced software transforms 2D imagery into precise 3D models, enabling critical data-driven decisions across industrial, geospatial, and entertainment sectors.

The industry research and growth report includes detailed analyses of the competitive landscape of the market and information about key companies, including:

  • 3Dflow SRL
  • Agisoft LLC
  • Autodesk Inc.
  • BAE Systems Plc
  • Bentley Systems Inc.
  • DroneDeploy Inc.
  • Epic Games Inc.
  • Esri Global Inc.
  • Hexagon AB
  • Linearis3D GmbH and Co. KG
  • Menci software SRL
  • Phase One AS
  • PhotoModeler Technologies
  • Pix4D SA
  • REDcatch GmbH
  • SimActive Inc.
  • Skyline Software Systems Inc.
  • Teledyne Technologies Inc.
  • Trimble Inc.
  • Vexcel Imaging GmbH

Qualitative and quantitative analysis of companies has been conducted to help clients understand the wider business environment as well as the strengths and weaknesses of key industry players. Data is qualitatively analyzed to categorize companies as pure play, category-focused, industry-focused, and diversified; it is quantitatively analyzed to categorize companies as dominant, leading, strong, tentative, and weak.

Recent Development and News in Photogrammetry software market

  • In August 2024, Carlson Software introduced PhotoCapture version 2, an advanced photogrammetry solution designed to transform drone imagery into accurate 3D models and maps.
  • In September 2024, Bentley Systems completed the acquisition of Cesium, combining powerful engineering software with an open platform for immersive 3D geospatial experiences.
  • In April 2025, SimActive announced the release of Correlator3D version 10.4, a major update to its advanced photogrammetry software featuring significant improvements in processing speed, accuracy, and automation.
  • In April 2025, Bentley Systems introduced a technical preview of Gaussian Splatting technology within its iTwin Capture Modeler, enhancing the conversion of real-world imagery into immersive 3D models.

Dive into Technavio’s robust research methodology, blending expert interviews, extensive data synthesis, and validated models for unparalleled Photogrammetry Software Market insights. See full methodology.

Market Scope
Page number 301
Base year 2025
Historic period 2020-2024
Forecast period 2026-2030
Growth momentum & CAGR Accelerate at a CAGR of 15.9%
Market growth 2026-2030 USD 1704.1 million
Market structure Fragmented
YoY growth 2025-2026(%) 14.1%
Key countries US, Canada, Mexico, Germany, UK, France, Italy, Spain, The Netherlands, China, Japan, India, Australia, South Korea, Indonesia, Brazil, Argentina, Chile, South Africa, UAE, Saudi Arabia, Egypt and Kenya
Competitive landscape Leading Companies, Market Positioning of Companies, Competitive Strategies, and Industry Risks

Request Free Sample

Research Analyst Overview

  • The photogrammetry software market is evolving from a specialized niche into a foundational enterprise technology for reality capture. This shift is driven by its ability to generate high-fidelity 3D mesh models and dense point clouds from standard drone imagery, enabling a wide range of applications from 3D mapping to 3D modeling.
  • Key technologies like Structure from Motion and Multi-View Stereo are being enhanced with automated feature extraction powered by AI, turning raw geospatial data into geospatial intelligence. The integration with building information modeling and the creation of digital twins are no longer theoretical; they are strategic imperatives.
  • For instance, companies are reporting up to a 30% reduction in data processing time, directly impacting project timelines and budgets. This level of efficiency is compelling executive boards to integrate reality modeling into their long-term asset management and capital expenditure strategies, moving beyond simple 3D visualization to predictive maintenance and operational optimization.
  • As 3D reconstruction becomes more automated, the value proposition extends across sectors, from topographic mapping to industrial metrology.

What are the Key Data Covered in this Photogrammetry Software Market Research and Growth Report?

  • What is the expected growth of the Photogrammetry Software Market between 2026 and 2030?

    • USD 1.70 billion, at a CAGR of 15.9%

  • What segmentation does the market report cover?

    • The report is segmented by Application (3D printing, Drones and robots, Films and games, and Others), Deployment (On-premises, and Cloud), Type (Aerial photogrammetry, Terrestrial photogrammetry, Satellite photogrammetry, and Macro photogrammetry) and Geography (North America, Europe, APAC, South America, Middle East and Africa)

  • Which regions are analyzed in the report?

    • North America, Europe, APAC, South America and Middle East and Africa

  • What are the key growth drivers and market challenges?

    • Growing use of 3D mapping and modeling in building and construction, Inadequate infrastructure in developing and underdeveloped countries

  • Who are the major players in the Photogrammetry Software Market?

    • 3Dflow SRL, Agisoft LLC, Autodesk Inc., BAE Systems Plc, Bentley Systems Inc., DroneDeploy Inc., Epic Games Inc., Esri Global Inc., Hexagon AB, Linearis3D GmbH and Co. KG, Menci software SRL, Phase One AS, PhotoModeler Technologies, Pix4D SA, REDcatch GmbH, SimActive Inc., Skyline Software Systems Inc., Teledyne Technologies Inc., Trimble Inc. and Vexcel Imaging GmbH

Market Research Insights

  • The market is characterized by a rapid evolution of capabilities, driven by the integration of AI and cloud computing into reality capture platforms. This shift is democratizing access to high-end geospatial solutions, enabling firms to achieve a 35% reduction in data processing times.
  • Infrastructure inspection and precision agriculture are key growth verticals, where the adoption of unmanned aerial systems for corridor mapping and plant health analysis has improved operational efficiency by over 25%. As virtual production and demand for immersive 3D experiences expand, the need for high-fidelity digital asset creation and efficient asset scanning is escalating.
  • These dynamics create a competitive environment where the ability to provide scalable, accurate, and integrated geospatial platforms is paramount for capturing market share.

We can help! Our analysts can customize this photogrammetry software market research report to meet your requirements.

Get in touch

1. Executive Summary

1.1 Market overview

Executive Summary - Chart on Market Overview
Executive Summary - Data Table on Market Overview
Executive Summary - Chart on Global Market Characteristics
Executive Summary - Chart on Market by Geography
Executive Summary - Chart on Market Segmentation by Application
Executive Summary - Chart on Market Segmentation by Deployment
Executive Summary - Chart on Market Segmentation by Type
Executive Summary - Chart on Incremental Growth
Executive Summary - Data Table on Incremental Growth
Executive Summary - Chart on Company Market Positioning

2. Technavio Analysis

2.1 Analysis of price sensitivity, lifecycle, customer purchase basket, adoption rates, and purchase criteria

2.2 Criticality of inputs and Factors of differentiation

Chart on Overview on criticality of inputs and factors of differentiation

2.3 Factors of disruption

Chart on Overview on factors of disruption

2.4 Impact of drivers and challenges

Chart on Impact of drivers and challenges in 2025 and 2030

3. Market Landscape

3.1 Market ecosystem

Chart on Parent Market
Data Table on - Parent Market

3.2 Market characteristics

Chart on Market characteristics analysis

3.3 Value chain analysis

Chart on Value chain analysis

4. Market Sizing

4.1 Market definition

Data Table on Offerings of companies included in the market definition

4.2 Market segment analysis

Market segments

4.3 Market size 2025

4.4 Market outlook: Forecast for 2025-2030

Chart on Global - Market size and forecast 2025-2030 ($ million)
Data Table on Global - Market size and forecast 2025-2030 ($ million)
Chart on Global Market: Year-over-year growth 2025-2030 (%)
Data Table on Global Market: Year-over-year growth 2025-2030 (%)

5. Historic Market Size

5.1 Global Photogrammetry Software Market 2020 - 2024

Historic Market Size - Data Table on Global Photogrammetry Software Market 2020 - 2024 ($ million)

5.2 Application segment analysis 2020 - 2024

Historic Market Size - Application Segment 2020 - 2024 ($ million)

5.3 Deployment segment analysis 2020 - 2024

Historic Market Size - Deployment Segment 2020 - 2024 ($ million)

5.4 Type segment analysis 2020 - 2024

Historic Market Size - Type Segment 2020 - 2024 ($ million)

5.5 Geography segment analysis 2020 - 2024

Historic Market Size - Geography Segment 2020 - 2024 ($ million)

5.6 Country segment analysis 2020 - 2024

Historic Market Size - Country Segment 2020 - 2024 ($ million)

6. Qualitative Analysis

6.1 The AI impact on Global Photogrammetry Software Market

7. Five Forces Analysis

7.1 Five forces summary

Five forces analysis - Comparison between 2025 and 2030

7.2 Bargaining power of buyers

Bargaining power of buyers - Impact of key factors 2025 and 2030

7.3 Bargaining power of suppliers

Bargaining power of suppliers - Impact of key factors in 2025 and 2030

7.4 Threat of new entrants

Threat of new entrants - Impact of key factors in 2025 and 2030

7.5 Threat of substitutes

Threat of substitutes - Impact of key factors in 2025 and 2030

7.6 Threat of rivalry

Threat of rivalry - Impact of key factors in 2025 and 2030

7.7 Market condition

Chart on Market condition - Five forces 2025 and 2030

8. Market Segmentation by Application

8.1 Market segments

Chart on Application - Market share 2025-2030 (%)
Data Table on Application - Market share 2025-2030 (%)

8.2 Comparison by Application

Chart on Comparison by Application
Data Table on Comparison by Application

8.3 3D printing - Market size and forecast 2025-2030

Chart on 3D printing - Market size and forecast 2025-2030 ($ million)
Data Table on 3D printing - Market size and forecast 2025-2030 ($ million)
Chart on 3D printing - Year-over-year growth 2025-2030 (%)
Data Table on 3D printing - Year-over-year growth 2025-2030 (%)

8.4 Drones and robots - Market size and forecast 2025-2030

Chart on Drones and robots - Market size and forecast 2025-2030 ($ million)
Data Table on Drones and robots - Market size and forecast 2025-2030 ($ million)
Chart on Drones and robots - Year-over-year growth 2025-2030 (%)
Data Table on Drones and robots - Year-over-year growth 2025-2030 (%)

8.5 Films and games - Market size and forecast 2025-2030

Chart on Films and games - Market size and forecast 2025-2030 ($ million)
Data Table on Films and games - Market size and forecast 2025-2030 ($ million)
Chart on Films and games - Year-over-year growth 2025-2030 (%)
Data Table on Films and games - Year-over-year growth 2025-2030 (%)

8.6 Others - Market size and forecast 2025-2030

Chart on Others - Market size and forecast 2025-2030 ($ million)
Data Table on Others - Market size and forecast 2025-2030 ($ million)
Chart on Others - Year-over-year growth 2025-2030 (%)
Data Table on Others - Year-over-year growth 2025-2030 (%)

8.7 Market opportunity by Application

Market opportunity by Application ($ million)
Data Table on Market opportunity by Application ($ million)

9. Market Segmentation by Deployment

9.1 Market segments

Chart on Deployment - Market share 2025-2030 (%)
Data Table on Deployment - Market share 2025-2030 (%)

9.2 Comparison by Deployment

Chart on Comparison by Deployment
Data Table on Comparison by Deployment

9.3 On-premises - Market size and forecast 2025-2030

Chart on On-premises - Market size and forecast 2025-2030 ($ million)
Data Table on On-premises - Market size and forecast 2025-2030 ($ million)
Chart on On-premises - Year-over-year growth 2025-2030 (%)
Data Table on On-premises - Year-over-year growth 2025-2030 (%)

9.4 Cloud - Market size and forecast 2025-2030

Chart on Cloud - Market size and forecast 2025-2030 ($ million)
Data Table on Cloud - Market size and forecast 2025-2030 ($ million)
Chart on Cloud - Year-over-year growth 2025-2030 (%)
Data Table on Cloud - Year-over-year growth 2025-2030 (%)

9.5 Market opportunity by Deployment

Market opportunity by Deployment ($ million)
Data Table on Market opportunity by Deployment ($ million)

10. Market Segmentation by Type

10.1 Market segments

Chart on Type - Market share 2025-2030 (%)
Data Table on Type - Market share 2025-2030 (%)

10.2 Comparison by Type

Chart on Comparison by Type
Data Table on Comparison by Type

10.3 Aerial photogrammetry - Market size and forecast 2025-2030

Chart on Aerial photogrammetry - Market size and forecast 2025-2030 ($ million)
Data Table on Aerial photogrammetry - Market size and forecast 2025-2030 ($ million)
Chart on Aerial photogrammetry - Year-over-year growth 2025-2030 (%)
Data Table on Aerial photogrammetry - Year-over-year growth 2025-2030 (%)

10.4 Terrestrial photogrammetry - Market size and forecast 2025-2030

Chart on Terrestrial photogrammetry - Market size and forecast 2025-2030 ($ million)
Data Table on Terrestrial photogrammetry - Market size and forecast 2025-2030 ($ million)
Chart on Terrestrial photogrammetry - Year-over-year growth 2025-2030 (%)
Data Table on Terrestrial photogrammetry - Year-over-year growth 2025-2030 (%)

10.5 Satellite photogrammetry - Market size and forecast 2025-2030

Chart on Satellite photogrammetry - Market size and forecast 2025-2030 ($ million)
Data Table on Satellite photogrammetry - Market size and forecast 2025-2030 ($ million)
Chart on Satellite photogrammetry - Year-over-year growth 2025-2030 (%)
Data Table on Satellite photogrammetry - Year-over-year growth 2025-2030 (%)

10.6 Macro photogrammetry - Market size and forecast 2025-2030

Chart on Macro photogrammetry - Market size and forecast 2025-2030 ($ million)
Data Table on Macro photogrammetry - Market size and forecast 2025-2030 ($ million)
Chart on Macro photogrammetry - Year-over-year growth 2025-2030 (%)
Data Table on Macro photogrammetry - Year-over-year growth 2025-2030 (%)

10.7 Market opportunity by Type

Market opportunity by Type ($ million)
Data Table on Market opportunity by Type ($ million)

11. Customer Landscape

11.1 Customer landscape overview

Analysis of price sensitivity, lifecycle, customer purchase basket, adoption rates, and purchase criteria

12. Geographic Landscape

12.1 Geographic segmentation

Chart on Market share by geography 2025-2030 (%)
Data Table on Market share by geography 2025-2030 (%)

12.2 Geographic comparison

Chart on Geographic comparison
Data Table on Geographic comparison

12.3 North America - Market size and forecast 2025-2030

Chart on North America - Market size and forecast 2025-2030 ($ million)
Data Table on North America - Market size and forecast 2025-2030 ($ million)
Chart on North America - Year-over-year growth 2025-2030 (%)
Data Table on North America - Year-over-year growth 2025-2030 (%)
Chart on Regional Comparison - North America
Data Table on Regional Comparison - North America

12.3.1 US - Market size and forecast 2025-2030

Chart on US - Market size and forecast 2025-2030 ($ million)
Data Table on US - Market size and forecast 2025-2030 ($ million)
Chart on US - Year-over-year growth 2025-2030 (%)
Data Table on US - Year-over-year growth 2025-2030 (%)

12.3.2 Canada - Market size and forecast 2025-2030

Chart on Canada - Market size and forecast 2025-2030 ($ million)
Data Table on Canada - Market size and forecast 2025-2030 ($ million)
Chart on Canada - Year-over-year growth 2025-2030 (%)
Data Table on Canada - Year-over-year growth 2025-2030 (%)

12.3.3 Mexico - Market size and forecast 2025-2030

Chart on Mexico - Market size and forecast 2025-2030 ($ million)
Data Table on Mexico - Market size and forecast 2025-2030 ($ million)
Chart on Mexico - Year-over-year growth 2025-2030 (%)
Data Table on Mexico - Year-over-year growth 2025-2030 (%)

12.4 Europe - Market size and forecast 2025-2030

Chart on Europe - Market size and forecast 2025-2030 ($ million)
Data Table on Europe - Market size and forecast 2025-2030 ($ million)
Chart on Europe - Year-over-year growth 2025-2030 (%)
Data Table on Europe - Year-over-year growth 2025-2030 (%)
Chart on Regional Comparison - Europe
Data Table on Regional Comparison - Europe

12.4.1 Germany - Market size and forecast 2025-2030

Chart on Germany - Market size and forecast 2025-2030 ($ million)
Data Table on Germany - Market size and forecast 2025-2030 ($ million)
Chart on Germany - Year-over-year growth 2025-2030 (%)
Data Table on Germany - Year-over-year growth 2025-2030 (%)

12.4.2 UK - Market size and forecast 2025-2030

Chart on UK - Market size and forecast 2025-2030 ($ million)
Data Table on UK - Market size and forecast 2025-2030 ($ million)
Chart on UK - Year-over-year growth 2025-2030 (%)
Data Table on UK - Year-over-year growth 2025-2030 (%)

12.4.3 France - Market size and forecast 2025-2030

Chart on France - Market size and forecast 2025-2030 ($ million)
Data Table on France - Market size and forecast 2025-2030 ($ million)
Chart on France - Year-over-year growth 2025-2030 (%)
Data Table on France - Year-over-year growth 2025-2030 (%)

12.4.4 Italy - Market size and forecast 2025-2030

Chart on Italy - Market size and forecast 2025-2030 ($ million)
Data Table on Italy - Market size and forecast 2025-2030 ($ million)
Chart on Italy - Year-over-year growth 2025-2030 (%)
Data Table on Italy - Year-over-year growth 2025-2030 (%)

12.4.5 Spain - Market size and forecast 2025-2030

Chart on Spain - Market size and forecast 2025-2030 ($ million)
Data Table on Spain - Market size and forecast 2025-2030 ($ million)
Chart on Spain - Year-over-year growth 2025-2030 (%)
Data Table on Spain - Year-over-year growth 2025-2030 (%)

12.4.6 The Netherlands - Market size and forecast 2025-2030

Chart on The Netherlands - Market size and forecast 2025-2030 ($ million)
Data Table on The Netherlands - Market size and forecast 2025-2030 ($ million)
Chart on The Netherlands - Year-over-year growth 2025-2030 (%)
Data Table on The Netherlands - Year-over-year growth 2025-2030 (%)

12.5 APAC - Market size and forecast 2025-2030

Chart on APAC - Market size and forecast 2025-2030 ($ million)
Data Table on APAC - Market size and forecast 2025-2030 ($ million)
Chart on APAC - Year-over-year growth 2025-2030 (%)
Data Table on APAC - Year-over-year growth 2025-2030 (%)
Chart on Regional Comparison - APAC
Data Table on Regional Comparison - APAC

12.5.1 China - Market size and forecast 2025-2030

Chart on China - Market size and forecast 2025-2030 ($ million)
Data Table on China - Market size and forecast 2025-2030 ($ million)
Chart on China - Year-over-year growth 2025-2030 (%)
Data Table on China - Year-over-year growth 2025-2030 (%)

12.5.2 Japan - Market size and forecast 2025-2030

Chart on Japan - Market size and forecast 2025-2030 ($ million)
Data Table on Japan - Market size and forecast 2025-2030 ($ million)
Chart on Japan - Year-over-year growth 2025-2030 (%)
Data Table on Japan - Year-over-year growth 2025-2030 (%)

12.5.3 India - Market size and forecast 2025-2030

Chart on India - Market size and forecast 2025-2030 ($ million)
Data Table on India - Market size and forecast 2025-2030 ($ million)
Chart on India - Year-over-year growth 2025-2030 (%)
Data Table on India - Year-over-year growth 2025-2030 (%)

12.5.4 Australia - Market size and forecast 2025-2030

Chart on Australia - Market size and forecast 2025-2030 ($ million)
Data Table on Australia - Market size and forecast 2025-2030 ($ million)
Chart on Australia - Year-over-year growth 2025-2030 (%)
Data Table on Australia - Year-over-year growth 2025-2030 (%)

12.5.5 South Korea - Market size and forecast 2025-2030

Chart on South Korea - Market size and forecast 2025-2030 ($ million)
Data Table on South Korea - Market size and forecast 2025-2030 ($ million)
Chart on South Korea - Year-over-year growth 2025-2030 (%)
Data Table on South Korea - Year-over-year growth 2025-2030 (%)

12.5.6 Indonesia - Market size and forecast 2025-2030

Chart on Indonesia - Market size and forecast 2025-2030 ($ million)
Data Table on Indonesia - Market size and forecast 2025-2030 ($ million)
Chart on Indonesia - Year-over-year growth 2025-2030 (%)
Data Table on Indonesia - Year-over-year growth 2025-2030 (%)

12.6 South America - Market size and forecast 2025-2030

Chart on South America - Market size and forecast 2025-2030 ($ million)
Data Table on South America - Market size and forecast 2025-2030 ($ million)
Chart on South America - Year-over-year growth 2025-2030 (%)
Data Table on South America - Year-over-year growth 2025-2030 (%)
Chart on Regional Comparison - South America
Data Table on Regional Comparison - South America

12.6.1 Brazil - Market size and forecast 2025-2030

Chart on Brazil - Market size and forecast 2025-2030 ($ million)
Data Table on Brazil - Market size and forecast 2025-2030 ($ million)
Chart on Brazil - Year-over-year growth 2025-2030 (%)
Data Table on Brazil - Year-over-year growth 2025-2030 (%)

12.6.2 Argentina - Market size and forecast 2025-2030

Chart on Argentina - Market size and forecast 2025-2030 ($ million)
Data Table on Argentina - Market size and forecast 2025-2030 ($ million)
Chart on Argentina - Year-over-year growth 2025-2030 (%)
Data Table on Argentina - Year-over-year growth 2025-2030 (%)

12.6.3 Chile - Market size and forecast 2025-2030

Chart on Chile - Market size and forecast 2025-2030 ($ million)
Data Table on Chile - Market size and forecast 2025-2030 ($ million)
Chart on Chile - Year-over-year growth 2025-2030 (%)
Data Table on Chile - Year-over-year growth 2025-2030 (%)

12.7 Middle East and Africa - Market size and forecast 2025-2030

Chart on Middle East and Africa - Market size and forecast 2025-2030 ($ million)
Data Table on Middle East and Africa - Market size and forecast 2025-2030 ($ million)
Chart on Middle East and Africa - Year-over-year growth 2025-2030 (%)
Data Table on Middle East and Africa - Year-over-year growth 2025-2030 (%)
Chart on Regional Comparison - Middle East and Africa
Data Table on Regional Comparison - Middle East and Africa

12.7.1 South Africa - Market size and forecast 2025-2030

Chart on South Africa - Market size and forecast 2025-2030 ($ million)
Data Table on South Africa - Market size and forecast 2025-2030 ($ million)
Chart on South Africa - Year-over-year growth 2025-2030 (%)
Data Table on South Africa - Year-over-year growth 2025-2030 (%)

12.7.2 UAE - Market size and forecast 2025-2030

Chart on UAE - Market size and forecast 2025-2030 ($ million)
Data Table on UAE - Market size and forecast 2025-2030 ($ million)
Chart on UAE - Year-over-year growth 2025-2030 (%)
Data Table on UAE - Year-over-year growth 2025-2030 (%)

12.7.3 Saudi Arabia - Market size and forecast 2025-2030

Chart on Saudi Arabia - Market size and forecast 2025-2030 ($ million)
Data Table on Saudi Arabia - Market size and forecast 2025-2030 ($ million)
Chart on Saudi Arabia - Year-over-year growth 2025-2030 (%)
Data Table on Saudi Arabia - Year-over-year growth 2025-2030 (%)

12.7.4 Egypt - Market size and forecast 2025-2030

Chart on Egypt - Market size and forecast 2025-2030 ($ million)
Data Table on Egypt - Market size and forecast 2025-2030 ($ million)
Chart on Egypt - Year-over-year growth 2025-2030 (%)
Data Table on Egypt - Year-over-year growth 2025-2030 (%)

12.7.5 Kenya - Market size and forecast 2025-2030

Chart on Kenya - Market size and forecast 2025-2030 ($ million)
Data Table on Kenya - Market size and forecast 2025-2030 ($ million)
Chart on Kenya - Year-over-year growth 2025-2030 (%)
Data Table on Kenya - Year-over-year growth 2025-2030 (%)

12.8 Market opportunity by geography

Market opportunity by geography ($ million)
Data Tables on Market opportunity by geography ($ million)

13. Drivers, Challenges, and Opportunity

13.1 Market drivers

Growing use of 3D mapping and modeling in building and construction
Growing use of 3D scanning in entertainment
Increase in number of applications of photogrammetry software

13.2 Market challenges

Inadequate infrastructure in developing and underdeveloped countries
Inaccuracy in image data collection
Lack of skill and expertise in photogrammetry software

13.3 Impact of drivers and challenges

Impact of drivers and challenges in 2025 and 2030

13.4 Market opportunities

Growing use of 3D printing to manufacture models of drones and quadcopters
Rising strategic alliances among companies
Growth in technological advancements

14. Competitive Landscape

14.1 Overview

14.2

Overview on criticality of inputs and factors of differentiation

14.3 Landscape disruption

Overview on factors of disruption

14.4 Industry risks

Impact of key risks on business

15. Competitive Analysis

15.1 Companies profiled

Companies covered

15.2 Company ranking index

15.3 Market positioning of companies

Matrix on companies position and classification

15.4 3Dflow SRL

3Dflow SRL - Overview
3Dflow SRL - Product / Service
3Dflow SRL - Key offerings
SWOT

15.5 Agisoft LLC

Agisoft LLC - Overview
Agisoft LLC - Product / Service
Agisoft LLC - Key offerings
SWOT

15.6 Autodesk Inc.

Autodesk Inc. - Overview
Autodesk Inc. - Business segments
Autodesk Inc. - Key news
Autodesk Inc. - Key offerings
Autodesk Inc. - Segment focus
SWOT

15.7 BAE Systems Plc

BAE Systems Plc - Overview
BAE Systems Plc - Business segments
BAE Systems Plc - Key news
BAE Systems Plc - Key offerings
BAE Systems Plc - Segment focus
SWOT

15.8 Bentley Systems Inc.

Bentley Systems Inc. - Overview
Bentley Systems Inc. - Business segments
Bentley Systems Inc. - Key news
Bentley Systems Inc. - Key offerings
Bentley Systems Inc. - Segment focus
SWOT

15.9 DroneDeploy Inc.

DroneDeploy Inc. - Overview
DroneDeploy Inc. - Product / Service
DroneDeploy Inc. - Key offerings
SWOT

15.10 Epic Games Inc.

Epic Games Inc. - Overview
Epic Games Inc. - Product / Service
Epic Games Inc. - Key offerings
SWOT

15.11 Esri Global Inc.

Esri Global Inc. - Overview
Esri Global Inc. - Product / Service
Esri Global Inc. - Key offerings
SWOT

15.12 Hexagon AB

Hexagon AB - Overview
Hexagon AB - Business segments
Hexagon AB - Key news
Hexagon AB - Key offerings
Hexagon AB - Segment focus
SWOT

15.13 Linearis3D GmbH and Co. KG

Linearis3D GmbH and Co. KG - Overview
Linearis3D GmbH and Co. KG - Product / Service
Linearis3D GmbH and Co. KG - Key offerings
SWOT

15.14 PhotoModeler Technologies

PhotoModeler Technologies - Overview
PhotoModeler Technologies - Product / Service
PhotoModeler Technologies - Key offerings
SWOT

15.15 Pix4D SA

Pix4D SA - Overview
Pix4D SA - Product / Service
Pix4D SA - Key offerings
SWOT

15.16 Skyline Software Systems Inc.

Skyline Software Systems Inc. - Overview
Skyline Software Systems Inc. - Product / Service
Skyline Software Systems Inc. - Key offerings
SWOT

15.17 Teledyne Technologies Inc.

Teledyne Technologies Inc. - Overview
Teledyne Technologies Inc. - Business segments
Teledyne Technologies Inc. - Key news
Teledyne Technologies Inc. - Key offerings
Teledyne Technologies Inc. - Segment focus
SWOT

15.18 Trimble Inc.

Trimble Inc. - Overview
Trimble Inc. - Business segments
Trimble Inc. - Key news
Trimble Inc. - Key offerings
Trimble Inc. - Segment focus
SWOT

16. Appendix

16.1 Scope of the report

Market definition
Objectives
Notes and caveats

16.2 Inclusions and exclusions checklist

Inclusions checklist
Exclusions checklist

16.3 Currency conversion rates for US$

16.4 Research methodology

16.5 Data procurement

Information sources

16.6 Data validation

16.7 Validation techniques employed for market sizing

16.8 Data synthesis

16.9 360 degree market analysis

16.10 List of abbreviations

Research Methodology

Technavio presents a detailed picture of the market by way of study, synthesis, and summation of data from multiple sources. The analysts have presented the various facets of the market with a particular focus on identifying the key industry influencers. The data thus presented is comprehensive, reliable, and the result of extensive research, both primary and secondary.

INFORMATION SOURCES

Primary sources

  • Manufacturers and suppliers
  • Channel partners
  • Industry experts
  • Strategic decision makers

Secondary sources

  • Industry journals and periodicals
  • Government data
  • Financial reports of key industry players
  • Historical data
  • Press releases

DATA ANALYSIS

Data Synthesis

  • Collation of data
  • Estimation of key figures
  • Analysis of derived insights

Data Validation

  • Triangulation with data models
  • Reference against proprietary databases
  • Corroboration with industry experts

REPORT WRITING

Qualitative

  • Market drivers
  • Market challenges
  • Market trends
  • Five forces analysis

Quantitative

  • Market size and forecast
  • Market segmentation
  • Geographical insights
  • Competitive landscape

Interested in this report?

Get your sample now to see our research methodology and insights!

Download Now

Frequently Asked Questions

Photogrammetry Software market growth will increase by USD 1704.1 million during 2026-2030.

The Photogrammetry Software market is expected to grow at a CAGR of 15.9% during 2026-2030.

Photogrammetry Software market is segmented by Application (3D printing, Drones and robots, Films and games, Others) Deployment (On-premises, Cloud) Type (Aerial photogrammetry, Terrestrial photogrammetry, Satellite photogrammetry, Macro photogrammetry)

3Dflow SRL, Agisoft LLC, Autodesk Inc., BAE Systems Plc, Bentley Systems Inc., DroneDeploy Inc., Epic Games Inc., Esri Global Inc., Hexagon AB, Linearis3D GmbH and Co. KG, Menci software SRL, Phase One AS, PhotoModeler Technologies, Pix4D SA, REDcatch GmbH, SimActive Inc., Skyline Software Systems Inc., Teledyne Technologies Inc., Trimble Inc., Vexcel Imaging GmbH are a few of the key vendors in the Photogrammetry Software market.

North America will register the highest growth rate of 44.6% among the other regions. Therefore, the Photogrammetry Software market in North America is expected to garner significant business opportunities for the vendors during the forecast period.

US, Canada, Mexico, Germany, UK, France, Italy, Spain, The Netherlands, China, Japan, India, Australia, South Korea, Indonesia, Brazil, Argentina, Chile, South Africa, UAE, Saudi Arabia, Egypt, Kenya

  • Growing use of 3D mapping and modeling in building and construction is the driving factor this market.

The Photogrammetry Software market vendors should focus on grabbing business opportunities from the Application segment as it accounted for the largest market share in the base year.