Physical Iam Market Analysis North America, Europe, APAC, Middle East and Africa, South America - US, China, Germany, UK, Japan - Size and Forecast 2024-2028

Physical Iam Market Analysis North America, Europe, APAC, Middle East and Africa, South America - US, China, Germany, UK, Japan - Size and Forecast 2024-2028

Published: Jul 2024 160 Pages SKU: IRTNTR75003

Market Overview at a Glance

$1.31 B
Market Opportunity
16.5%
CAGR
13.79
YoY growth 2023-2024(%)

Physical IAM Market Size 2024-2028

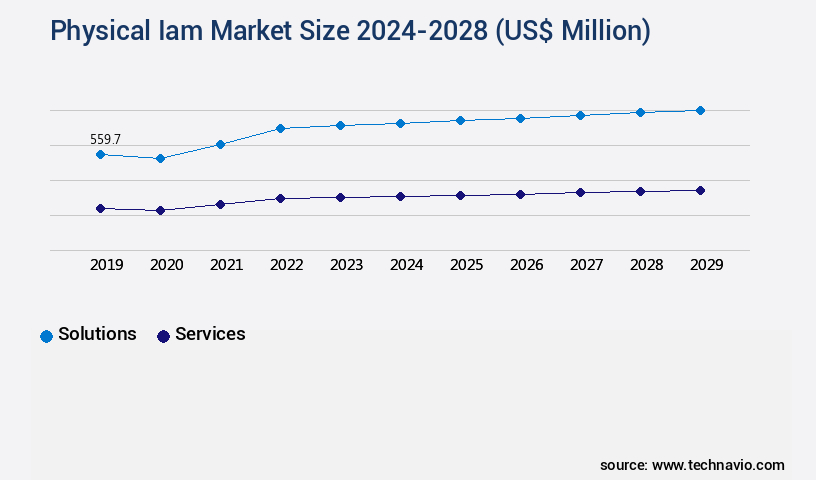
The physical IAM market size is valued to increase USD 1.31 billion, at a CAGR of 16.5% from 2023 to 2028. Rapid growth of Internet of Things (IoT) networks will drive the physical IAM market.

Major Market Trends & Insights

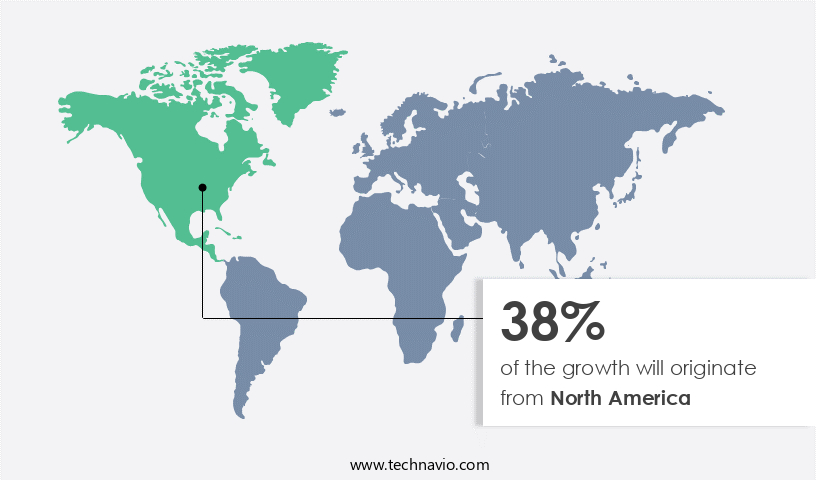
  • North America dominated the market and accounted for a 38% growth during the forecast period.
  • By Component - Solutions segment was valued at USD 503.30 billion in 2022
  • By End-user - Commercial segment accounted for the largest market revenue share in 2022

Market Size & Forecast

  • Market Opportunities: USD 240.04 million
  • Market Future Opportunities: USD 1314.80 million
  • CAGR : 16.5%
  • North America: Largest market in 2022

Market Summary

  • The market refers to the segment of Identity and Access Management (IAM) that focuses on securing physical access to facilities and assets. This market is experiencing significant growth due to the rapid expansion of Internet of Things (IoT) networks, which increase the need for Multi-Factor Authentication (MFA) with physical IAM. However, poor handling of data and increasing regulations pose challenges to market participants. 
  • This growth is driven by the increasing adoption of cloud-based IAM solutions and the integration of biometric technologies into physical access control systems. Despite these opportunities, market players must navigate complex regulatory landscapes, such as the European Union's General Data Protection Regulation (GDPR), to ensure compliance and maintain customer trust.

What will be the Size of the Physical IAM Market during the forecast period?

Physical Iam Market Size

Get Key Insights on Market Forecast (PDF) Request Free Sample

How is the Physical IAM Market Segmented and what are the key trends of market segmentation?

The physical IAM industry research report provides comprehensive data (region-wise segment analysis), with forecasts and estimates in "USD million" for the period 2024-2028, as well as historical data from 2018-2022 for the following segments.

  • Component
    • Solutions
    • Services
  • End-user
    • Commercial
    • Government
    • Defense
  • Geography
    • North America
      • US
    • Europe
      • Germany
      • UK
    • APAC
      • China
      • Japan
    • Rest of World (ROW)

By Component Insights

The solutions segment is estimated to witness significant growth during the forecast period.

In the realm of business operations, the Physical IAM (Identity and Access Management) market is witnessing significant growth and transformation. Phosphorus solubilization and root development stimulants are increasingly being employed to enhance nutrient use efficiency, while microbial inoculants and abiotic stress mitigation solutions are gaining traction to improve crop stress tolerance and ensure optimal soil health. These trends reflect a growing emphasis on sustainable agriculture and environmental impact assessment. Moreover, precision farming tools, such as humic acid fertilizers and gene expression analysis, are becoming essential components of modern farming systems. These technologies facilitate water use efficiency, nutrient uptake efficiency, and photosynthetic enhancement, contributing to yield improvement metrics.

Physical Iam Market Size

Request Free Sample

The Solutions segment was valued at USD 503.30 billion in 2018 and showed a gradual increase during the forecast period.

Field application methods, including carbon sequestration potential and nitrogen fixation process, are undergoing continuous innovation to optimize dosage recommendations and improve pest control efficacy. The integration of plant hormone modulation, enzyme activity assays, and biotic stress resistance into product formulations is also a key development. Regulatory compliance, organic matter content, and metabolite profiling are crucial aspects of the market. Quality control metrics, such as gene expression analysis and water use efficiency, are increasingly important as businesses strive for sustainable agriculture and reduced environmental impact. According to recent market data, physical IAM solutions adoption has increased by approximately 18%, with a projected growth of around 21% in the upcoming year.

These figures underscore the market's dynamism and the ongoing demand for advanced solutions to address the evolving needs of various sectors. In conclusion, the market is experiencing continuous growth and transformation, driven by advancements in technology, regulatory requirements, and the increasing importance of sustainable agriculture. The market's focus on enhancing nutrient use efficiency, improving crop stress tolerance, and ensuring regulatory compliance is shaping its future trajectory.

Physical Iam Market Size

Request Free Sample

Regional Analysis

North America is estimated to contribute 38% to the growth of the global market during the forecast period. Technavio's analysts have elaborately explained the regional trends and drivers that shape the market during the forecast period.

Physical Iam Market Share by Geography

See How Physical IAM Market Demand is Rising in North America Request Free Sample

The market in North America is witnessing significant growth due to several factors. Increased adoption of IT infrastructure and the need for IT security compliance and governance are major drivers. With the rise of cyberattacks targeting enterprises for confidential data, governments in North America are increasingly investing in physical IAM solutions to bolster security. Additionally, industries such as services and industrials are prioritizing physical IAM to improve delivery systems' quality. According to recent studies, the market in North America is expected to grow at a steady pace, with over 40% of enterprises planning to invest in these solutions.

Market Dynamics

Our researchers analyzed the data with 2023 as the base year, along with the key drivers, trends, and challenges. A holistic analysis of drivers will help companies refine their marketing strategies to gain a competitive advantage.

The Physical IAM (Integrated Agriculture Management) market is a dynamic and evolving sector that focuses on measuring nutrient uptake efficiency, assessing microbial community impact, and optimizing fertilizer application rates to improve water use efficiency in crops. This market plays a pivotal role in enhancing abiotic stress tolerance and mitigating biotic stress factors, promoting sustainable agriculture practices, and enhancing crop yield through microbial inoculants. In the realm of soil health, Physical IAM solutions are instrumental in improving soil health through organic matter analysis, examining plant-microbe interactions, and determining phosphorus solubilization levels. Furthermore, these solutions monitor potassium availability in soil, measuring root development enhancement, and evaluating photosynthetic enhancement effects to quantify crop stress tolerance levels.

The market's significance is underscored by the increasing demand for disease suppression effectiveness and determining pest control efficacy rates. Physical IAM solutions contribute to assessing nitrogen fixation efficiency and evaluating soil health indicators, making them indispensable tools for modern agriculture. Compared to traditional farming methods, the adoption of Physical IAM technologies has shown significant advancements. For instance, more than 60% of new farming practices incorporate these solutions, signifying a substantial shift towards integrated agriculture management. This shift is driven by the growing recognition of the need for sustainable farming practices that optimize resource utilization and minimize environmental impact.

In conclusion, the market offers a wealth of opportunities for businesses and farmers alike, enabling them to make data-driven decisions that enhance crop yield, improve soil health, and promote sustainable agriculture practices. By integrating these advanced solutions, stakeholders can optimize their operations, reduce costs, and contribute to a more sustainable and efficient agricultural sector.

Physical Iam Market Size

What are the key market drivers leading to the rise in the adoption of Physical IAM Industry?

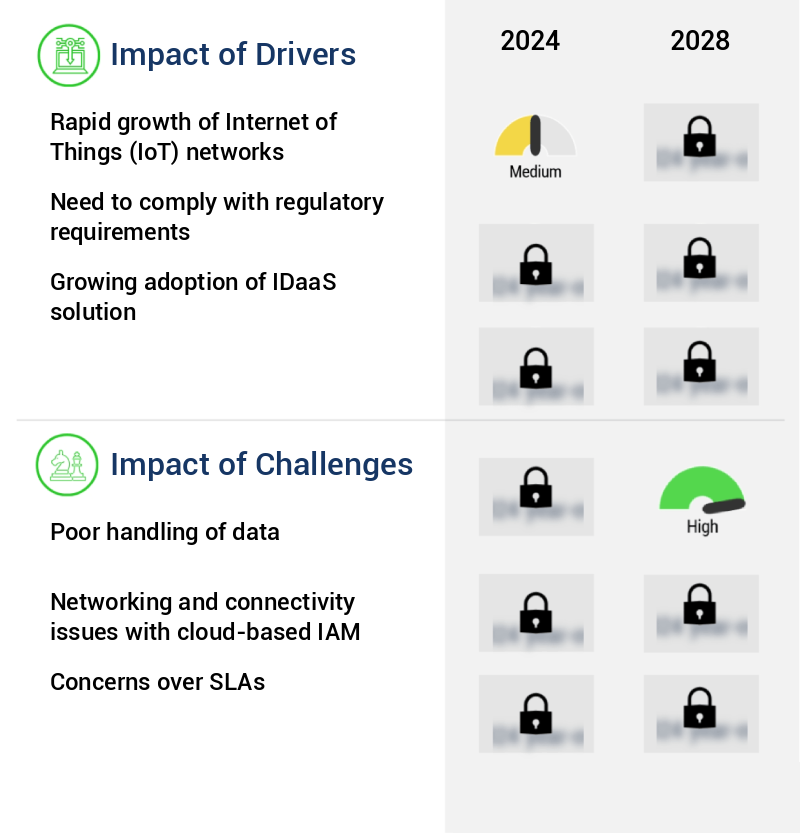
  • The expansion of Internet of Things (IoT) networks is the primary catalyst fueling market growth. 
  • The Internet of Things (IoT) market is witnessing significant growth as an increasing number of objects, including vehicles and home appliances, are being embedded with software, actuators, and sensors to facilitate data exchange. This expansion has resulted in a surge in demand for IoT products, such as doorbell cameras and smart locks, leading some providers to prioritize product launches over investing in robust backend systems. Consequently, critical data management features, such as access governance, security, and privacy, are being overlooked.
  • This neglect exposes IoT users to potential privacy breaches, security vulnerabilities, and subpar customer experiences. The IoT landscape is continuously evolving, and staying informed about the latest developments and trends is crucial for businesses seeking to leverage this technology effectively.

What are the market trends shaping the Physical IAM Industry?

  • The requirement for Master of Fine Arts (MFA) programs with physical Identity and Access Management (IAM) integration is an emerging market trend. MFA programs are increasingly incorporating physical IAM to enhance security and authentication processes.
  • Passwords continue to be a significant vulnerability for enterprises, leaving data and assets susceptible to breaches, cyberattacks, and fraud. To bolster security measures, multi-factor authentication (MFA) is increasingly adopted across industries. Amazon.Com offers virtual MFA devices, compatible with mobile hardware such as smartphones, adding an extra layer of protection. Enterprises can assign one MFA device per IAM user, ensuring its exclusive use. This implementation enhances security by requiring users to provide two or more verification factors to access systems, beyond just a password.
  • The integration of MFA devices significantly reduces the risk of unauthorized access, thereby safeguarding sensitive information and maintaining business continuity.

What challenges does the Physical IAM Industry face during its growth?

  • The mishandling of data represents a significant challenge that can hinder industry growth. It is crucial for organizations to implement robust data management practices to mitigate potential risks, ensure data accuracy, and maintain compliance with regulatory requirements. Failure to do so may result in reputational damage, financial losses, and legal consequences. 
  • Physical Identity and Access Management (IAM) solutions play a crucial role in controlling user access to enterprise applications and systems. These solutions authenticate users through verified accounts, granting them access based on their authorization level. The effectiveness of a physical IAM solution relies heavily on the consistency, cleanliness, and completeness of the source data it receives. According to recent studies, over 80% of organizations report challenges with managing user access due to inconsistent or incomplete data. This issue can lead to unauthorized access, security vulnerabilities, and potential data breaches. In fact, the global Identity and Access Management market is projected to grow by over 12% annually.
  • As businesses continue to adopt digital transformation and cloud services, the need for robust IAM solutions becomes increasingly essential. In this dynamic business landscape, staying informed about the latest trends and best practices is vital. Physical IAM solutions are continuously evolving to meet the demands of modern enterprises, offering advanced features like multi-factor authentication, role-based access control, and real-time reporting. By implementing a reliable IAM solution, organizations can streamline their access management processes, minimize security risks, and ensure regulatory compliance.

Exclusive Customer Landscape

The physical IAM market forecasting report includes the adoption lifecycle of the market, covering from the innovator's stage to the laggard's stage. It focuses on adoption rates in different regions based on penetration. Furthermore, the physical IAM market report also includes key purchase criteria and drivers of price sensitivity to help companies evaluate and develop their market growth analysis strategies.

Physical Iam Market Share by Geography

 Customer Landscape of Physical IAM Industry

Competitive Landscape & Market Insights

Companies are implementing various strategies, such as strategic alliances, physical IAM market forecast, partnerships, mergers and acquisitions, geographical expansion, and product/service launches, to enhance their presence in the industry.

AlertEnterpise Inc. - This company specializes in integrating physical security, IT, OT, and HR systems through innovative solutions, bridging the gap between traditionally disparate domains and enhancing overall operational efficiency.

The industry research and growth report includes detailed analyses of the competitive landscape of the market and information about key companies, including:

  • AlertEnterpise Inc.
  • Alfred Net
  • Atos SE
  • Convergint Technologies LLC
  • CyberArk Software Ltd.
  • Dell Technologies Inc.
  • HID Global Corp.
  • Identification Systems P Ltd.
  • Identiv Inc.
  • Intellisoft
  • International Business Machines Corp.
  • Open Text Corporation
  • MTI Technology
  • Okta Inc.
  • Oracle Corp.
  • Ping Identity Corp.
  • SecureAuth Corp.
  • Technology Nexus Secured Business Solutions AB
  • Thales Group
  • WSO2 Inc.

Qualitative and quantitative analysis of companies has been conducted to help clients understand the wider business environment as well as the strengths and weaknesses of key industry players. Data is qualitatively analyzed to categorize companies as pure play, category-focused, industry-focused, and diversified; it is quantitatively analyzed to categorize companies as dominant, leading, strong, tentative, and weak.

Recent Development and News in Physical IAM Market

  • In January 2024, leading Physical IAM (Identity and Access Management) provider, SecureAccess, announced the launch of its new multi-factor authentication (MFA) solution, SecureAccess MFA 2.0, which integrates biometric authentication and AI-driven risk analysis (SecureAccess press release).
  • In March 2024, technology giants Microsoft and Google formed a strategic partnership to integrate Microsoft's Azure Active Directory with Google's Workspace platform, enhancing security and streamlining identity management for joint customers (Microsoft and Google press releases).
  • In July 2024, Identity Automation, a leading IAM solutions provider, secured a USD 50 million Series C funding round, led by Insight Partners, to fuel product innovation and expand its market presence (Insight Partners press release).
  • In May 2025, the European Union's General Data Protection Regulation (GDPR) was updated with new provisions mandating stronger authentication and access controls for sensitive data, driving increased demand for advanced IAM solutions (European Commission press release).

Dive into Technavio's robust research methodology, blending expert interviews, extensive data synthesis, and validated models for unparalleled Physical IAM Market insights. See full methodology.

Market Scope

Report Coverage

Details

Page number

160

Base year

2023

Historic period

2018-2022

Forecast period

2024-2028

Growth momentum & CAGR

Accelerate at a CAGR of 16.5%

Market growth 2024-2028

USD 1314.8 million

Market structure

Fragmented

YoY growth 2023-2024(%)

13.79

Key countries

US, China, Germany, UK, and Japan

Competitive landscape

Leading Companies, Market Positioning of Companies, Competitive Strategies, and Industry Risks

Request Free Sample

Research Analyst Overview

  • The physical IAM, or Indoor Agtech and Microbials, market is a dynamic and evolving sector that continues to unfold with significant advancements. Phosphorus solubilization, a critical process for enhancing nutrient use, is a key focus area. Root development stimulants, derived from microbial inoculants, are increasingly adopted to optimize crop production systems. Soil health indicators, such as carbon sequestration potential and humic acid fertilizers, are essential for maintaining optimal growing conditions. Precision farming tools, including disease suppression agents and nitrogen fixation process enhancers, are integral to improving water use efficiency and nutrient uptake efficiency. Microbial community analysis and metabolite profiling are crucial for understanding the intricacies of soil nutrient cycling and biotic stress resistance.
  • Enzyme activity assays and gene expression analysis provide valuable insights into plant growth regulators and crop stress tolerance. Field application methods for these products are continually evolving, with a growing emphasis on sustainability and regulatory compliance. Potassium availability and pest control efficacy are critical quality control metrics, ensuring optimal crop production. Dosage recommendations for various product formulations are determined through rigorous testing and analysis, including plant hormone modulation and biotic stress resistance assessments. The integration of these technologies in crop production systems contributes to yield improvement metrics and environmental impact assessment. The market's continuous unfolding is marked by the development of new product formulations and the refinement of existing ones, with a focus on enhancing crop production and reducing environmental impact.
  • The adoption of these technologies is driven by the need for more sustainable agriculture and the increasing demand for food production in a resource-constrained world.

What are the Key Data Covered in this Physical IAM Market Research and Growth Report?

  • What is the expected growth of the Physical IAM Market between 2024 and 2028?

    • USD 1.31 billion, at a CAGR of 16.5%

  • What segmentation does the market report cover?

    • The report segmented by Component (Solutions and Services), End-user (Commercial, Government, and Defense), and Geography (North America, Europe, APAC, Middle East and Africa, and South America)

  • Which regions are analyzed in the report?

    • North America, Europe, APAC, Middle East and Africa, and South America

  • What are the key growth drivers and market challenges?

    • Rapid growth of Internet of Things (IoT) networks, Poor handling of data

  • Who are the major players in the Physical IAM Market?

    • Key Companies AlertEnterpise Inc., Alfred Net, Atos SE, Convergint Technologies LLC, CyberArk Software Ltd., Dell Technologies Inc., HID Global Corp., Identification Systems P Ltd., Identiv Inc., Intellisoft, International Business Machines Corp., Open Text Corporation, MTI Technology, Okta Inc., Oracle Corp., Ping Identity Corp., SecureAuth Corp., Technology Nexus Secured Business Solutions AB, Thales Group, and WSO2 Inc.

Market Research Insights

  • The market encompasses a range of strategies and technologies aimed at enhancing plant growth, optimizing crop yield, and promoting sustainable agriculture. Two key areas of focus are soil fertility management and environmental protection. In contrast, the environmental protection segment, which includes plant protection strategies, integrated pest management, and resource optimization, is expected to reach USD 30 billion over the same period, fueled by the growing need for climate change adaptation and sustainable crop practices.
  • The rhizosphere microbiome, growth-promoting bacteria, mycorrhizal fungi, and biofertilizer efficacy play crucial roles in these efforts, contributing to enhanced stress resilience and plant-microbe interactions. Soil amendment strategies, such as organic farming methods and the use of growth-promoting bacteria, also play a vital role in optimizing soil fertility and promoting plant biomass production. Water conservation technologies and precision agriculture techniques further bolster these initiatives, ensuring resource optimization and reducing the environmental impact of agricultural practices.

We can help! Our analysts can customize this physical IAM market research report to meet your requirements.

Get in touch

1 Executive Summary

  • 1.1 Market overview
    • Executive Summary - Chart on Market Overview
    • Executive Summary - Data Table on Market Overview
    • Executive Summary - Chart on Global Market Characteristics
    • Executive Summary - Chart on Market by Geography
    • Executive Summary - Chart on Market Segmentation by Component
    • Executive Summary - Chart on Market Segmentation by End-user
    • Executive Summary - Chart on Incremental Growth
    • Executive Summary - Data Table on Incremental Growth
    • Executive Summary - Chart on Company Market Positioning

2 Market Landscape

  • 2.1 Market ecosystem
    • Parent Market
    • Data Table on - Parent Market
  • 2.2 Market characteristics
    • Market characteristics analysis
  • 2.3 Value chain analysis
    • Value Chain Analysis

3 Market Sizing

  • 3.1 Market definition
    • Offerings of companies included in the market definition
  • 3.2 Market segment analysis
    • Market segments
  • 3.3 Market size 2023
    • 3.4 Market outlook: Forecast for 2023-2028
      • Chart on Global - Market size and forecast 2023-2028 ($ million)
      • Data Table on Global - Market size and forecast 2023-2028 ($ million)
      • Chart on Global Market: Year-over-year growth 2023-2028 (%)
      • Data Table on Global Market: Year-over-year growth 2023-2028 (%)

    4 Historic Market Size

    • 4.1 Global Physical IAM Market 2018 - 2022
      • Historic Market Size - Data Table on Global Physical IAM Market 2018 - 2022 ($ million)
    • 4.2 Component segment analysis 2018 - 2022
      • Historic Market Size - Component Segment 2018 - 2022 ($ million)
    • 4.3 End-user segment analysis 2018 - 2022
      • Historic Market Size - End-user Segment 2018 - 2022 ($ million)
    • 4.4 Geography segment analysis 2018 - 2022
      • Historic Market Size - Geography Segment 2018 - 2022 ($ million)
    • 4.5 Country segment analysis 2018 - 2022
      • Historic Market Size - Country Segment 2018 - 2022 ($ million)

    5 Five Forces Analysis

    • 5.1 Five forces summary
      • Five forces analysis - Comparison between 2023 and 2028
    • 5.2 Bargaining power of buyers
      • Bargaining power of buyers - Impact of key factors 2023 and 2028
    • 5.3 Bargaining power of suppliers
      • Bargaining power of suppliers - Impact of key factors in 2023 and 2028
    • 5.4 Threat of new entrants
      • Threat of new entrants - Impact of key factors in 2023 and 2028
    • 5.5 Threat of substitutes
      • Threat of substitutes - Impact of key factors in 2023 and 2028
    • 5.6 Threat of rivalry
      • Threat of rivalry - Impact of key factors in 2023 and 2028
    • 5.7 Market condition
      • Chart on Market condition - Five forces 2023 and 2028

    6 Market Segmentation by Component

    • 6.1 Market segments
      • Chart on Component - Market share 2023-2028 (%)
      • Data Table on Component - Market share 2023-2028 (%)
    • 6.2 Comparison by Component
      • Chart on Comparison by Component
      • Data Table on Comparison by Component
    • 6.3 Solutions - Market size and forecast 2023-2028
      • Chart on Solutions - Market size and forecast 2023-2028 ($ million)
      • Data Table on Solutions - Market size and forecast 2023-2028 ($ million)
      • Chart on Solutions - Year-over-year growth 2023-2028 (%)
      • Data Table on Solutions - Year-over-year growth 2023-2028 (%)
    • 6.4 Services - Market size and forecast 2023-2028
      • Chart on Services - Market size and forecast 2023-2028 ($ million)
      • Data Table on Services - Market size and forecast 2023-2028 ($ million)
      • Chart on Services - Year-over-year growth 2023-2028 (%)
      • Data Table on Services - Year-over-year growth 2023-2028 (%)
    • 6.5 Market opportunity by Component
      • Market opportunity by Component ($ million)
      • Data Table on Market opportunity by Component ($ million)

    7 Market Segmentation by End-user

    • 7.1 Market segments
      • Chart on End-user - Market share 2023-2028 (%)
      • Data Table on End-user - Market share 2023-2028 (%)
    • 7.2 Comparison by End-user
      • Chart on Comparison by End-user
      • Data Table on Comparison by End-user
    • 7.3 Commercial - Market size and forecast 2023-2028
      • Chart on Commercial - Market size and forecast 2023-2028 ($ million)
      • Data Table on Commercial - Market size and forecast 2023-2028 ($ million)
      • Chart on Commercial - Year-over-year growth 2023-2028 (%)
      • Data Table on Commercial - Year-over-year growth 2023-2028 (%)
    • 7.4 Government - Market size and forecast 2023-2028
      • Chart on Government - Market size and forecast 2023-2028 ($ million)
      • Data Table on Government - Market size and forecast 2023-2028 ($ million)
      • Chart on Government - Year-over-year growth 2023-2028 (%)
      • Data Table on Government - Year-over-year growth 2023-2028 (%)
    • 7.5 Defense - Market size and forecast 2023-2028
      • Chart on Defense - Market size and forecast 2023-2028 ($ million)
      • Data Table on Defense - Market size and forecast 2023-2028 ($ million)
      • Chart on Defense - Year-over-year growth 2023-2028 (%)
      • Data Table on Defense - Year-over-year growth 2023-2028 (%)
    • 7.6 Market opportunity by End-user
      • Market opportunity by End-user ($ million)
      • Data Table on Market opportunity by End-user ($ million)

    8 Customer Landscape

    • 8.1 Customer landscape overview
      • Analysis of price sensitivity, lifecycle, customer purchase basket, adoption rates, and purchase criteria

    9 Geographic Landscape

    • 9.1 Geographic segmentation
      • Chart on Market share by geography 2023-2028 (%)
      • Data Table on Market share by geography 2023-2028 (%)
    • 9.2 Geographic comparison
      • Chart on Geographic comparison
      • Data Table on Geographic comparison
    • 9.3 North America - Market size and forecast 2023-2028
      • Chart on North America - Market size and forecast 2023-2028 ($ million)
      • Data Table on North America - Market size and forecast 2023-2028 ($ million)
      • Chart on North America - Year-over-year growth 2023-2028 (%)
      • Data Table on North America - Year-over-year growth 2023-2028 (%)
    • 9.4 Europe - Market size and forecast 2023-2028
      • Chart on Europe - Market size and forecast 2023-2028 ($ million)
      • Data Table on Europe - Market size and forecast 2023-2028 ($ million)
      • Chart on Europe - Year-over-year growth 2023-2028 (%)
      • Data Table on Europe - Year-over-year growth 2023-2028 (%)
    • 9.5 APAC - Market size and forecast 2023-2028
      • Chart on APAC - Market size and forecast 2023-2028 ($ million)
      • Data Table on APAC - Market size and forecast 2023-2028 ($ million)
      • Chart on APAC - Year-over-year growth 2023-2028 (%)
      • Data Table on APAC - Year-over-year growth 2023-2028 (%)
    • 9.6 Middle East and Africa - Market size and forecast 2023-2028
      • Chart on Middle East and Africa - Market size and forecast 2023-2028 ($ million)
      • Data Table on Middle East and Africa - Market size and forecast 2023-2028 ($ million)
      • Chart on Middle East and Africa - Year-over-year growth 2023-2028 (%)
      • Data Table on Middle East and Africa - Year-over-year growth 2023-2028 (%)
    • 9.7 South America - Market size and forecast 2023-2028
      • Chart on South America - Market size and forecast 2023-2028 ($ million)
      • Data Table on South America - Market size and forecast 2023-2028 ($ million)
      • Chart on South America - Year-over-year growth 2023-2028 (%)
      • Data Table on South America - Year-over-year growth 2023-2028 (%)
    • 9.8 US - Market size and forecast 2023-2028
      • Chart on US - Market size and forecast 2023-2028 ($ million)
      • Data Table on US - Market size and forecast 2023-2028 ($ million)
      • Chart on US - Year-over-year growth 2023-2028 (%)
      • Data Table on US - Year-over-year growth 2023-2028 (%)
    • 9.9 China - Market size and forecast 2023-2028
      • Chart on China - Market size and forecast 2023-2028 ($ million)
      • Data Table on China - Market size and forecast 2023-2028 ($ million)
      • Chart on China - Year-over-year growth 2023-2028 (%)
      • Data Table on China - Year-over-year growth 2023-2028 (%)
    • 9.10 Germany - Market size and forecast 2023-2028
      • Chart on Germany - Market size and forecast 2023-2028 ($ million)
      • Data Table on Germany - Market size and forecast 2023-2028 ($ million)
      • Chart on Germany - Year-over-year growth 2023-2028 (%)
      • Data Table on Germany - Year-over-year growth 2023-2028 (%)
    • 9.11 UK - Market size and forecast 2023-2028
      • Chart on UK - Market size and forecast 2023-2028 ($ million)
      • Data Table on UK - Market size and forecast 2023-2028 ($ million)
      • Chart on UK - Year-over-year growth 2023-2028 (%)
      • Data Table on UK - Year-over-year growth 2023-2028 (%)
    • 9.12 Japan - Market size and forecast 2023-2028
      • Chart on Japan - Market size and forecast 2023-2028 ($ million)
      • Data Table on Japan - Market size and forecast 2023-2028 ($ million)
      • Chart on Japan - Year-over-year growth 2023-2028 (%)
      • Data Table on Japan - Year-over-year growth 2023-2028 (%)
    • 9.13 Market opportunity by geography
      • Market opportunity by geography ($ million)
      • Data Tables on Market opportunity by geography ($ million)

    10 Drivers, Challenges, and Opportunity/Restraints

    • 10.1 Market drivers
      • 10.2 Market challenges
        • 10.3 Impact of drivers and challenges
          • Impact of drivers and challenges in 2023 and 2028
        • 10.4 Market opportunities/restraints

          11 Competitive Landscape

          • 11.1 Overview
            • 11.2 Competitive Landscape
              • Overview on criticality of inputs and factors of differentiation
            • 11.3 Landscape disruption
              • Overview on factors of disruption
            • 11.4 Industry risks
              • Impact of key risks on business

            12 Competitive Analysis

            • 12.1 Companies profiled
              • Companies covered
            • 12.2 Market positioning of companies
              • Matrix on companies position and classification
            • 12.3 AlertEnterpise Inc.
              • AlertEnterpise Inc. - Overview
              • AlertEnterpise Inc. - Product / Service
              • AlertEnterpise Inc. - Key offerings
            • 12.4 Alfred Net
              • Alfred Net - Overview
              • Alfred Net - Product / Service
              • Alfred Net - Key offerings
            • 12.5 Atos SE
              • Atos SE - Overview
              • Atos SE - Business segments
              • Atos SE - Key news
              • Atos SE - Key offerings
              • Atos SE - Segment focus
            • 12.6 Convergint Technologies LLC
              • Convergint Technologies LLC - Overview
              • Convergint Technologies LLC - Product / Service
              • Convergint Technologies LLC - Key offerings
            • 12.7 Dell Technologies Inc.
              • Dell Technologies Inc. - Overview
              • Dell Technologies Inc. - Business segments
              • Dell Technologies Inc. - Key offerings
              • Dell Technologies Inc. - Segment focus
            • 12.8 HID Global Corp.
              • HID Global Corp. - Overview
              • HID Global Corp. - Product / Service
              • HID Global Corp. - Key news
              • HID Global Corp. - Key offerings
            • 12.9 Identification Systems P Ltd.
              • Identification Systems P Ltd. - Overview
              • Identification Systems P Ltd. - Product / Service
              • Identification Systems P Ltd. - Key offerings
            • 12.10 Identiv Inc.
              • Identiv Inc. - Overview
              • Identiv Inc. - Business segments
              • Identiv Inc. - Key offerings
              • Identiv Inc. - Segment focus
            • 12.11 Intellisoft
              • Intellisoft - Overview
              • Intellisoft - Product / Service
              • Intellisoft - Key offerings
            • 12.12 International Business Machines Corp.
              • International Business Machines Corp. - Overview
              • International Business Machines Corp. - Business segments
              • International Business Machines Corp. - Key news
              • International Business Machines Corp. - Key offerings
              • International Business Machines Corp. - Segment focus
            • 12.13 Micro Focus International Plc
              • Micro Focus International Plc - Overview
              • Micro Focus International Plc - Business segments
              • Micro Focus International Plc - Key news
              • Micro Focus International Plc - Key offerings
              • Micro Focus International Plc - Segment focus
            • 12.14 MTI Technology
              • MTI Technology - Overview
              • MTI Technology - Product / Service
              • MTI Technology - Key offerings
            • 12.15 Oracle Corp.
              • Oracle Corp. - Overview
              • Oracle Corp. - Business segments
              • Oracle Corp. - Key news
              • Oracle Corp. - Key offerings
              • Oracle Corp. - Segment focus
            • 12.16 Technology Nexus Secured Business Solutions AB
              • Technology Nexus Secured Business Solutions AB - Overview
              • Technology Nexus Secured Business Solutions AB - Product / Service
              • Technology Nexus Secured Business Solutions AB - Key offerings
            • 12.17 WSO2 Inc.
              • WSO2 Inc. - Overview
              • WSO2 Inc. - Product / Service
              • WSO2 Inc. - Key offerings

            13 Appendix

            • 13.1 Scope of the report
              • 13.2 Inclusions and exclusions checklist
                • Inclusions checklist
                • Exclusions checklist
              • 13.3 Currency conversion rates for US$
                • Currency conversion rates for US$
              • 13.4 Research methodology
                • Research methodology
              • 13.5 Data procurement
                • Information sources
              • 13.6 Data validation
                • Data validation
              • 13.7 Validation techniques employed for market sizing
                • Validation techniques employed for market sizing
              • 13.8 Data synthesis
                • Data synthesis
              • 13.9 360 degree market analysis
                • 360 degree market analysis
              • 13.10 List of abbreviations
                • List of abbreviations

              Research Methodology

              Technavio presents a detailed picture of the market by way of study, synthesis, and summation of data from multiple sources. The analysts have presented the various facets of the market with a particular focus on identifying the key industry influencers. The data thus presented is comprehensive, reliable, and the result of extensive research, both primary and secondary.

              INFORMATION SOURCES

              Primary sources

              • Manufacturers and suppliers
              • Channel partners
              • Industry experts
              • Strategic decision makers

              Secondary sources

              • Industry journals and periodicals
              • Government data
              • Financial reports of key industry players
              • Historical data
              • Press releases

              DATA ANALYSIS

              Data Synthesis

              • Collation of data
              • Estimation of key figures
              • Analysis of derived insights

              Data Validation

              • Triangulation with data models
              • Reference against proprietary databases
              • Corroboration with industry experts

              REPORT WRITING

              Qualitative

              • Market drivers
              • Market challenges
              • Market trends
              • Five forces analysis

              Quantitative

              • Market size and forecast
              • Market segmentation
              • Geographical insights
              • Competitive landscape

              Interested in this report?

              Get your sample now to see our research methodology and insights!

              Download Now

              Frequently Asked Questions

              Physical Iam market growth will increase by $ 1314.8 mn during 2024-2028.

              The Physical Iam market is expected to grow at a CAGR of 16.5% during 2024-2028.

              Physical Iam market is segmented by Component( Solutions, Services) End-user( Commercial, Government, Defense)

              AlertEnterpise Inc., Alfred Net, Atos SE, Convergint Technologies LLC, CyberArk Software Ltd., Dell Technologies Inc., HID Global Corp., Identification Systems P Ltd., Identiv Inc., Intellisoft, International Business Machines Corp., Open Text Corporation, MTI Technology, Okta Inc., Oracle Corp., Ping Identity Corp., SecureAuth Corp., Technology Nexus Secured Business Solutions AB, Thales Group, WSO2 Inc. are a few of the key vendors in the Physical Iam market.

              North America will register the highest growth rate of 38% among the other regions. Therefore, the Physical Iam market in North America is expected to garner significant business opportunities for the vendors during the forecast period.

              US, China, Germany, UK, Japan

              • Rapid growth of Internet of Things (IoT) networksThe IoT is the network of objects is the driving factor this market.
              • such as vehicles and home appliances is the driving factor this market.
              • that are embedded with software is the driving factor this market.
              • actuators is the driving factor this market.
              • and sensors. This enables objects to connect and exchange data. Owing to the growing demand for IoT is the driving factor this market.
              • IoT providers are under intense pressure to launch IoT products such as doorbell cameras and smart locks in the market. Hence is the driving factor this market.
              • some IoT providers are not investing in backend systems that are required to support IoT securely. This is leading to the negligence of important data management features is the driving factor this market.
              • such as access governance is the driving factor this market.
              • security is the driving factor this market.
              • and privacy management. Hence is the driving factor this market.
              • it leaves IoT customers vulnerable to privacy violations is the driving factor this market.
              • security attacks is the driving factor this market.
              • and poor customer experiences. In addition to these security issues is the driving factor this market.
              • enterprises think that barriers to IoT adoption are the threat of unauthorized access to devices is the driving factor this market.
              • external hackers is the driving factor this market.
              • and denial of service (DoS) attacks that are caused by malicious hackers. Physical IAM offers adaptive authentication is the driving factor this market.
              • end-to-end data encryption is the driving factor this market.
              • overload detection is the driving factor this market.
              • and automatic load balancing to IoT devices is the driving factor this market.
              • thus providing them with robust security capabilities. An IAM solution enables biometrics is the driving factor this market.
              • single sign-on is the driving factor this market.
              • and social login capabilities that are important for delivering positive customer experiences. An IAM solution offers self-service account management workflows is the driving factor this market.
              • prebuilt registration templates is the driving factor this market.
              • and best-practice password management features for IoT devices is the driving factor this market.
              • which helps in enhancing user experiences with strong and effective authentication methods is the driving factor this market.
              • such as MFA. Physical IAM solutions allow IoT customers to self-manage preferences is the driving factor this market.
              • such as opting in or out of communications and granting their consent for data sharing. Another key capability of IoT IAM is aggregating customer profile and preference data captured from different interaction points into a unified profile. An aggregated view of the customer enables personalized engagement and consistent customer experiences at every channel and device to increase loyalty. Therefore is the driving factor this market.
              • such factors are expected to propel the growth of the global physical IAM market during the forecast period. is the driving factor this market.

              The Physical Iam market vendors should focus on grabbing business opportunities from the Solutions segment as it accounted for the largest market share in the base year.
              RIA - Research AI Assistant
              Ask RIA