Plant-based Water Market Analysis North America, APAC, Europe, South America, Middle East and Africa - US, Indonesia, India, UK, France - Size and Forecast 2024-2028

Plant-based Water Market Analysis North America, APAC, Europe, South America, Middle East and Africa - US, Indonesia, India, UK, France - Size and Forecast 2024-2028

Published: Oct 2023 164 Pages SKU: IRTNTR73018

Market Overview at a Glance

$12.76 B
Market Opportunity
19.64%
CAGR
18.86
YoY growth 2023-2024(%)

Plant-based Water Market Size 2024-2028

The plant-based water market size is projected to increase by USD 12.76 billion and the market size is estimated to grow at a CAGR of 19.64% between 2023 and 2028.  The plant-based water market is experiencing significant growth, with numerous new product launches and marketing initiatives aimed at promoting these eco-friendly beverages. Companies are introducing innovative plant-based water options, such as coconut water, aloe vera water, and maple water, to cater to diverse consumer preferences. Marketing strategies include partnerships with health and wellness influencers, sponsorship of fitness events, and educational campaigns highlighting the environmental benefits of plant-based water. Packaging innovations, such as biodegradable bottles and eco-friendly labels, further enhance the appeal of these products to environmentally conscious consumers. In summary, the plant-based water market is thriving, with new product launches, strategic marketing initiatives, and packaging innovations driving growth and consumer interest.

Market Overview

Plant-based Water Market Size

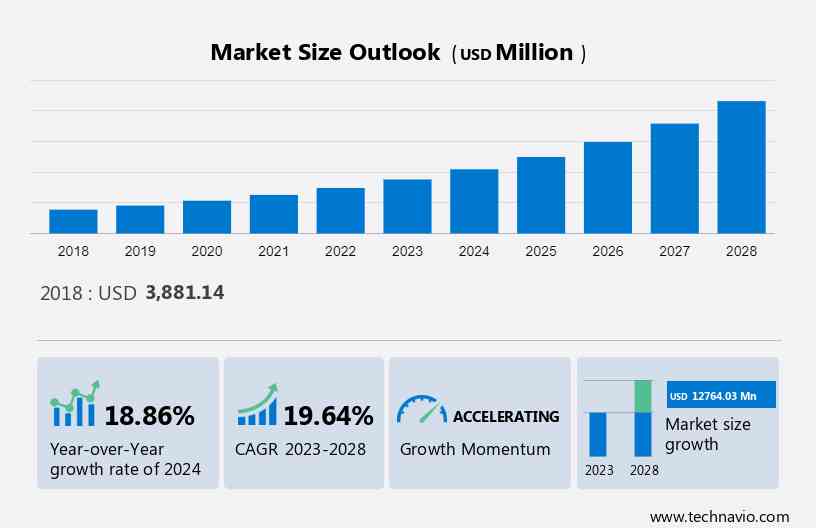
The market shows an accelerated CAGR during the forecast period.

To get additional information about the market, Request Free Sample

Market Segmentation

By Product Type

The increasing awareness of the health benefits of the coconut water segment will increase the market growth. There is a rise in awareness of the high nutritional content of coconut products in countries such as the US, the UK, France, and Germany which is fuelling the growth of this segment. In addition, the demand for flavored coconut water is increasing at a high rate when compared to plain coconut water as consumers within the region often look for healthy and nutrient-rich beverages that have a refreshing taste. As a result, several players are blending coconut water with different flavors such as mango, passion fruit, chocolate, pomegranate, and others to make it a better-for-you beverage for consumers. Furthermore, players are trying to position coconut water as a functional beverage and raise overall awareness of its nutritional benefit among sportsmen and athletes to help grow its consumer base. Hence, such factors are fuelling the growth of this segment which in turn will drive the market growth during the forecast period.

By Distribution Channel

The offline segment is estimated to witness significant growth during the forecast period. This segment comprises supermarkets and hypermarkets, convenience stores, independent retailers, and specialty stores. In addition, supermarkets and hypermarkets have emerged as the most popular distribution channels for products, which is primarily attributed to the growth of the organized retail sector in developed and developing economies.

Plant-based Water Market Size

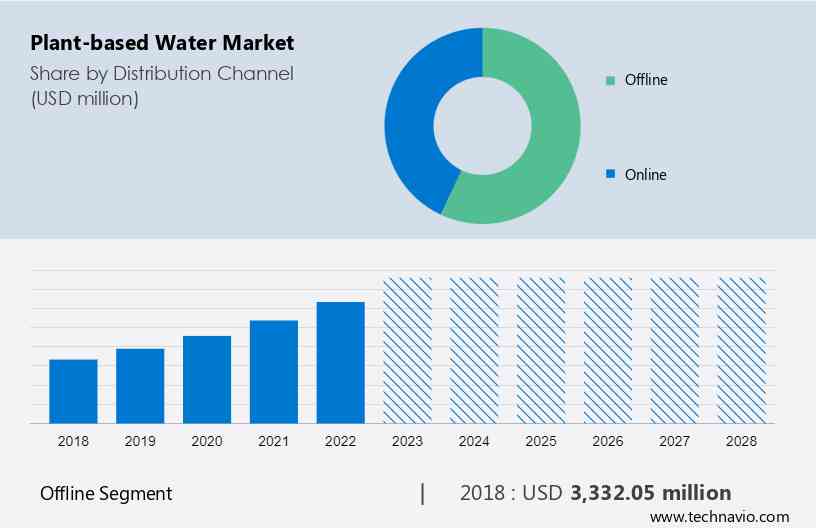
The offline segment was the largest segment and was valued at USD 3.33 billion in 2018.

For a detailed summary of the market segments Request for Sample Report

Moreover, some of the main factors that are fuelling the sales in this segment include the growing retail industry and the setting up of numerous new retail outlets. In addition, this segment offers consumers a wide range of products to choose from and provides them with the convenience of finding everything under a single roof. Furthermore, factors including discounted prices and a pleasant shopping experience due to the ambient store atmosphere and shelf displays are influencing consumers to buy from supermarkets and hypermarkets. Hence, such factors are fuelling the growth of this segment which in turn will drive the market growth during the forecast period.

Key Regions

Plant-based Water Market Share by Geography

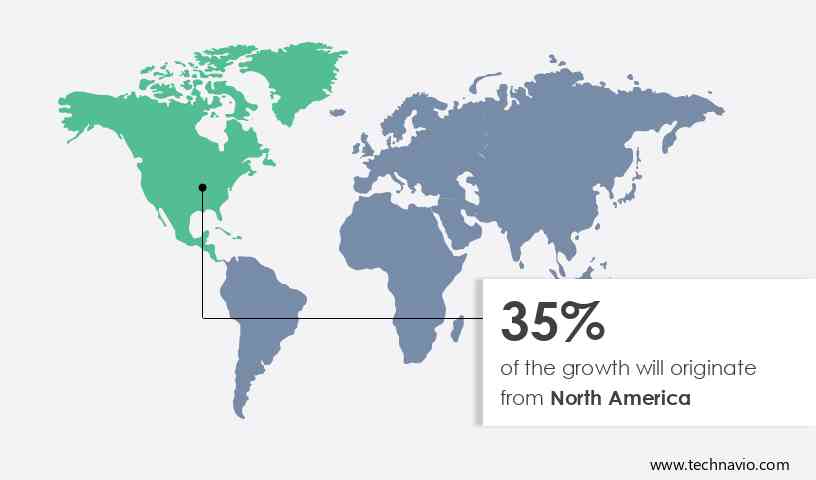
North America is estimated to contribute 35% to the growth of the global market during the forecast period

Get a glance at the market share of various regions View PDF Sample

Technavio’s analysts have elaborately explained the regional trends and drivers that shape the market during the forecast period. The growing health consciousness among consumers is fuelling the growth of the market in North America. Therefore, consumers are switching from sweetened carbonated beverages to more naturally flavored beverages. In addition, new product launches and innovative packaging are some of the factors that are also acting as growth drivers for the market. Moreover, several players are currently focusing on flavored plant-based water to attract consumers looking for a mix of both health benefits as well as flavors in their beverages. Hence, several prominent players will be experimenting with flavors within plant-based water which is positively impacting the market in the region. Hence, such factors are driving the market growth in North America during the forecast period.

Market Dynamics

In the realm of hydration, plant-based waters stand out as a refreshing and nutritious alternative, offering safe and clean water derived from natural sources. Employing water filtration techniques such as filtration, UV disinfection, and ozone treatment, these beverages ensure the purity of consumable or drinking water while catering to the needs of diverse societies. Utilizing plant stems and extracts from flora like water lilies and white pine, plant-based water filters provide an eco-friendly solution for water purification, addressing concerns such as diarrheal infections. Popular among trekkers and health-conscious individuals, plant-based waters like coconut water and aloe water offer a regular drink option enriched with nutrition and trace amounts of essential nutrients, serving as a lower sugar alternative to routine drinks.

Key Market Driver

One of the key factors driving the market growth is the marketing initiatives to promote plant-based water. Several prominent players in the global market, such as All Market Inc, Coca-Cola, DRINKmaple, and others, are adopting integrated marketing strategies including promotional campaigns through newspapers, magazines, and social media such as YouTube and Facebook to increase the popularity of their offerings. In addition,  players are launching various campaigns in different countries across the globe to enhance the growth of the categories by reminding consumers about the multiple nutritional benefits of these beverages. For instance, in September 2021, The Vita Coco Co. launched a social media and outdoor campaign, "Impossible to Hate", with the purpose of promoting and creating mass awareness of its product offerings. Hence, such factors drive the market growth during the forecast period.

Significant Market Trends

A key factor shaping the market growth is the growing popularity  in the food service sector. There is relatively low On-trade consumption of coconut water when compared to retail channel sales. In addition, the trend is expected to change as many restaurants and eateries in Western countries like the US and the UK have begun to offer packaged coconut water as a mainstream drink on their menus.

Moreover, several companies such as Starbucks Corporation have started selling in-house brands of coconut water like STARBUCKS Black Cherry Limeade Refresher with Real Coconut Water, Evolution Fresh Pineapple Coconut Water, and others. In addition, many food service chains will launch their in-house brands to entice consumers who prefer healthy beverages. Hence, such factors are positively impacting the market. Therefore, it is expected to drive the market growth during the forecast period.

Major Market Challenge 

Product recalls and product consistency issues are some of the key challenges hindering the market growth. The increasing number of product recalls due to issues such as microbial contamination at the packaging stage and poor product quality can pose a significant threat to market growth. In addition, even a single product recall issue can adversely affect a company's brand perception, which may lead to heavy monetary losses.

Moreover, some of the manufacturers have faced product recalls recently, causing consumers to be more cautious while purchasing such brands. For example, in 2015, ONE recalled its packed 11-ounce tetra-pack cartons due to the possible oxidation of the coconut water, leading to the formation of mold. Hence, such factors are negatively impacting the market. Therefore, it is expected to hinder the market growth during the forecast period.

Company Overview

Companies are implementing various strategies, such as strategic alliances, partnerships, mergers and acquisitions, geographical expansion, and product/service launches, to enhance their presence in the market.

  • Key Offering - Alibi: The company offers plant based water under the brand Alibi Health Drink which contains essential vitamins, minerals and natural herbal extracts.
  • Key Offering - AquaBotanical Water: The company offers plant based water under the brand Aqua Botanical which are extracted from fruits and vegitables.
  • Key Offering - Caliwater LLC: The company offers plant based water of different flavours such as Prickly Pear, Pineapple, watermelon and others under the brand Caliwater.

The market report also includes detailed analyses of the competitive landscape of the market and information about 20 market companies, including:

  • Danone SA
  • Drink Simple
  • DuPont de Nemours Inc.
  • Forager Project
  • Genius Juice
  • Glanbia plc
  • HappyTree Maple Water
  • Harmless Harvest Inc.
  • Maple 3
  • Nestle SA
  • Nordic Koivu Ltd.
  • Rebel Kitchen
  • Steaz
  • SunOpta Inc.
  • Tetra Pak Group
  • The Coca Cola Co.
  • The Vita Coco Co. Inc.

Qualitative and quantitative analysis of companies has been conducted to help clients understand the wider business environment as well as the strengths and weaknesses of key market players. Data is qualitatively analyzed to categorize companies as pure play, category-focused, industry-focused, and diversified; it is quantitatively analyzed to categorize companies as dominant, leading, strong, tentative, and weak.

Segment Overview

The market research report provides comprehensive data (region wise segment analysis), with forecasts and estimates in "USD Billion" for the period 2024 to 2028, as well as historical data from 2018 to 2022 for the following segments

  •  Distribution Channel Outlook
    • Offline
    • Online
  • Product Type Outlook
    • Coconut water
    • Maple water
    • Others
  • Geography Outlook
    • North America
      • The U.S.
      • Canada
    • Europe
      • The U.K.
      • Germany
      • France
      • Rest of Europe
    • APAC
      • China
      • India
    • South America
      • Chile
      • Argentina
      • Brazil
    • Middle East & Africa
      • Saudi Arabia
      • South Africa
      • Rest of the Middle East & Africa

You may also interested in below market reports:

1. Dairy Alternative Plant Milk Beverages Market: Dairy Alternative Plant Milk Beverages Market Analysis APAC, Europe, North America, South America, Middle East and Africa - China, US, Japan, Germany, UK - Size and Forecast 

2. Plant-based Meat Market: Plant-based Meat Market Analysis North America, Europe, APAC, South America, Middle East and Africa - US, UK, Germany, Italy, France - Size and Forecast 

3. Water Enhancer Market:  Water Enhancer Market Analysis North America, Europe, APAC, South America, Middle East and Africa - US, UK, China, Canada, Germany - Size and Forecast

Market Analyst Overview

The concept of plant-based water filters utilizes natural materials like plant xylem, coconuts, rice, and even yellow irises for filtration processes. Methods such as marsh plant filtration, jackfruit seed filtration, and Moringa seed purification demonstrate the diverse approaches to water purification using botanical resources. This innovation extends to aquatic plants and fruit peelings, such as banana peels, known for their ability to filter and purify water effectively.

In addition to filtration, plants like cilantro, birch, artichoke, and cactus contribute to the emergence of plant-based waters, offering trace amounts of nutrition and unique flavors while maintaining low sugar levels and calorie content. These beverages cater to various dietary needs, providing essential nutrients like sodium, potassium, calcium, and magnesium, promoting a balanced diet and supporting skin health and performance in the sports industry.

With applications in automated solutions for liquid collection and production, plant-based waters also appeal to consumers seeking flavor variants and alternatives to traditional fizzy drinks. They are rich in bioactive nutrients such as amino acids, antioxidants, phytonutrients, and fiber, beneficial for diabetics and those aiming to replenish electrolytes post-exercise. Available in online sales, retail stores, and cafes, these products meet the needs of individuals with hectic lifestyles looking for convenient yet nutritious hydration options.

Plant-based Water Market Scope

Report Coverage

Details

Page number

164

Base year

2023

Historic period

2018-2022

Forecast period

2024-2028

Growth momentum & CAGR

Accelerate at a CAGR of 19.64%

Market Growth 2024-2028

USD 12.76 billion

Market structure

Fragmented

YoY growth 2023-2024(%)

18.86

Regional analysis

North America, APAC, Europe, South America, and Middle East and Africa

Performing market contribution

North America at 35%

Key countries

US, Indonesia, India, UK, and France

Competitive landscape

Leading Companies, Market Positioning of Companies, Competitive Strategies, and Industry Risks

Key companies profiled

Alibi, AquaBotanical Water, Caliwater LLC, Danone SA, Drink Simple, DuPont de Nemours Inc., Forager Project, Genius Juice, Glanbia plc, HappyTree Maple Water, Harmless Harvest Inc., Maple 3, Nestle SA, Nordic Koivu Ltd., Rebel Kitchen, Steaz, SunOpta Inc., Tetra Pak Group, The Coca Cola Co., and The Vita Coco Co. Inc.

Market dynamics

Parent market analysis, market forecasting, Market growth inducers and obstacles, Fast-growing and slow-growing segment analysis, COVID-19 impact and recovery analysis and future consumer dynamics, and Market condition analysis for the market forecast period.

Customization purview

If our market report has not included the data that you are looking for, you can reach out to our analysts and get segments customized.

BUY NOW Full Report and Discover more

What are the Key Data Covered in this Market Forecast Report?

  • CAGR of the market during the forecast period
  • Detailed information on factors that will drive the market growth and forecasting of the market between 2024 and 2028
  • Precise estimation of the market size and its contribution to the parent market
  • Accurate predictions about upcoming market trends and analysis and changes in consumer behavior
  • Growth of the market across Europe, North America, APAC, South America, and Middle East and Africa
  • Thorough market growth analysis of the market’s competitive landscape and detailed information about companies
  • Comprehensive market analysis and report on the factors that will challenge the market research and growth of market companies

We can help! Our analysts can customize this market research report to meet your requirements. Get in touch

1 Executive Summary

  • 1.1 Market overview
    • Exhibit 01: Executive Summary – Chart on Market Overview
    • Exhibit 02: Executive Summary – Data Table on Market Overview
    • Exhibit 03: Executive Summary – Chart on Global Market Characteristics
    • Exhibit 04: Executive Summary – Chart on Market by Geography
    • Exhibit 05: Executive Summary – Chart on Market Segmentation by Distribution Channel
    • Exhibit 06: Executive Summary – Chart on Market Segmentation by Product Type
    • Exhibit 07: Executive Summary – Chart on Incremental Growth
    • Exhibit 08: Executive Summary – Data Table on Incremental Growth
    • Exhibit 09: Executive Summary – Chart on Vendor Market Positioning

2 Market Landscape

  • 2.1 Market ecosystem
    • Exhibit 10: Parent market
    • Exhibit 11: Market Characteristics

3 Market Sizing

  • 3.1 Market definition
    • Exhibit 12: Offerings of vendors included in the market definition
  • 3.2 Market segment analysis
    • Exhibit 13: Market segments
  • 3.3 Market size 2023
    • 3.4 Market outlook: Forecast for 2023-2028
      • Exhibit 14: Chart on Global - Market size and forecast 2023-2028 ($ million)
      • Exhibit 15: Data Table on Global - Market size and forecast 2023-2028 ($ million)
      • Exhibit 16: Chart on Global Market: Year-over-year growth 2023-2028 (%)
      • Exhibit 17: Data Table on Global Market: Year-over-year growth 2023-2028 (%)

    4 Historic Market Size

    • 4.1 Global plant-based water market 2018 - 2022
      • Exhibit 18: Historic Market Size – Data Table on global plant-based water market 2018 - 2022 ($ million)
    • 4.2 Distribution channel Segment Analysis 2018 - 2022
      • Exhibit 19: Historic Market Size – Distribution channel Segment 2018 - 2022 ($ million)
    • 4.3 Product Type Segment Analysis 2018 - 2022
      • Exhibit 20: Historic Market Size – Product Type Segment 2018 - 2022 ($ million)
    • 4.4 Geography Segment Analysis 2018 - 2022
      • Exhibit 21: Historic Market Size – Geography Segment 2018 - 2022 ($ million)
    • 4.5 Country Segment Analysis 2018 - 2022
      • Exhibit 22: Historic Market Size – Country Segment 2018 - 2022 ($ million)

    5 Five Forces Analysis

    • 5.1 Five forces summary
      • Exhibit 23: Five forces analysis - Comparison between 2023 and 2028
    • 5.2 Bargaining power of buyers
      • Exhibit 24: Chart on Bargaining power of buyers – Impact of key factors 2023 and 2028
    • 5.3 Bargaining power of suppliers
      • Exhibit 25: Bargaining power of suppliers – Impact of key factors in 2023 and 2028
    • 5.4 Threat of new entrants
      • Exhibit 26: Threat of new entrants – Impact of key factors in 2023 and 2028
    • 5.5 Threat of substitutes
      • Exhibit 27: Threat of substitutes – Impact of key factors in 2023 and 2028
    • 5.6 Threat of rivalry
      • Exhibit 28: Threat of rivalry – Impact of key factors in 2023 and 2028
    • 5.7 Market condition
      • Exhibit 29: Chart on Market condition - Five forces 2023 and 2028

    6 Market Segmentation by Distribution Channel

    • 6.1 Market segments
      • Exhibit 30: Chart on Distribution Channel - Market share 2023-2028 (%)
      • Exhibit 31: Data Table on Distribution Channel - Market share 2023-2028 (%)
    • 6.2 Comparison by Distribution Channel
      • Exhibit 32: Chart on Comparison by Distribution Channel
      • Exhibit 33: Data Table on Comparison by Distribution Channel
    • 6.3 Offline - Market size and forecast 2023-2028
      • Exhibit 34: Chart on Offline - Market size and forecast 2023-2028 ($ million)
      • Exhibit 35: Data Table on Offline - Market size and forecast 2023-2028 ($ million)
      • Exhibit 36: Chart on Offline - Year-over-year growth 2023-2028 (%)
      • Exhibit 37: Data Table on Offline - Year-over-year growth 2023-2028 (%)
    • 6.4 Online - Market size and forecast 2023-2028
      • Exhibit 38: Chart on Online - Market size and forecast 2023-2028 ($ million)
      • Exhibit 39: Data Table on Online - Market size and forecast 2023-2028 ($ million)
      • Exhibit 40: Chart on Online - Year-over-year growth 2023-2028 (%)
      • Exhibit 41: Data Table on Online - Year-over-year growth 2023-2028 (%)
    • 6.5 Market opportunity by Distribution Channel
      • Exhibit 42: Market opportunity by Distribution Channel ($ million)
      • Exhibit 43: Data Table on Market opportunity by Distribution Channel ($ million)

    7 Market Segmentation by Product Type

    • 7.1 Market segments
      • Exhibit 44: Chart on Product Type - Market share 2023-2028 (%)
      • Exhibit 45: Data Table on Product Type - Market share 2023-2028 (%)
    • 7.2 Comparison by Product Type
      • Exhibit 46: Chart on Comparison by Product Type
      • Exhibit 47: Data Table on Comparison by Product Type
    • 7.3 Coconut water - Market size and forecast 2023-2028
      • Exhibit 48: Chart on Coconut water - Market size and forecast 2023-2028 ($ million)
      • Exhibit 49: Data Table on Coconut water - Market size and forecast 2023-2028 ($ million)
      • Exhibit 50: Chart on Coconut water - Year-over-year growth 2023-2028 (%)
      • Exhibit 51: Data Table on Coconut water - Year-over-year growth 2023-2028 (%)
    • 7.4 Maple water - Market size and forecast 2023-2028
      • Exhibit 52: Chart on Maple water - Market size and forecast 2023-2028 ($ million)
      • Exhibit 53: Data Table on Maple water - Market size and forecast 2023-2028 ($ million)
      • Exhibit 54: Chart on Maple water - Year-over-year growth 2023-2028 (%)
      • Exhibit 55: Data Table on Maple water - Year-over-year growth 2023-2028 (%)
    • 7.5 Others - Market size and forecast 2023-2028
      • Exhibit 56: Chart on Others - Market size and forecast 2023-2028 ($ million)
      • Exhibit 57: Data Table on Others - Market size and forecast 2023-2028 ($ million)
      • Exhibit 58: Chart on Others - Year-over-year growth 2023-2028 (%)
      • Exhibit 59: Data Table on Others - Year-over-year growth 2023-2028 (%)
    • 7.6 Market opportunity by Product Type
      • Exhibit 60: Market opportunity by Product Type ($ million)
      • Exhibit 61: Data Table on Market opportunity by Product Type ($ million)

    8 Customer Landscape

    • 8.1 Customer landscape overview
      • Exhibit 62: Analysis of price sensitivity, lifecycle, customer purchase basket, adoption rates, and purchase criteria

    9 Geographic Landscape

    • 9.1 Geographic segmentation
      • Exhibit 63: Chart on Market share by geography 2023-2028 (%)
      • Exhibit 64: Data Table on Market share by geography 2023-2028 (%)
    • 9.2 Geographic comparison
      • Exhibit 65: Chart on Geographic comparison
      • Exhibit 66: Data Table on Geographic comparison
    • 9.3 North America - Market size and forecast 2023-2028
      • Exhibit 67: Chart on North America - Market size and forecast 2023-2028 ($ million)
      • Exhibit 68: Data Table on North America - Market size and forecast 2023-2028 ($ million)
      • Exhibit 69: Chart on North America - Year-over-year growth 2023-2028 (%)
      • Exhibit 70: Data Table on North America - Year-over-year growth 2023-2028 (%)
    • 9.4 APAC - Market size and forecast 2023-2028
      • Exhibit 71: Chart on APAC - Market size and forecast 2023-2028 ($ million)
      • Exhibit 72: Data Table on APAC - Market size and forecast 2023-2028 ($ million)
      • Exhibit 73: Chart on APAC - Year-over-year growth 2023-2028 (%)
      • Exhibit 74: Data Table on APAC - Year-over-year growth 2023-2028 (%)
    • 9.5 Europe - Market size and forecast 2023-2028
      • Exhibit 75: Chart on Europe - Market size and forecast 2023-2028 ($ million)
      • Exhibit 76: Data Table on Europe - Market size and forecast 2023-2028 ($ million)
      • Exhibit 77: Chart on Europe - Year-over-year growth 2023-2028 (%)
      • Exhibit 78: Data Table on Europe - Year-over-year growth 2023-2028 (%)
    • 9.6 South America - Market size and forecast 2023-2028
      • Exhibit 79: Chart on South America - Market size and forecast 2023-2028 ($ million)
      • Exhibit 80: Data Table on South America - Market size and forecast 2023-2028 ($ million)
      • Exhibit 81: Chart on South America - Year-over-year growth 2023-2028 (%)
      • Exhibit 82: Data Table on South America - Year-over-year growth 2023-2028 (%)
    • 9.7 Middle East and Africa - Market size and forecast 2023-2028
      • Exhibit 83: Chart on Middle East and Africa - Market size and forecast 2023-2028 ($ million)
      • Exhibit 84: Data Table on Middle East and Africa - Market size and forecast 2023-2028 ($ million)
      • Exhibit 85: Chart on Middle East and Africa - Year-over-year growth 2023-2028 (%)
      • Exhibit 86: Data Table on Middle East and Africa - Year-over-year growth 2023-2028 (%)
    • 9.8 US - Market size and forecast 2023-2028
      • Exhibit 87: Chart on US - Market size and forecast 2023-2028 ($ million)
      • Exhibit 88: Data Table on US - Market size and forecast 2023-2028 ($ million)
      • Exhibit 89: Chart on US - Year-over-year growth 2023-2028 (%)
      • Exhibit 90: Data Table on US - Year-over-year growth 2023-2028 (%)
    • 9.9 Indonesia - Market size and forecast 2023-2028
      • Exhibit 91: Chart on Indonesia - Market size and forecast 2023-2028 ($ million)
      • Exhibit 92: Data Table on Indonesia - Market size and forecast 2023-2028 ($ million)
      • Exhibit 93: Chart on Indonesia - Year-over-year growth 2023-2028 (%)
      • Exhibit 94: Data Table on Indonesia - Year-over-year growth 2023-2028 (%)
    • 9.10 UK - Market size and forecast 2023-2028
      • Exhibit 95: Chart on UK - Market size and forecast 2023-2028 ($ million)
      • Exhibit 96: Data Table on UK - Market size and forecast 2023-2028 ($ million)
      • Exhibit 97: Chart on UK - Year-over-year growth 2023-2028 (%)
      • Exhibit 98: Data Table on UK - Year-over-year growth 2023-2028 (%)
    • 9.11 India - Market size and forecast 2023-2028
      • Exhibit 99: Chart on India - Market size and forecast 2023-2028 ($ million)
      • Exhibit 100: Data Table on India - Market size and forecast 2023-2028 ($ million)
      • Exhibit 101: Chart on India - Year-over-year growth 2023-2028 (%)
      • Exhibit 102: Data Table on India - Year-over-year growth 2023-2028 (%)
    • 9.12 France - Market size and forecast 2023-2028
      • Exhibit 103: Chart on France - Market size and forecast 2023-2028 ($ million)
      • Exhibit 104: Data Table on France - Market size and forecast 2023-2028 ($ million)
      • Exhibit 105: Chart on France - Year-over-year growth 2023-2028 (%)
      • Exhibit 106: Data Table on France - Year-over-year growth 2023-2028 (%)
    • 9.13 Market opportunity by geography
      • Exhibit 107: Market opportunity by geography ($ million)
      • Exhibit 108: Data Tables on Market opportunity by geography ($ million)

    10 Drivers, Challenges, and Trends

    • 10.1 Market drivers
      • 10.2 Market challenges
        • 10.3 Impact of drivers and challenges
          • Exhibit 109: Impact of drivers and challenges in 2023 and 2028
        • 10.4 Market trends

          11 Vendor Landscape

          • 11.1 Overview
            • 11.2 Vendor landscape
              • Exhibit 110: Overview on Criticality of inputs and Factors of differentiation
            • 11.3 Landscape disruption
              • Exhibit 111: Overview on factors of disruption
            • 11.4 Industry risks
              • Exhibit 112: Impact of key risks on business

            12 Vendor Analysis

            • 12.1 Vendors covered
              • Exhibit 113: Vendors covered
            • 12.2 Market positioning of vendors
              • Exhibit 114: Matrix on vendor position and classification
            • 12.3 Alibi
              • Exhibit 115: Alibi - Overview
              • Exhibit 116: Alibi - Product / Service
              • Exhibit 117: Alibi - Key offerings
            • 12.4 AquaBotanical Water
              • Exhibit 118: AquaBotanical Water - Overview
              • Exhibit 119: AquaBotanical Water - Product / Service
              • Exhibit 120: AquaBotanical Water - Key offerings
            • 12.5 Caliwater LLC
              • Exhibit 121: Caliwater LLC - Overview
              • Exhibit 122: Caliwater LLC - Product / Service
              • Exhibit 123: Caliwater LLC - Key offerings
            • 12.6 Danone SA
              • Exhibit 124: Danone SA - Overview
              • Exhibit 125: Danone SA - Business segments
              • Exhibit 126: Danone SA - Key news
              • Exhibit 127: Danone SA - Key offerings
              • Exhibit 128: Danone SA - Segment focus
            • 12.7 Drink Simple
              • Exhibit 129: Drink Simple - Overview
              • Exhibit 130: Drink Simple - Product / Service
              • Exhibit 131: Drink Simple - Key offerings
            • 12.8 Genius Juice
              • Exhibit 132: Genius Juice - Overview
              • Exhibit 133: Genius Juice - Product / Service
              • Exhibit 134: Genius Juice - Key offerings
            • 12.9 HappyTree Maple Water
              • Exhibit 135: HappyTree Maple Water - Overview
              • Exhibit 136: HappyTree Maple Water - Product / Service
              • Exhibit 137: HappyTree Maple Water - Key offerings
            • 12.10 Harmless Harvest Inc.
              • Exhibit 138: Harmless Harvest Inc. - Overview
              • Exhibit 139: Harmless Harvest Inc. - Product / Service
              • Exhibit 140: Harmless Harvest Inc. - Key offerings
            • 12.11 Maple 3
              • Exhibit 141: Maple 3 - Overview
              • Exhibit 142: Maple 3 - Product / Service
              • Exhibit 143: Maple 3 - Key news
              • Exhibit 144: Maple 3 - Key offerings
            • 12.12 Nestle SA
              • Exhibit 145: Nestle SA - Overview
              • Exhibit 146: Nestle SA - Business segments
              • Exhibit 147: Nestle SA - Key news
              • Exhibit 148: Nestle SA - Key offerings
              • Exhibit 149: Nestle SA - Segment focus
            • 12.13 Nordic Koivu Ltd.
              • Exhibit 150: Nordic Koivu Ltd. - Overview
              • Exhibit 151: Nordic Koivu Ltd. - Product / Service
              • Exhibit 152: Nordic Koivu Ltd. - Key offerings
            • 12.14 Rebel Kitchen
              • Exhibit 153: Rebel Kitchen - Overview
              • Exhibit 154: Rebel Kitchen - Product / Service
              • Exhibit 155: Rebel Kitchen - Key offerings
            • 12.15 SunOpta Inc.
              • Exhibit 156: SunOpta Inc. - Overview
              • Exhibit 157: SunOpta Inc. - Business segments
              • Exhibit 158: SunOpta Inc. - Key offerings
              • Exhibit 159: SunOpta Inc. - Segment focus
            • 12.16 Tetra Pak Group
              • Exhibit 160: Tetra Pak Group - Overview
              • Exhibit 161: Tetra Pak Group - Business segments
              • Exhibit 162: Tetra Pak Group - Key news
              • Exhibit 163: Tetra Pak Group - Key offerings
              • Exhibit 164: Tetra Pak Group - Segment focus
            • 12.17 The Vita Coco Co. Inc.
              • Exhibit 165: The Vita Coco Co. Inc. - Overview
              • Exhibit 166: The Vita Coco Co. Inc. - Business segments
              • Exhibit 167: The Vita Coco Co. Inc. - Key offerings
              • Exhibit 168: The Vita Coco Co. Inc. - Segment focus

            13 Appendix

            • 13.1 Scope of the report
              • 13.2 Inclusions and exclusions checklist
                • Exhibit 169: Inclusions checklist
                • Exhibit 170: Exclusions checklist
              • 13.3 Currency conversion rates for US$
                • Exhibit 171: Currency conversion rates for US$
              • 13.4 Research methodology
                • Exhibit 172: Research methodology
                • Exhibit 173: Validation techniques employed for market sizing
                • Exhibit 174: Information sources
              • 13.5 List of abbreviations
                • Exhibit 175: List of abbreviations

              Research Methodology

              Technavio presents a detailed picture of the market by way of study, synthesis, and summation of data from multiple sources. The analysts have presented the various facets of the market with a particular focus on identifying the key industry influencers. The data thus presented is comprehensive, reliable, and the result of extensive research, both primary and secondary.

              INFORMATION SOURCES

              Primary sources

              • Manufacturers and suppliers
              • Channel partners
              • Industry experts
              • Strategic decision makers

              Secondary sources

              • Industry journals and periodicals
              • Government data
              • Financial reports of key industry players
              • Historical data
              • Press releases

              DATA ANALYSIS

              Data Synthesis

              • Collation of data
              • Estimation of key figures
              • Analysis of derived insights

              Data Validation

              • Triangulation with data models
              • Reference against proprietary databases
              • Corroboration with industry experts

              REPORT WRITING

              Qualitative

              • Market drivers
              • Market challenges
              • Market trends
              • Five forces analysis

              Quantitative

              • Market size and forecast
              • Market segmentation
              • Geographical insights
              • Competitive landscape

              Interested in this report?

              Get your sample now to see our research methodology and insights!

              Download Now

              Frequently Asked Questions

              Plant-based Water market growth will increase by 12764.03 million during 2024-2028.

              The Plant-based Water market is expected to grow at a CAGR of 19.64% during 2024-2028.

              Plant-based Water market is segmented by Distribution Channel( Offline, Online, other plant-based water) Product Type( Coconut water, Maple water, Others, South America, Middle East and Africa)

              Alibi, AquaBotanical Water, Caliwater LLC, Danone SA, Drink Simple, DuPont de Nemours Inc., Forager Project, Genius Juice, Glanbia plc, HappyTree Maple Water, Harmless Harvest Inc., Maple 3, Nestle SA, Nordic Koivu Ltd., Rebel Kitchen, Steaz, SunOpta Inc., Tetra Pak Group, The Coca Cola Co., The Vita Coco Co. Inc. are a few of the key vendors in the Plant-based Water market.

              North America will register the highest growth rate of 35.41% among the other regions. Therefore, the Plant-based Water market in North America is expected to garner significant business opportunities for the vendors during the forecast period.

              US, Indonesia, India, UK, France

              • New product launchesNew product development is the driving factor this market.
              • improved taste is the driving factor this market.
              • and versatility is the driving factor this market.
              • as well as high levels of marketing support is the driving factor this market.
              • will increase the demand for packaged beverages such as plant-based water. Over the past few years is the driving factor this market.
              • the plant-based water market has witnessed a rise in the number of new product launches. Some of the product launches are as follows: In June 2021 is the driving factor this market.
              • Del Monte Foods is the driving factor this market.
              • Inc announced the launch of its packaged King Coconut Water is the driving factor this market.
              • which is renowned for its superior health and taste benefits is the driving factor this market.
              • in India. In June 2021 is the driving factor this market.
              • Maple 3 announced the launch of its new range of organic sparkling maple waters. In April 2021 is the driving factor this market.
              • Country Delight announced the launch of Country Delight's Country Coconut Water with innovative packaging. In February 2021 is the driving factor this market.
              • The Vita Coco Co. announced the launch of its Vita Coco coconut water in the US. Therefore is the driving factor this market.
              • such factors will positively impact the growth of the global plant-based water market during the forecast period. is the driving factor this market.

              The Plant-based Water market vendors should focus on grabbing business opportunities from the Offline segment as it accounted for the largest market share in the base year.
              RIA - Research AI Assistant
              Ask RIA