Policy Management Software Market Analysis North America, Europe, APAC, Middle East and Africa, South America - US, China, UK - Size and Forecast 2024-2028

Policy Management Software Market Analysis North America, Europe, APAC, Middle East and Africa, South America - US, China, UK - Size and Forecast 2024-2028

Published: Aug 2024 216 Pages SKU: IRTNTR80123

Market Overview at a Glance

$1.37 B
Market Opportunity
11.74%
CAGR
10.85
YoY growth 2023-2024(%)

Policy Management Software Market Size 2024-2028 

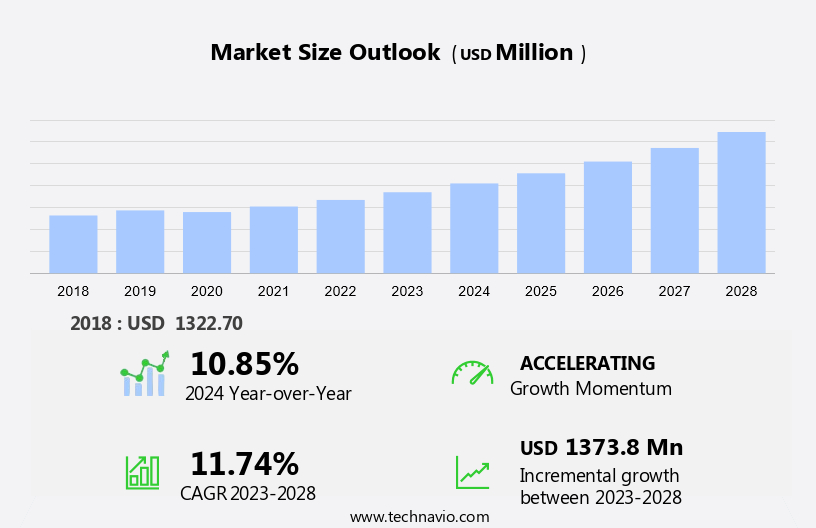
The policy management software market size is forecast to increase by USD 1.37 billion at a CAGR of 11.74% between 2023 and 2028. Policy management software has become a crucial component of information technology infrastructure for various industries, including financial services, insurance, energy, and manufacturing. The market for these solutions is witnessing significant growth due to several factors. One major trend is the increasing need for enhanced security in the face of rising data breaches. Another trend is the integration of advanced technologies such as artificial intelligence (AI) and automation technologies to streamline policy management processes. However, the high implementation and maintenance costs of these software solutions remain a challenge for many organizations. Additionally, the shift towards cloud deployment is gaining traction as it offers cost savings, flexibility, and scalability. Effective information management solutions are essential for employee performance and regulatory compliance, making policy management software a vital investment for businesses seeking to stay competitive and secure in today's dynamic business environment.

What will be the Size of the Market During the Forecast Period?

Policy Management Software Market Size

 Request Free Sample

The market is witnessing significant growth due to the increasing need for centralized management of organizational policies across various industries. Policy management software enables businesses to effectively manage their policies throughout their entire lifecycle, ensuring regulatory compliance, risk control, and litigation protection. Policy documentation is a crucial aspect of policy management. With policy management software, organizations can maintain up-to-date and easily accessible documentation. Real-time updates ensure that all stakeholders have access to the latest policies, reducing the risk of non-compliance. At-risk management is another key feature of policy management software.

Furthermore, it allows organizations to identify and mitigate potential risks by monitoring policy adherence and providing notifications and escalations when necessary. This feature is particularly important in industries such as transportation and healthcare, where non-compliance can result in serious consequences. Policy lifecycle management involves the creation, approval, implementation, and revision of policies. Automated reminders and electronic approval signatures streamline this process, ensuring that policies are reviewed and updated in a timely and efficient manner. Document versioning and revision tracking provide a clear record of changes, enhancing transparency and accountability. Accessibility is another important consideration in policy management. With the increasing trend of remote employment and mobile availability, policy management software must be accessible from anywhere, at any time.

Moreover, integration difficulties and security issues are common challenges in implementing policy management software, but they can be addressed through careful planning and implementation. Financial risks and regulatory compliance are major drivers of the market. Organizations face significant fines and reputational damage for non-compliance, making effective policy management a priority. cybersecurity is another area of concern, with the increasing number of cyber threats requiring strong policy frameworks to mitigate risks. Stakeholder involvement is essential in policy management. Policy management software enables organizations to involve all relevant stakeholders in the policy creation and review process, ensuring that policies reflect the needs and concerns of all parties involved.

Market Segmentation

The market research report provides comprehensive data (region-wise segment analysis), with forecasts and estimates in "USD billion" for the period 2024-2028, as well as historical data from 2018-2022 for the following segments.

  • Deployment
    • On-premises
    • Cloud based
  • End-user
    • Banking and financial services
    • Insurance
    • Healthcare
    • Government
    • Others
  • Geography
    • North America
      • US
    • Europe
      • UK
    • APAC
      • China
    • Middle East and Africa
    • South America

By Deployment Insights

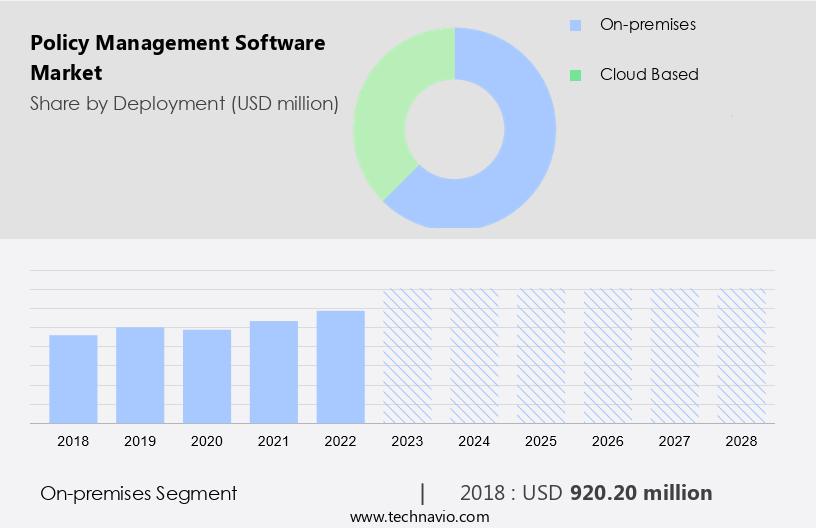
The on-premises segment is estimated to witness significant growth during the forecast period. Policy management software is a crucial tool for organizations to mitigate risks associated with non-compliance and ensure organizational efficiency. While cloud solutions offer convenience and flexibility, the on-premises model is more secure due to end-to-end quality control and no third-party interference. This model is particularly attractive to large enterprises and government agencies dealing with sensitive data. The on-premises market is poised for substantial growth during the forecast period. The upfront investment required for hardware, software, and IT workforce training may be substantial, but the benefits of enhanced security and control justify the expense.

Moreover, value-added services such as document access controls, policy status reporting, subscriber data management, and IT infrastructure support further add to the value proposition. The on-premises model's security features are essential for industries with strict regulatory requirements, such as government and defense. These organizations prioritize functionality and security over cost considerations. The on-premises model's ability to provide customized solutions and seamless integration with existing systems is another significant advantage. In conclusion, the on-premises market will continue to thrive due to the increasing demand for strong security and control in managing organizational policies. This trend is expected to persist, particularly among large enterprises and government agencies.

Policy Management Software Market Size

Get a glance at the market share of various segments Request Free Sample

The on-premises segment accounted for USD 920.20 million in 2018 and showed a gradual increase during the forecast period.

Regional Insights

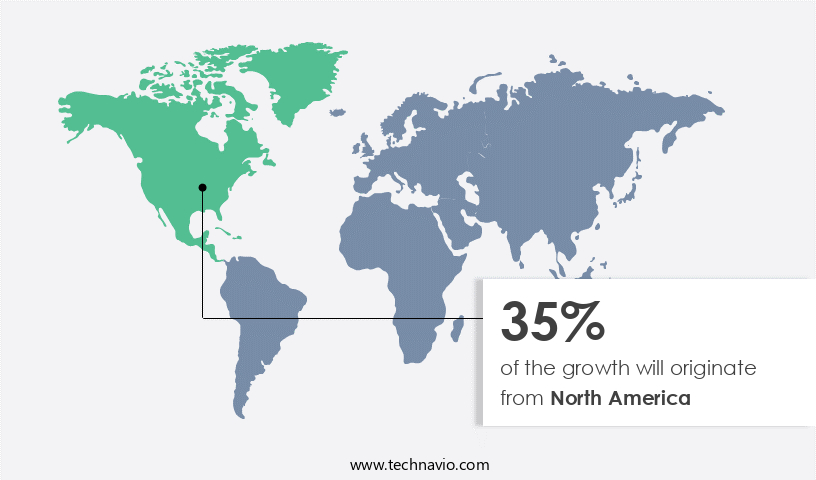
North America is estimated to contribute 35% to the growth of the global market during the forecast period. Technavio's analysts have elaborately explained the regional trends and drivers that shape the market during the forecast period.

Policy Management Software Market Share by Geography

For more insights on the market share of various regions Request Free Sample

In North America, policy management software is experiencing significant demand due to the region's advanced technological infrastructure and the industrial sector's maturity. Enterprise adoption of Cloud services in the US and Canada is driving the market's growth, as businesses seek to streamline operations and enhance productivity. Advanced technologies, including AI, machine learning, virtualization, and cloud computing, are creating numerous applications for policy management software. Centralized policy management is crucial for ensuring real-time updates, at-risk management, and compliance adherence. Policy documentation is also essential for maintaining transparency and accountability, particularly in sectors like transportation and healthcare. Policy lifecycle management, notifications, and escalations are critical components of effective policy management. By implementing policy management software, North American businesses can minimize risks, improve efficiency, and ensure regulatory compliance.

Our researchers analyzed the data with 2023 as the base year, along with the key drivers, trends, and challenges. A holistic analysis of drivers will help companies refine their marketing strategies to gain a competitive advantage.

Market Driver

The rise in the frequency of data breaches among various industries is the key driver of the market. The escalating number of cybersecurity threats and data breaches have compelled businesses to prioritize policy management, focusing on securing and ensuring compliance for sensitive data. Advanced policy management software solutions have gained traction due to their capabilities in access control, encryption, and audit trails, which help protect critical policies and related data from unauthorized access and potential breaches.

Furthermore, this swell affected an estimated 353 million people, underscoring the importance of strong data security measures. As a result, organizations are increasingly adopting policy management software with advanced automation, machine learning, artificial intelligence, and both cloud-based and on-premise solutions to mitigate risks and maintain regulatory compliance.

Market Trends

Integration of artificial intelligence (AI) and automation technologies in policy management software is the upcoming trend in the market. The integration of AI and automation technologies in policy management software is significantly transforming business operations by enabling organizations to efficiently create, manage, and enforce policies. This technological convergence allows companies in various sectors such as financial services, insurance, information technology, energy, and manufacturing to enhance operational efficiency, streamline compliance processes, and proactively respond to evolving regulatory requirements. Artificial Intelligence plays a crucial role in automating the policy creation process. Natural language processing (NLP) algorithms enable organizations to generate policies by analyzing extensive regulatory documentation, industry standards, and best practices. This capability accelerates the policy development lifecycle, ensuring that policies are comprehensive, current, and in line with the latest regulatory changes and industry trends.

Moreover, AI-driven policy management software enhances security by continuously monitoring and enforcing policies across an organization's IT infrastructure. This proactive approach to policy management helps prevent potential security threats and ensures regulatory compliance. In summary, the adoption of AI and automation technologies in policy management software is revolutionizing the way businesses manage their policies, leading to increased operational efficiency, enhanced security, and improved regulatory compliance.

Market Challenge

High implementation and maintenance costs of policy management software is a key challenge affecting market growth. Policy management software has become an essential tool for organizations to effectively manage and enforce their internal policies. However, the cost of acquiring, implementing, and maintaining this software has been a significant barrier for many, particularly smaller and mid-sized enterprises. The initial investment required for software licensing, customization, training, and implementation support can be substantial, leading to hesitation in adoption, especially for financially constrained businesses. Costs for policy management software range from USD500 to USD20,000 annually, with enterprise solutions typically being the most expensive. These expenses can strain budgetary resources, making it a critical consideration for businesses. However, the benefits of policy management software, such as document review, automated reminders, electronic approval signatures, document versioning, revision tracking, accessibility, litigation protection, and financial risk management, far outweigh the costs.

Moreover, the web deployment of policy management software offers additional cost savings and flexibility, as it eliminates the need for on-premises hardware and maintenance. Additionally, the software's accessibility features enable remote workforces to access policies from anywhere, increasing efficiency and productivity. In conclusion, while the initial investment for policy management software can be substantial, the long-term benefits, including cost savings, increased efficiency, and regulatory compliance, make it a worthwhile investment for organizations. By carefully evaluating the costs and potential return on investment, businesses can make an informed decision about adopting policy management software.

Exclusive Customer Landscape

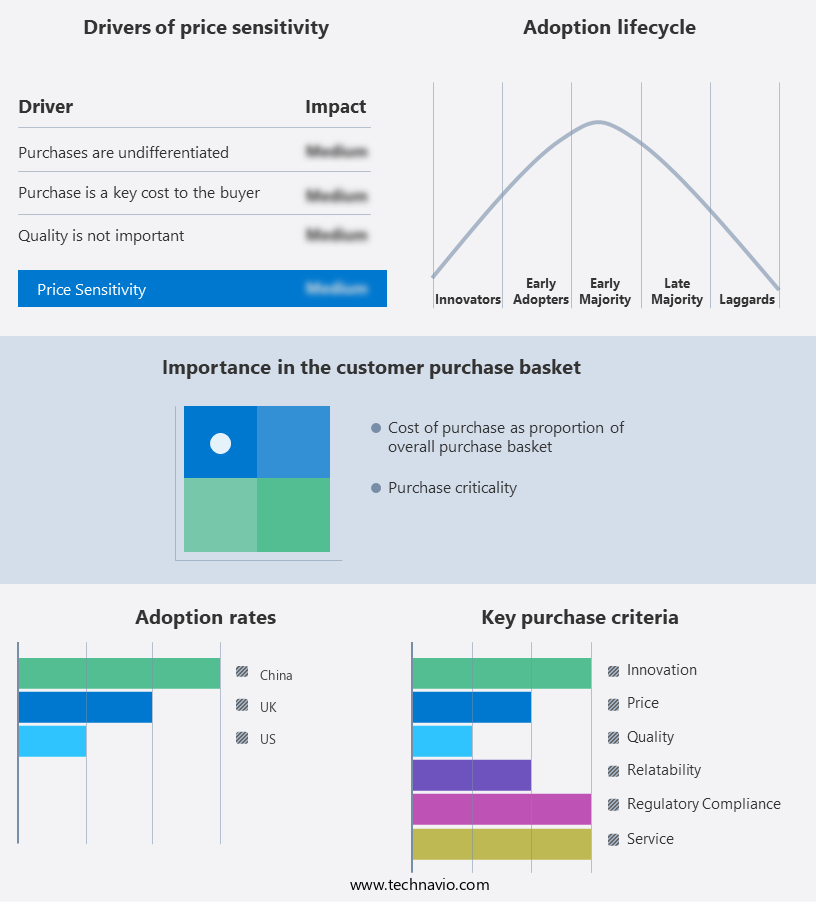
The market forecasting report includes the adoption lifecycle of the market, covering from the innovator's stage to the laggard's stage. It focuses on adoption rates in different regions based on penetration. Furthermore, the report also includes key purchase criteria and drivers of price sensitivity to help companies evaluate and develop their market growth analysis strategies.

Policy Management Software Market Share by Geography

 Customer Landscape

Key Companies & Market Insights

Companies are implementing various strategies, such as strategic alliances, partnerships, mergers and acquisitions, geographical expansion, and product/service launches, to enhance their presence in the market.

ConvergePoint Inc: The company offers policy management software such as Microsoft 365 SharePoint policy management software, which is user-friendly for employees, compliance managers, and risk management officers, and comes with SharePoint IT access.

The market research and growth report includes detailed analyses of the competitive landscape of the market and information about key companies, including:

  • Aptien Labs s.r.o.
  • Azati
  • ComplianceBridge Corp.
  • Damco Group
  • Duck Creek Technologies LLC
  • EIS Group Inc.
  • Fadata
  • Guidewire Software Inc.
  • Hyland Software Inc.
  • Insurity LLC
  • Majesco
  • MetricStream Inc.
  • Mitratech Holdings Inc.
  • OneShield
  • OneTrust LLC
  • Open Document Management System S.L.
  • Oracle Corp.
  • Pegasystems Inc.
  • QUALEX CORP
  • Riskonnect Inc.
  • RLDatix Global
  • SAP SE
  • SAPIENS INTERNATIONAL CORP. N.V
  • Verisk Analytics Inc.
  • Workiva Inc.

Qualitative and quantitative analysis of companies has been conducted to help clients understand the wider business environment as well as the strengths and weaknesses of key market players. Data is qualitatively analyzed to categorize companies as pure play, category-focused, industry-focused, and diversified; it is quantitatively analyzed to categorize companies as dominant, leading, strong, tentative, and weak.

Research Analyst Overview

Policy management software plays a crucial role in helping organizations effectively manage and enforce their policies across various sectors such as transportation, healthcare, financial services, insurance, energy, manufacturing, and IT infrastructure. Centralized policy management enables real-time updates and at-risk management, ensuring compliance with regulations and reducing financial risks. Policy documentation, automation, and accessibility are essential features, along with notifications and escalations for timely action. Policy lifecycle management is critical for organizations, with document review, automated reminders, electronic approval signatures, document versioning, and revision tracking ensuring accuracy and accountability. Cloud services and on-premise solutions offer flexibility, with cloud-based solutions providing mobility and remote access.

Furthermore, data security and cybersecurity threats are significant concerns, with policy management software offering litigation protection, access controls, and policy status reporting. Machine learning and artificial intelligence enable automation and risk control, while the Internet of Things and digital transformation require specialized policy management solutions. Efficiency and organizational effectiveness are key benefits, with value-added services, employee performance management, and risk impact analysis contributing to improved operational processes. Standardization, scalability, and education and awareness are essential for successful implementation. Integration difficulties, security issues, and technical restrictions are challenges that organizations must address for effective policy management. Confidentiality, IT and telecommunications, and subscriber data management are additional areas of focus.

Market Scope

Report Coverage

Details

Page number

216

Base year

2023

Historic period

2018-2022

Forecast period

2024-2028

Growth momentum & CAGR

Accelerate at a CAGR of 11.74%

Market growth 2024-2028

USD 1.37 billion

Market structure

Fragmented

YoY growth 2023-2024(%)

10.85

Regional analysis

North America, Europe, APAC, Middle East and Africa, and South America

Performing market contribution

North America at 35%

Key countries

US, China, and UK

Competitive landscape

Leading Companies, Market Positioning of Companies, Competitive Strategies, and Industry Risks

Key companies profiled

Aptien Labs s.r.o., Azati, ComplianceBridge Corp., ConvergePoint Inc., Damco Group, Duck Creek Technologies LLC, EIS Group Inc., Fadata, Guidewire Software Inc., Hyland Software Inc., Insurity LLC, Majesco, MetricStream Inc., Mitratech Holdings Inc., OneShield, OneTrust LLC, Open Document Management System S.L., Oracle Corp., Pegasystems Inc., QUALEX CORP, Riskonnect Inc., RLDatix Global, SAP SE, SAPIENS INTERNATIONAL CORP. N.V, Verisk Analytics Inc., and Workiva Inc.

Market dynamics

Parent market analysis, market growth inducers and obstacles, market forecast, fast-growing and slow-growing segment analysis, COVID-19 impact and recovery analysis and future consumer dynamics, market condition analysis for the forecast period

Customization purview

If our market report has not included the data that you are looking for, you can reach out to our analysts and get segments customized.

Request Free Sample

What are the Key Data Covered in this Market Research and Growth Report?

  • CAGR of the market during the forecast period
  • Detailed information on factors that will drive the market growth and forecasting between 2024 and 2028
  • Precise estimation of the size of the market  and its contribution of the market in focus to the parent market
  • Accurate predictions about upcoming market growth and trends and changes in consumer behaviour
  • Growth of the market across North America, Europe, APAC, Middle East and Africa, and South America
  • Thorough analysis of the market's competitive landscape and detailed information about companies
  • Comprehensive analysis of factors that will challenge the growth of market companies

We can help! Our analysts can customize this market research report to meet your requirements. Get in touch

1 Executive Summary

  • 1.1 Market overview
    • Executive Summary - Chart on Market Overview
    • Executive Summary - Data Table on Market Overview
    • Executive Summary - Chart on Global Market Characteristics
    • Executive Summary - Chart on Market by Geography
    • Executive Summary - Chart on Market Segmentation by Deployment
    • Executive Summary - Chart on Market Segmentation by End-user
    • Executive Summary - Chart on Incremental Growth
    • Executive Summary - Data Table on Incremental Growth
    • Executive Summary - Chart on Company Market Positioning

2 Technavio Analysis

  • 2.1 Analysis of price sensitivity, lifecycle, customer purchase basket, adoption rates, and purchase criteria
    • Analysis of price sensitivity, lifecycle, customer purchase basket, adoption rates, and purchase criteria
  • 2.2 Criticality of inputs and Factors of differentiation
    • Overview on criticality of inputs and factors of differentiation
  • 2.3 Factors of disruption
    • Overview on factors of disruption
  • 2.4 Impact of drivers and challenges
    • Impact of drivers and challenges in 2023 and 2028

3 Market Landscape

  • 3.1 Market ecosystem
    • Parent Market
    • Data Table on - Parent Market
  • 3.2 Market characteristics
    • Market characteristics analysis
  • 3.3 Value chain analysis
    • Value Chain Analysis

4 Market Sizing

  • 4.1 Market definition
    • Offerings of companies included in the market definition
  • 4.2 Market segment analysis
    • Market segments
  • 4.3 Market size 2023
    • 4.4 Market outlook: Forecast for 2023-2028
      • Chart on Global - Market size and forecast 2023-2028 ($ million)
      • Data Table on Global - Market size and forecast 2023-2028 ($ million)
      • Chart on Global Market: Year-over-year growth 2023-2028 (%)
      • Data Table on Global Market: Year-over-year growth 2023-2028 (%)

    5 Historic Market Size

    • 5.1 Global Policy Management Software Market 2018 - 2022
      • Historic Market Size - Data Table on Global Policy Management Software Market 2018 - 2022 ($ million)
    • 5.2 Deployment segment analysis 2018 - 2022
      • Historic Market Size - Deployment Segment 2018 - 2022 ($ million)
    • 5.3 End-user segment analysis 2018 - 2022
      • Historic Market Size - End-user Segment 2018 - 2022 ($ million)
    • 5.4 Geography segment analysis 2018 - 2022
      • Historic Market Size - Geography Segment 2018 - 2022 ($ million)
    • 5.5 Country segment analysis 2018 - 2022
      • Historic Market Size - Country Segment 2018 - 2022 ($ million)

    6 Qualitative Analysis

    • 6.1 Impact of AI on the Global Policy Management Software Market

      7 Five Forces Analysis

      • 7.1 Five forces summary
        • Five forces analysis - Comparison between 2023 and 2028
      • 7.2 Bargaining power of buyers
        • Bargaining power of buyers - Impact of key factors 2023 and 2028
      • 7.3 Bargaining power of suppliers
        • Bargaining power of suppliers - Impact of key factors in 2023 and 2028
      • 7.4 Threat of new entrants
        • Threat of new entrants - Impact of key factors in 2023 and 2028
      • 7.5 Threat of substitutes
        • Threat of substitutes - Impact of key factors in 2023 and 2028
      • 7.6 Threat of rivalry
        • Threat of rivalry - Impact of key factors in 2023 and 2028
      • 7.7 Market condition
        • Chart on Market condition - Five forces 2023 and 2028

      8 Market Segmentation by Deployment

      • 8.1 Market segments
        • Chart on Deployment - Market share 2023-2028 (%)
        • Data Table on Deployment - Market share 2023-2028 (%)
      • 8.2 Comparison by Deployment
        • Chart on Comparison by Deployment
        • Data Table on Comparison by Deployment
      • 8.3 On-premises - Market size and forecast 2023-2028
        • Chart on On-premises - Market size and forecast 2023-2028 ($ million)
        • Data Table on On-premises - Market size and forecast 2023-2028 ($ million)
        • Chart on On-premises - Year-over-year growth 2023-2028 (%)
        • Data Table on On-premises - Year-over-year growth 2023-2028 (%)
      • 8.4 Cloud based - Market size and forecast 2023-2028
        • Chart on Cloud based - Market size and forecast 2023-2028 ($ million)
        • Data Table on Cloud based - Market size and forecast 2023-2028 ($ million)
        • Chart on Cloud based - Year-over-year growth 2023-2028 (%)
        • Data Table on Cloud based - Year-over-year growth 2023-2028 (%)
      • 8.5 Market opportunity by Deployment
        • Market opportunity by Deployment ($ million)
        • Data Table on Market opportunity by Deployment ($ million)

      9 Market Segmentation by End-user

      • 9.1 Market segments
        • Chart on End-user - Market share 2023-2028 (%)
        • Data Table on End-user - Market share 2023-2028 (%)
      • 9.2 Comparison by End-user
        • Chart on Comparison by End-user
        • Data Table on Comparison by End-user
      • 9.3 Banking and financial services - Market size and forecast 2023-2028
        • Chart on Banking and financial services - Market size and forecast 2023-2028 ($ million)
        • Data Table on Banking and financial services - Market size and forecast 2023-2028 ($ million)
        • Chart on Banking and financial services - Year-over-year growth 2023-2028 (%)
        • Data Table on Banking and financial services - Year-over-year growth 2023-2028 (%)
      • 9.4 Insurance - Market size and forecast 2023-2028
        • Chart on Insurance - Market size and forecast 2023-2028 ($ million)
        • Data Table on Insurance - Market size and forecast 2023-2028 ($ million)
        • Chart on Insurance - Year-over-year growth 2023-2028 (%)
        • Data Table on Insurance - Year-over-year growth 2023-2028 (%)
      • 9.5 Healthcare - Market size and forecast 2023-2028
        • Chart on Healthcare - Market size and forecast 2023-2028 ($ million)
        • Data Table on Healthcare - Market size and forecast 2023-2028 ($ million)
        • Chart on Healthcare - Year-over-year growth 2023-2028 (%)
        • Data Table on Healthcare - Year-over-year growth 2023-2028 (%)
      • 9.6 Government - Market size and forecast 2023-2028
        • Chart on Government - Market size and forecast 2023-2028 ($ million)
        • Data Table on Government - Market size and forecast 2023-2028 ($ million)
        • Chart on Government - Year-over-year growth 2023-2028 (%)
        • Data Table on Government - Year-over-year growth 2023-2028 (%)
      • 9.7 Others - Market size and forecast 2023-2028
        • Chart on Others - Market size and forecast 2023-2028 ($ million)
        • Data Table on Others - Market size and forecast 2023-2028 ($ million)
        • Chart on Others - Year-over-year growth 2023-2028 (%)
        • Data Table on Others - Year-over-year growth 2023-2028 (%)
      • 9.8 Market opportunity by End-user
        • Market opportunity by End-user ($ million)
        • Data Table on Market opportunity by End-user ($ million)

      10 Customer Landscape

      • 10.1 Customer landscape overview
        • Analysis of price sensitivity, lifecycle, customer purchase basket, adoption rates, and purchase criteria

      11 Geographic Landscape

      • 11.1 Geographic segmentation
        • Chart on Market share by geography 2023-2028 (%)
        • Data Table on Market share by geography 2023-2028 (%)
      • 11.2 Geographic comparison
        • Chart on Geographic comparison
        • Data Table on Geographic comparison
      • 11.3 North America - Market size and forecast 2023-2028
        • Chart on North America - Market size and forecast 2023-2028 ($ million)
        • Data Table on North America - Market size and forecast 2023-2028 ($ million)
        • Chart on North America - Year-over-year growth 2023-2028 (%)
        • Data Table on North America - Year-over-year growth 2023-2028 (%)
      • 11.4 Europe - Market size and forecast 2023-2028
        • Chart on Europe - Market size and forecast 2023-2028 ($ million)
        • Data Table on Europe - Market size and forecast 2023-2028 ($ million)
        • Chart on Europe - Year-over-year growth 2023-2028 (%)
        • Data Table on Europe - Year-over-year growth 2023-2028 (%)
      • 11.5 APAC - Market size and forecast 2023-2028
        • Chart on APAC - Market size and forecast 2023-2028 ($ million)
        • Data Table on APAC - Market size and forecast 2023-2028 ($ million)
        • Chart on APAC - Year-over-year growth 2023-2028 (%)
        • Data Table on APAC - Year-over-year growth 2023-2028 (%)
      • 11.6 Middle East and Africa - Market size and forecast 2023-2028
        • Chart on Middle East and Africa - Market size and forecast 2023-2028 ($ million)
        • Data Table on Middle East and Africa - Market size and forecast 2023-2028 ($ million)
        • Chart on Middle East and Africa - Year-over-year growth 2023-2028 (%)
        • Data Table on Middle East and Africa - Year-over-year growth 2023-2028 (%)
      • 11.7 South America - Market size and forecast 2023-2028
        • Chart on South America - Market size and forecast 2023-2028 ($ million)
        • Data Table on South America - Market size and forecast 2023-2028 ($ million)
        • Chart on South America - Year-over-year growth 2023-2028 (%)
        • Data Table on South America - Year-over-year growth 2023-2028 (%)
      • 11.8 US - Market size and forecast 2023-2028
        • Chart on US - Market size and forecast 2023-2028 ($ million)
        • Data Table on US - Market size and forecast 2023-2028 ($ million)
        • Chart on US - Year-over-year growth 2023-2028 (%)
        • Data Table on US - Year-over-year growth 2023-2028 (%)
      • 11.9 China - Market size and forecast 2023-2028
        • Chart on China - Market size and forecast 2023-2028 ($ million)
        • Data Table on China - Market size and forecast 2023-2028 ($ million)
        • Chart on China - Year-over-year growth 2023-2028 (%)
        • Data Table on China - Year-over-year growth 2023-2028 (%)
      • 11.10 UK - Market size and forecast 2023-2028
        • Chart on UK - Market size and forecast 2023-2028 ($ million)
        • Data Table on UK - Market size and forecast 2023-2028 ($ million)
        • Chart on UK - Year-over-year growth 2023-2028 (%)
        • Data Table on UK - Year-over-year growth 2023-2028 (%)
      • 11.11 Canada - Market size and forecast 2023-2028
        • Chart on Canada - Market size and forecast 2023-2028 ($ million)
        • Data Table on Canada - Market size and forecast 2023-2028 ($ million)
        • Chart on Canada - Year-over-year growth 2023-2028 (%)
        • Data Table on Canada - Year-over-year growth 2023-2028 (%)
      • 11.12 Germany - Market size and forecast 2023-2028
        • Chart on Germany - Market size and forecast 2023-2028 ($ million)
        • Data Table on Germany - Market size and forecast 2023-2028 ($ million)
        • Chart on Germany - Year-over-year growth 2023-2028 (%)
        • Data Table on Germany - Year-over-year growth 2023-2028 (%)
      • 11.13 Australia - Market size and forecast 2023-2028
        • Chart on Australia - Market size and forecast 2023-2028 ($ million)
        • Data Table on Australia - Market size and forecast 2023-2028 ($ million)
        • Chart on Australia - Year-over-year growth 2023-2028 (%)
        • Data Table on Australia - Year-over-year growth 2023-2028 (%)
      • 11.14 Japan - Market size and forecast 2023-2028
        • Chart on Japan - Market size and forecast 2023-2028 ($ million)
        • Data Table on Japan - Market size and forecast 2023-2028 ($ million)
        • Chart on Japan - Year-over-year growth 2023-2028 (%)
        • Data Table on Japan - Year-over-year growth 2023-2028 (%)
      • 11.15 France - Market size and forecast 2023-2028
        • Chart on France - Market size and forecast 2023-2028 ($ million)
        • Data Table on France - Market size and forecast 2023-2028 ($ million)
        • Chart on France - Year-over-year growth 2023-2028 (%)
        • Data Table on France - Year-over-year growth 2023-2028 (%)
      • 11.16 India - Market size and forecast 2023-2028
        • Chart on India - Market size and forecast 2023-2028 ($ million)
        • Data Table on India - Market size and forecast 2023-2028 ($ million)
        • Chart on India - Year-over-year growth 2023-2028 (%)
        • Data Table on India - Year-over-year growth 2023-2028 (%)
      • 11.17 The Netherlands - Market size and forecast 2023-2028
        • Chart on The Netherlands - Market size and forecast 2023-2028 ($ million)
        • Data Table on The Netherlands - Market size and forecast 2023-2028 ($ million)
        • Chart on The Netherlands - Year-over-year growth 2023-2028 (%)
        • Data Table on The Netherlands - Year-over-year growth 2023-2028 (%)
      • 11.18 Market opportunity by geography
        • Market opportunity by geography ($ million)
        • Data Tables on Market opportunity by geography ($ million)

      12 Drivers, Challenges, and Opportunity/Restraints

      • 12.1 Market drivers
        • 12.2 Market challenges
          • 12.3 Impact of drivers and challenges
            • Impact of drivers and challenges in 2023 and 2028
          • 12.4 Market opportunities/restraints

            13 Competitive Landscape

            • 13.1 Overview
              • 13.2 Competitive Landscape
                • Overview on criticality of inputs and factors of differentiation
              • 13.3 Landscape disruption
                • Overview on factors of disruption
              • 13.4 Industry risks
                • Impact of key risks on business

              14 Competitive Analysis

              • 14.1 Companies profiled
                • Companies covered
              • 14.2 Company ranking index
                • Company ranking index
              • 14.3 Market positioning of companies
                • Matrix on companies position and classification
              • 14.4 ConvergePoint Inc.
                • ConvergePoint Inc. - Overview
                • ConvergePoint Inc. - Product / Service
                • ConvergePoint Inc. - Key offerings
                • SWOT
              • 14.5 Damco Group
                • Damco Group - Overview
                • Damco Group - Product / Service
                • Damco Group - Key offerings
                • SWOT
              • 14.6 Duck Creek Technologies LLC
                • Duck Creek Technologies LLC - Overview
                • Duck Creek Technologies LLC - Product / Service
                • Duck Creek Technologies LLC - Key offerings
                • SWOT
              • 14.7 EIS Group Inc.
                • EIS Group Inc. - Overview
                • EIS Group Inc. - Product / Service
                • EIS Group Inc. - Key offerings
                • SWOT
              • 14.8 Fadata
                • Fadata - Overview
                • Fadata - Product / Service
                • Fadata - Key offerings
                • SWOT
              • 14.9 Guidewire Software Inc.
                • Guidewire Software Inc. - Overview
                • Guidewire Software Inc. - Product / Service
                • Guidewire Software Inc. - Key offerings
                • SWOT
              • 14.10 Hyland Software Inc.
                • Hyland Software Inc. - Overview
                • Hyland Software Inc. - Product / Service
                • Hyland Software Inc. - Key offerings
                • SWOT
              • 14.11 Insurity LLC
                • Insurity LLC - Overview
                • Insurity LLC - Product / Service
                • Insurity LLC - Key offerings
                • SWOT
              • 14.12 Majesco
                • Majesco - Overview
                • Majesco - Product / Service
                • Majesco - Key offerings
                • SWOT
              • 14.13 Mitratech Holdings Inc.
                • Mitratech Holdings Inc. - Overview
                • Mitratech Holdings Inc. - Product / Service
                • Mitratech Holdings Inc. - Key offerings
                • SWOT
              • 14.14 OneShield
                • OneShield - Overview
                • OneShield - Product / Service
                • OneShield - Key offerings
                • SWOT
              • 14.15 Oracle Corp.
                • Oracle Corp. - Overview
                • Oracle Corp. - Business segments
                • Oracle Corp. - Key news
                • Oracle Corp. - Key offerings
                • Oracle Corp. - Segment focus
                • SWOT
              • 14.16 Pegasystems Inc.
                • Pegasystems Inc. - Overview
                • Pegasystems Inc. - Product / Service
                • Pegasystems Inc. - Key news
                • Pegasystems Inc. - Key offerings
                • SWOT
              • 14.17 Riskonnect Inc.
                • Riskonnect Inc. - Overview
                • Riskonnect Inc. - Product / Service
                • Riskonnect Inc. - Key offerings
                • SWOT
              • 14.18 SAP SE
                • SAP SE - Overview
                • SAP SE - Business segments
                • SAP SE - Key news
                • SAP SE - Key offerings
                • SAP SE - Segment focus
                • SWOT

              15 Appendix

              • 15.1 Scope of the report
                • 15.2 Inclusions and exclusions checklist
                  • Inclusions checklist
                  • Exclusions checklist
                • 15.3 Currency conversion rates for US$
                  • Currency conversion rates for US$
                • 15.4 Research methodology
                  • Research methodology
                • 15.5 Data procurement
                  • Information sources
                • 15.6 Data validation
                  • Data validation
                • 15.7 Validation techniques employed for market sizing
                  • Validation techniques employed for market sizing
                • 15.8 Data synthesis
                  • Data synthesis
                • 15.9 360 degree market analysis
                  • 360 degree market analysis
                • 15.10 List of abbreviations
                  • List of abbreviations

                Research Methodology

                Technavio presents a detailed picture of the market by way of study, synthesis, and summation of data from multiple sources. The analysts have presented the various facets of the market with a particular focus on identifying the key industry influencers. The data thus presented is comprehensive, reliable, and the result of extensive research, both primary and secondary.

                INFORMATION SOURCES

                Primary sources

                • Manufacturers and suppliers
                • Channel partners
                • Industry experts
                • Strategic decision makers

                Secondary sources

                • Industry journals and periodicals
                • Government data
                • Financial reports of key industry players
                • Historical data
                • Press releases

                DATA ANALYSIS

                Data Synthesis

                • Collation of data
                • Estimation of key figures
                • Analysis of derived insights

                Data Validation

                • Triangulation with data models
                • Reference against proprietary databases
                • Corroboration with industry experts

                REPORT WRITING

                Qualitative

                • Market drivers
                • Market challenges
                • Market trends
                • Five forces analysis

                Quantitative

                • Market size and forecast
                • Market segmentation
                • Geographical insights
                • Competitive landscape

                Interested in this report?

                Get your sample now to see our research methodology and insights!

                Download Now

                Frequently Asked Questions

                Policy Management Software market growth will increase by $ 1373.8 mn during 2024-2028 .

                The Policy Management Software market is expected to grow at a CAGR of 11.74% during 2024-2028 .

                Policy Management Software market is segmented by Deployment( On-premises, Cloud based) End-user( Banking and financial services, Insurance, Healthcare, Government, Others)

                Aptien Labs s.r.o., Azati, ComplianceBridge Corp., ConvergePoint Inc., Damco Group, Duck Creek Technologies LLC, EIS Group Inc., Fadata, Guidewire Software Inc., Hyland Software Inc., Insurity LLC, Majesco, MetricStream Inc., Mitratech Holdings Inc., OneShield, OneTrust LLC, Open Document Management System S.L., Oracle Corp., Pegasystems Inc., QUALEX CORP, Riskonnect Inc., RLDatix Global, SAP SE, SAPIENS INTERNATIONAL CORP. N.V, Verisk Analytics Inc., Workiva Inc. are a few of the key vendors in the Policy Management Software market.

                North America will register the highest growth rate of 35% among the other regions. Therefore, the Policy Management Software market in North America is expected to garner significant business opportunities for the vendors during the forecast period.

                US, China, UK

                • Rise in frequency of data breaches among various industriesThe surge in data breaches has prompted organizations to reevaluate their approach to policy management is the driving factor this market.
                • placing increased emphasis on ensuring the security and compliance of sensitive information. This shift has led to a growing demand for policy management software that offers advanced security features is the driving factor this market.
                • such as access controls is the driving factor this market.
                • encryption is the driving factor this market.
                • and audit trails is the driving factor this market.
                • to safeguard critical policies and associated data from unauthorized access and potential breaches. For instance is the driving factor this market.
                • in 2023 is the driving factor this market.
                • the number of reported data breaches in the United States increased to 3 is the driving factor this market.
                • 205 is the driving factor this market.
                • which is a 78% increase from 2022 and a 72% increase from 2021. These breaches negatively affected an estimated 353 is the driving factor this market.
                • 027 is the driving factor this market.
                • 892 people. In Q3 2023 is the driving factor this market.
                • there were almost 150 data breaches per thousand people in the US is the driving factor this market.
                • making it one of the countries with a high density of data breaches. Similarly is the driving factor this market.
                • according to The Hindu operated by THG Publishing Pvt Ltd. is the driving factor this market.
                • India was among the top five countries most breached in 2023. The average cost of a data breach in India has also been increasing is the driving factor this market.
                • reaching $2.18 million in 2023 is the driving factor this market.
                • which is a 28% increase from the previous three years.The escalating number of data breaches has heightened the focus on compliance requirements across industries and jurisdictions. Organizations are seeking policy management solutions equipped with features that facilitate adherence to data protection regulations is the driving factor this market.
                • industry standards is the driving factor this market.
                • and internal policies. As a result is the driving factor this market.
                • the market has seen a trend towards the integration of compliance management capabilities within policy management software is the driving factor this market.
                • enabling organizations to streamline compliance efforts and mitigate the risk of non-compliance-related data breaches. Moreover is the driving factor this market.
                • the rise in data breaches has led to a greater recognition of the need for comprehensive incident response and post-breach management capabilities within policy management software. Organizations are seeking solutions that facilitate the efficient management of policy-related adversities is the driving factor this market.
                • including data breaches is the driving factor this market.
                • and support the implementation of corrective measures to mitigate the impact and prevent future occurrences. Thus is the driving factor this market.
                • the above-mentioned factors are expected to increase the adoption of policy management software is the driving factor this market.
                • which will propel the growth of the global policy management software market during the forecast period. is the driving factor this market.

                The Policy Management Software market vendors should focus on grabbing business opportunities from the On-premises segment as it accounted for the largest market share in the base year.