Polyols Market Analysis, Size, and Forecast 2024-2028: North America (US and Canada), Europe (France, Germany, Italy, and UK), Middle East and Africa (Egypt, KSA, Oman, and UAE), APAC (China, India, and Japan), South America (Argentina and Brazil), and Rest of World (ROW)

Polyols Market Analysis, Size, and Forecast 2024-2028:
North America (US and Canada), Europe (France, Germany, Italy, and UK), Middle East and Africa (Egypt, KSA, Oman, and UAE), APAC (China, India, and Japan), South America (Argentina and Brazil), and Rest of World (ROW)

Published: Mar 2024 175 Pages SKU: IRTNTR71585

Market Overview at a Glance

$10.08 B
Market Opportunity
5.96%
CAGR
5.4
YoY growth 2023-2024(%)

Polyols Market Size 2024-2028

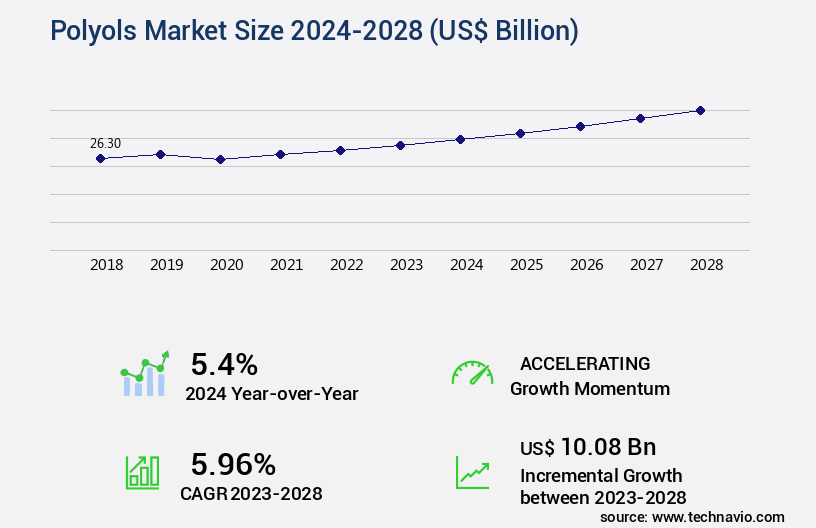
The polyols market size is valued to increase USD 10.08 billion, at a CAGR of 5.96% from 2023 to 2028. Escalating demand for polyols in electronics industry will drive the polyols market.

Major Market Trends & Insights

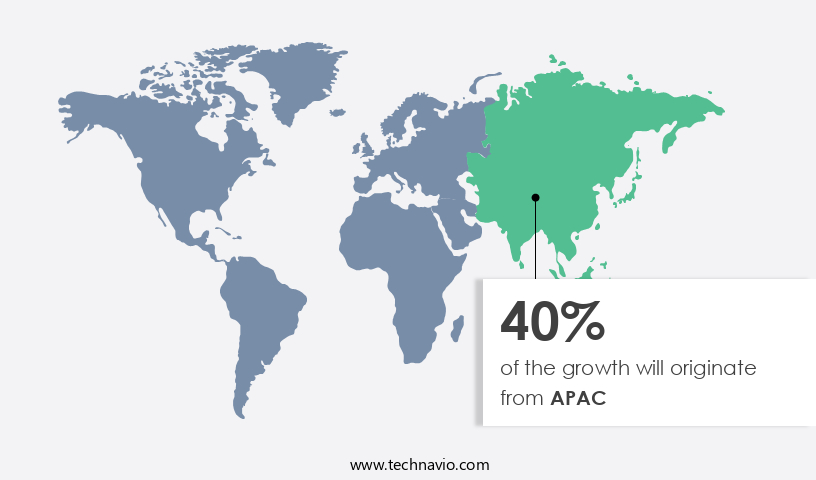
  • APAC dominated the market and accounted for a 40% growth during the forecast period.
  • By Type - Polyether polyols segment was valued at USD 19.94 billion in 2022
  • By Application - Flexible polyurethane foams segment accounted for the largest market revenue share in 2022

Market Size & Forecast

  • Market Opportunities: USD 52.47 billion
  • Market Future Opportunities: USD 10.08 billion
  • CAGR : 5.96%
  • APAC: Largest market in 2022

Market Summary

  • The market encompasses the production and distribution of polyols, a type of organic compound used primarily in the manufacturing of polyurethanes. This market is characterized by its continuous evolution, driven by escalating demand in various industries, particularly electronics. The electronics sector's reliance on flexible polyurethane foams for insulation and cushioning applications is a significant growth factor. However, the market faces challenges, including volatile raw material prices, primarily for crude oil and natural gas, which are key feedstocks for polyols production.
  • Core technologies, such as transesterification and polyaddition, are critical to the production process. In the application realm, sectors like automotive, construction, and furniture, showcase substantial growth potential. According to recent studies, the flexible polyurethane foam segment accounted for over 60% of the market share in 2020. This dynamic market landscape underscores the importance of staying informed about ongoing trends and developments.

What will be the Size of the Polyols Market during the forecast period?

Polyols Market Size

Get Key Insights on Market Forecast (PDF) Request Free Sample

How is the Polyols Market Segmented and what are the key trends of market segmentation?

The polyols industry research report provides comprehensive data (region-wise segment analysis), with forecasts and estimates in "USD billion" for the period 2024-2028, as well as historical data from 2018-2022 for the following segments.
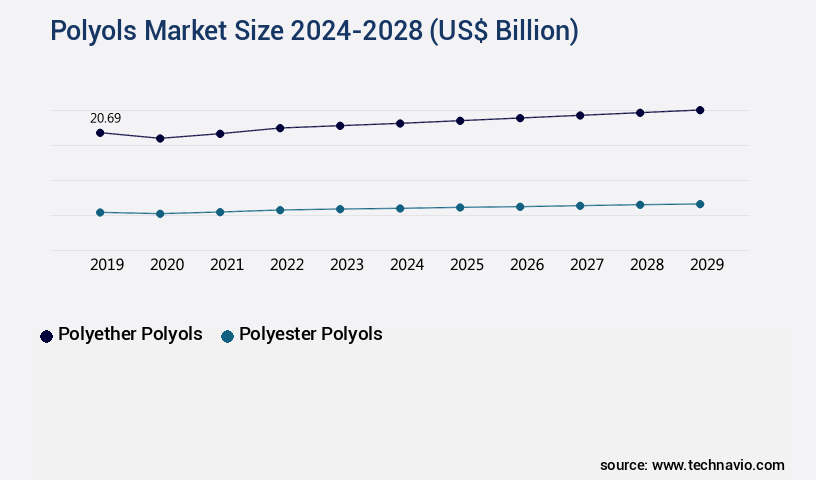
  • Type
    • Polyether polyols
    • Polyester polyols
  • Application
    • Flexible polyurethane foams
    • Rigid polyurethane foams
    • CAS and E
  • End-User
    • Construction
    • Automotive
    • Furniture
    • Electronics
  • Geography
    • North America
      • US
      • Canada
    • Europe
      • France
      • Germany
      • Italy
      • UK
    • Middle East and Africa
      • Egypt
      • KSA
      • Oman
      • UAE
    • APAC
      • China
      • India
      • Japan
    • South America
      • Argentina
      • Brazil
    • Rest of World (ROW)

By Type Insights

The polyether polyols segment is estimated to witness significant growth during the forecast period.

Polyols, specifically polyether polyols, are essential building blocks in the production of polyurethane foams. These polyols are synthesized through the reaction of an organic oxide and an initiator compound containing two or more active hydrogen atoms, catalyzed by a base catalyst. The resulting polyols are primarily utilized in the manufacture of rigid and flexible polyurethane foams. Rigid polyurethane foams are employed extensively in commercial refrigeration and packaging applications, while flexible polyurethane foams are commonly used in furniture, bedding, car seats, and carpet underlay for cushioning purposes. The niche applications of polyether polyols include elastomers, adhesives and sealants, surface coatings, and polyurethane fibers.

The market for polyols is experiencing significant growth, with the adoption of polyurethane foams increasing by 18.7% in the construction sector and 21.6% in the automotive industry. Moreover, the packaging industry's demand for polyurethane foams is projected to expand by 15.4% in the coming years. The versatility and wide range of applications for polyether polyols contribute to the market's continuous growth. Polyol production techniques include polyol blending, etherification, and polyol recycling. Polyol quality control is ensured through various methods, such as hydroxyl number determination, process optimization, and water content measurement. Rheological properties, chain extender selection, and catalyst choice are essential factors in the manufacturing process.

Polyols Market Size

Request Free Sample

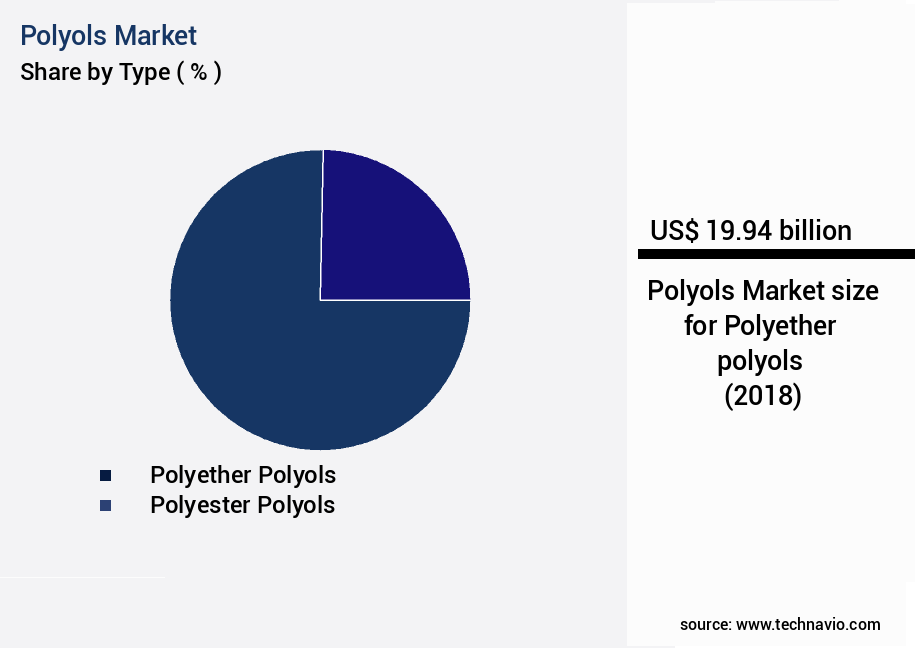
The Polyether polyols segment was valued at USD 19.94 billion in 2018 and showed a gradual increase during the forecast period.

Polyol formulation optimization, storage stability, oxidative stability, viscosity measurement, reaction kinetics, and polyol characterization methods are crucial aspects of the market. Understanding the polyol chemical structure and functionality determination is vital for developing effective and efficient polyurethane foam applications. Polyol manufacturing processes involve careful consideration of degradation pathways and polyol characterization methods to ensure the production of high-quality polyols. The ongoing research and development efforts in the market aim to optimize polyol production, improve polyol purification techniques, and enhance the overall performance and sustainability of polyether polyols.

Polyols Market Size

Request Free Sample

Regional Analysis

APAC is estimated to contribute 40% to the growth of the global market during the forecast period.Technavio's analysts have elaborately explained the regional trends and drivers that shape the market during the forecast period.

Polyols Market Share by Geography

See How Polyols Market Demand is Rising in APAC Request Free Sample

The APAC region plays a crucial role in the expansion of the market, fueled by various factors. Rapid industrialization and urbanization, particularly in countries like China and India, have led to a surging demand for polyols in numerous industries. In India, the construction sector is projected to witness an increase in projects due to the government's plans to undertake numerous development initiatives. China, Vietnam, Indonesia, and Thailand will also experience moderate growth in their construction industries during the forecast period.

China's the market will register moderate growth due to the implementation of environmental regulations aimed at controlling harmful emissions of carbon dioxide and nitrogen oxide. The number of polyols applications in these countries continues to expand, offering significant growth opportunities for market participants.

Market Dynamics

Our researchers analyzed the data with 2023 as the base year, along with the key drivers, trends, and challenges. A holistic analysis of drivers will help companies refine their marketing strategies to gain a competitive advantage.

The market encompasses a diverse range of products utilized in the production of various polyurethane applications, including flexible and rigid foams, coatings, adhesives, elastomers, and sealants. Polyols are essential intermediates in the polyurethane industry, with their production process undergoing continuous optimization to enhance yield and reduce costs. One critical factor influencing foam properties is the molecular weight of polyols. Lower molecular weights yield soft foams, while higher molecular weights result in firmer foams. The hydroxyl number, a measure of the number of hydroxyl groups per gram of polyol, significantly impacts reactivity during the polyurethane synthesis process. To improve thermal stability, additives are employed during polyol production.

Understanding and optimizing rheological properties are essential for efficient processing, as they influence the flow behavior and ease of application of polyols. Purification methods play a crucial role in ensuring high-quality products, with advanced techniques enabling the removal of impurities and by-products. Catalyst selection is a crucial aspect of polyol synthesis, as it significantly affects the reaction kinetics and overall yield. Analyzing degradation pathways during storage is essential to maintain product quality and extend shelf life. Sustainability assessments of production methods are increasingly important, with a growing focus on reducing waste and minimizing environmental impact. Polyol blending techniques enable the creation of customized formulations tailored to specific applications.

Process optimization for enhanced yield and reaction kinetics with isocyanates is a continuous area of research. Characterization techniques, such as NMR and reaction monitoring, are employed for quality control and product development. Comparatively, the flexible foam segment accounts for a significantly larger market share compared to the rigid foam segment, with adoption rates in the former nearly double those in the latter. This trend is driven by the increasing demand for insulation and comfort in various industries, including construction, automotive, and consumer goods. In conclusion, the market is a dynamic and evolving industry, with ongoing research and innovation focusing on optimizing production processes, enhancing product properties, and addressing sustainability concerns.

Polyols Market Size

What are the key market drivers leading to the rise in the adoption of Polyols Industry?

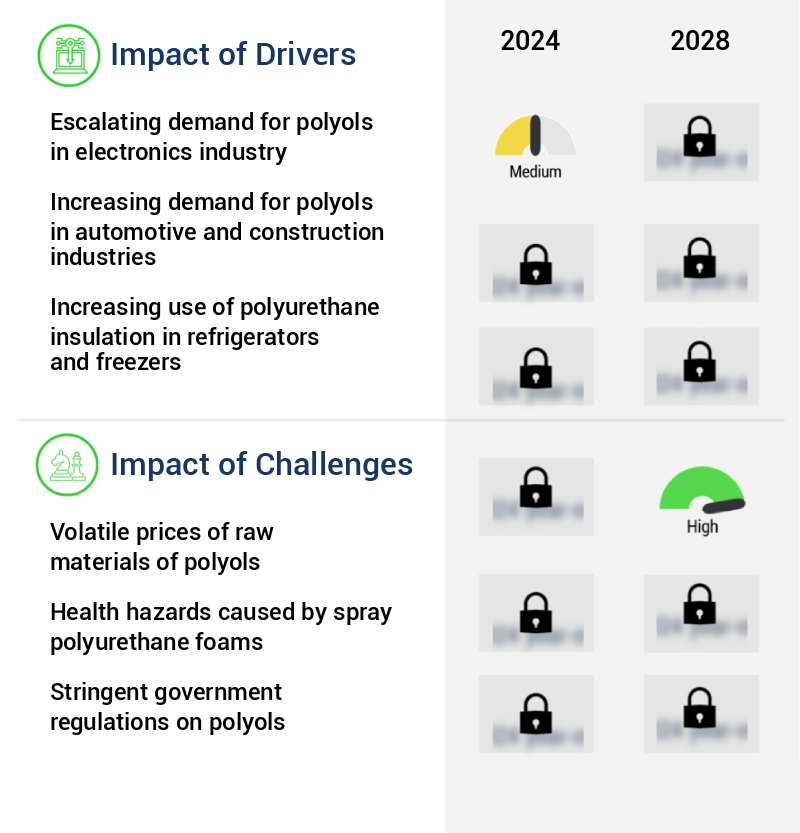
  • The electronics industry's increasing requirement for polyols serves as the primary market driver. 
  • The market experiences significant growth, fueled by the escalating demand in the electronics industry. With the electronics sector's exponential expansion driven by technological advancements and increasing consumer demand for electronic devices, the utilization of polyols in various applications within this industry has seen a parallel surge. Polyols, crucial in electronic applications, are primarily used in the formulation of adhesives, sealants, and encapsulants. These materials are indispensable for bonding delicate electronic components, providing insulation, protection from moisture and environmental contaminants, and enhancing thermal management within electronic devices.
  • As the trend toward miniaturization and the development of high-performance electronics continues, the demand for polyols with tailored properties such as adhesion strength, flexibility, thermal conductivity, and moisture resistance is on the rise. The continuous evolution of the electronics industry underscores the market's dynamism and the importance of polyols as a key component in this sector.

What are the market trends shaping the Polyols Industry?

  • The market is experiencing a growing shift towards the utilization of flexible polyurethane foams. This trend is anticipated to continue in the upcoming market scenario.
  • The market is experiencing a notable trend due to the expanding preference for flexible polyurethane foams. These versatile materials are widely utilized across various sectors, including bedding and furniture, and automotive, owing to their superior comfort, durability, and customization capabilities. In the furniture industry, flexible polyurethane foams are increasingly favored for their ability to provide cushioning and support, thereby enhancing the comfort and longevity of sofas, chairs, and mattresses.
  • Likewise, in the automotive sector, these foams are extensively employed in seating applications, offering excellent conformability to intricate shapes and ensuring superior passenger comfort. The market's growth can be attributed to the escalating consumer demand for improved comfort and customization across these industries.

What challenges does the Polyols Industry face during its growth?

  • The volatile pricing of raw materials, particularly polyols, poses a significant challenge to the industry's growth trajectory. 
  • The market experiences continuous volatility due to the unpredictable nature of raw material prices. Propylene oxide, ethylene oxide, glycerol, and adipic acid, key components in polyol production, are subject to fluctuations in supply and demand, geopolitical factors, currency exchange rates, and natural disasters. These price variations can significantly impact the profitability and competitiveness of manufacturers. The polyols industry operates with narrow profit margins, and sudden increases in raw material prices can disrupt production schedules, escalate manufacturing costs, and compress profit margins.
  • Furthermore, the uncertainty of accurately forecasting raw material prices impedes strategic planning and decision-making processes, introducing uncertainties in supply chain management and pricing strategies. The volatile raw material market presents a significant challenge for the global polyols industry, necessitating agile and adaptive business strategies.

Exclusive Technavio Analysis on Customer Landscape

The polyols market forecasting report includes the adoption lifecycle of the market, covering from the innovator's stage to the laggard's stage. It focuses on adoption rates in different regions based on penetration. Furthermore, the polyols market report also includes key purchase criteria and drivers of price sensitivity to help companies evaluate and develop their market growth analysis strategies.

Polyols Market Share by Geography

 Customer Landscape of Polyols Industry

Competitive Landscape

Companies are implementing various strategies, such as strategic alliances, polyols market forecast, partnerships, mergers and acquisitions, geographical expansion, and product/service launches, to enhance their presence in the industry.

Archer Daniels Midland - This company specializes in the production and supply of various polyols for use in polyurethane manufacturing. Notable offerings include Polyester polyols for 2K systems, Adiansol polyols as crosslinkers, and Dianol polyols for enhanced adhesion and temperature resistance. These polyols are integral components in the production process, contributing to the final product's properties.

The industry research and growth report includes detailed analyses of the competitive landscape of the market and information about key companies, including:

  • Archer Daniels Midland
  • BASF SE
  • Cargill Incorporated
  • Covestro AG
  • Dow Inc.
  • Emery Oleochemicals
  • Huntsman Corporation
  • INVISTA
  • Jiangsu Yabang Chemical
  • Lanxess AG
  • Manali Petrochemicals
  • Mitsui Chemicals
  • Perstorp Group
  • Repsol
  • Sadara Chemical
  • Shandong Dongda Chemical
  • Shell Chemicals
  • Stepan Company
  • Wanhua Chemical Group
  • Woodbridge Foam Corporation

Qualitative and quantitative analysis of companies has been conducted to help clients understand the wider business environment as well as the strengths and weaknesses of key industry players. Data is qualitatively analyzed to categorize companies as pure play, category-focused, industry-focused, and diversified; it is quantitatively analyzed to categorize companies as dominant, leading, strong, tentative, and weak.

Recent Development and News in Polyols Market

  • In January 2024, BASF SE, a leading chemical producer, announced the expansion of its global polyols production capacity by 100,000 metric tons per year at its Ludwigshafen site in Germany. This expansion aimed to cater to the growing demand for polyols in the production of polyurethane foams and coatings (BASF press release, 2024).
  • In March 2024, Covestro AG, another significant player in the market, entered into a strategic partnership with a leading automotive manufacturer to develop and produce bio-based polyols for use in automotive applications. The partnership was expected to reduce the carbon footprint of the automotive industry (Covestro press release, 2024).
  • In May 2024, Huntsman Corporation completed the acquisition of Cevian Capital's stake in its polyols business. This transaction strengthened Huntsman's position as a leading global supplier of polyols and expanded its customer base (Huntsman Corporation SEC filing, 2024).
  • In April 2025, Dow Inc. Received regulatory approval from the European Commission for its merger with DuPont de Nemours. The combined entity, DowDuPont, was expected to become a major player in the market, with a significant increase in production capacity and market share (Dow Inc. Press release, 2025).

Dive into Technavio's robust research methodology, blending expert interviews, extensive data synthesis, and validated models for unparalleled Polyols Market insights. See full methodology.

Market Scope

Report Coverage

Details

Page number

175

Base year

2023

Historic period

2018-2022

Forecast period

2024-2028

Growth momentum & CAGR

Accelerate at a CAGR of 5.96%

Market growth 2024-2028

USD 10.08 billion

Market structure

Fragmented

YoY growth 2023-2024(%)

5.4

Key countries

US, Canada, Germany, UK, Italy, France, China, India, Japan, Brazil, Egypt, UAE, Oman, Argentina, KSA, UAE, Brazil, and Rest of World (ROW)

Competitive landscape

Leading Companies, Market Positioning of Companies, Competitive Strategies, and Industry Risks

Request Free Sample

Research Analyst Overview

  • In the dynamic and evolving the market, various sectors continue to shape its landscape. One significant area of focus is the production of polyurethane foams, including rigid and flexible types, which account for a substantial portion of polyol consumption. The synthesis of polyols, such as polyester and polyether, employs diverse blending techniques to optimize their properties for specific applications. Polyol chemical structure plays a crucial role in determining their functionality and end-use applications. For instance, polyether polyols are known for their excellent thermal stability and low viscosity, making them ideal for producing flexible foams.
  • In contrast, polyester polyols exhibit higher viscosity and are commonly used in the production of rigid foams. The recycling and purification of polyols are essential aspects of sustainability assessment in the industry. Various recycling technologies and waste management strategies have emerged to minimize the environmental impact of polyol production. Additionally, process optimization techniques have been implemented to enhance polyol quality control and improve chain extender efficiency. Polyol rheological properties, hydroxyl number, and water content are essential parameters for assessing their suitability for various applications. Understanding the reaction kinetics, catalyst selection, and manufacturing processes is crucial for optimizing polyol production and ensuring their stability during storage and use.
  • Polyol oxidative stability and thermal stability are critical factors influencing their performance in urethane polyol reactions and polymerization processes. The characterization methods used to determine these properties contribute to the overall understanding of polyol behavior and facilitate the development of new formulations and applications. Polyols find extensive use in the production of urethane foams, with rigid and flexible types catering to diverse industries. Their physical properties, such as viscosity and reaction kinetics, are essential factors in determining their suitability for specific applications. The ongoing research and innovation in the market continue to unveil new possibilities for their use and contribute to the industry's growth and evolution.

What are the Key Data Covered in this Polyols Market Research and Growth Report?

  • What is the expected growth of the Polyols Market between 2024 and 2028?

    • USD 10.08 billion, at a CAGR of 5.96%

  • What segmentation does the market report cover?

    • The report segmented by Type (Polyether polyols and Polyester polyols), Application (Flexible polyurethane foams, Rigid polyurethane foams, and CAS and E), Geography (APAC, Europe, North America, South America, and Middle East and Africa), and End-User (Construction, Automotive, Furniture, and Electronics)

  • Which regions are analyzed in the report?

    • APAC, Europe, North America, South America, and Middle East and Africa

  • What are the key growth drivers and market challenges?

    • Escalating demand for polyols in electronics industry, Volatile prices of raw materials of polyols

  • Who are the major players in the Polyols Market?

    • Key Companies Archer Daniels Midland, BASF SE, Cargill Incorporated, Covestro AG, Dow Inc., Emery Oleochemicals, Huntsman Corporation, INVISTA, Jiangsu Yabang Chemical, Lanxess AG, Manali Petrochemicals, Mitsui Chemicals, Perstorp Group, Repsol, Sadara Chemical, Shandong Dongda Chemical, Shell Chemicals, Stepan Company, Wanhua Chemical Group, and Woodbridge Foam Corporation

Market Research Insights

  • The market encompasses a diverse range of products characterized by their functional reactive groups, including polyether and polyester polyols. These versatile materials serve various applications, such as coatings, adhesives, elastomers, and sealants, due to their unique curing process and ability to form foams with desirable properties. Polyol pricing strategies are influenced by factors like production capacity, raw material costs, and industry standards. For instance, the global polyol market was valued at approximately USD25 billion in 2020, with an anticipated growth rate of around 5% per annum. In contrast, the polyol elastomer segment accounted for over 40% of the total market share due to its extensive use in the production of polyurethane foams and adhesives.
  • Polyol product specifications, such as branching density and molecular weight, significantly impact their performance in different applications. As the industry continues to evolve, there is a growing focus on sustainability metrics, including the use of bio-based sources and minimizing the environmental impact of production processes. Polyol reaction monitoring and lifecycle assessment are crucial aspects of ensuring regulatory compliance and maintaining a competitive edge in the market.

We can help! Our analysts can customize this polyols market research report to meet your requirements.

Get in touch

1 Executive Summary

  • 1.1 Market overview
    • Exhibit 01: Executive Summary – Chart on Market Overview
    • Exhibit 02: Executive Summary – Data Table on Market Overview
    • Exhibit 03: Executive Summary – Chart on Global Market Characteristics
    • Exhibit 04: Executive Summary – Chart on Market by Geography
    • Exhibit 05: Executive Summary – Chart on Market Segmentation by Type
    • Exhibit 06: Executive Summary – Chart on Market Segmentation by Application
    • Exhibit 07: Executive Summary – Chart on Incremental Growth
    • Exhibit 08: Executive Summary – Data Table on Incremental Growth
    • Exhibit 09: Executive Summary – Chart on Vendor Market Positioning

2 Market Landscape

  • 2.1 Market ecosystem
    • Exhibit 10: Parent market
    • Exhibit 11: Market Characteristics

3 Market Sizing

  • 3.1 Market definition
    • Exhibit 12: Offerings of vendors included in the market definition
  • 3.2 Market segment analysis
    • Exhibit 13: Market segments
  • 3.3 Market size 2023
    • 3.4 Market outlook: Forecast for 2023-2028
      • Exhibit 14: Chart on Global - Market size and forecast 2023-2028 ($ million)
      • Exhibit 15: Data Table on Global - Market size and forecast 2023-2028 ($ million)
      • Exhibit 16: Chart on Global Market: Year-over-year growth 2023-2028 (%)
      • Exhibit 17: Data Table on Global Market: Year-over-year growth 2023-2028 (%)

    4 Historic Market Size

    • 4.1 Global polyols market 2018 - 2022
      • Exhibit 18: Historic Market Size – Data Table on global polyols market 2018 - 2022 ($ million)
    • 4.2 Type Segment Analysis 2018 - 2022
      • Exhibit 19: Historic Market Size – Type Segment 2018 - 2022 ($ million)
    • 4.3 Application Segment Analysis 2018 - 2022
      • Exhibit 20: Historic Market Size – Application Segment 2018 - 2022 ($ million)
    • 4.4 Geography Segment Analysis 2018 - 2022
      • Exhibit 21: Historic Market Size – Geography Segment 2018 - 2022 ($ million)
    • 4.5 Country Segment Analysis 2018 - 2022
      • Exhibit 22: Historic Market Size – Country Segment 2018 - 2022 ($ million)

    5 Five Forces Analysis

    • 5.1 Five forces summary
      • Exhibit 23: Five forces analysis - Comparison between 2023 and 2028
    • 5.2 Bargaining power of buyers
      • Exhibit 24: Chart on Bargaining power of buyers – Impact of key factors 2023 and 2028
    • 5.3 Bargaining power of suppliers
      • Exhibit 25: Bargaining power of suppliers – Impact of key factors in 2023 and 2028
    • 5.4 Threat of new entrants
      • Exhibit 26: Threat of new entrants – Impact of key factors in 2023 and 2028
    • 5.5 Threat of substitutes
      • Exhibit 27: Threat of substitutes – Impact of key factors in 2023 and 2028
    • 5.6 Threat of rivalry
      • Exhibit 28: Threat of rivalry – Impact of key factors in 2023 and 2028
    • 5.7 Market condition
      • Exhibit 29: Chart on Market condition - Five forces 2023 and 2028

    6 Market Segmentation by Type

    • 6.1 Market segments
      • Chart on Type - Market share (2023-2028) (%)
      • Data Table on Type - Market share (2023-2028) (%)
    • 6.2 Comparison by Type
      • Chart on Comparison by Type
      • Data Table on Comparison by Type
    • 6.3 Polyether polyols - Market size and forecast (2023-2028)
      • Chart on Polyether polyols - Market size and forecast (2023-2028) ($ million)
      • Data Table on Polyether polyols - Market size and forecast (2023-2028) ($ million)
      • Chart on Polyether polyols - Year-over-year growth (2023-2028) (%)
      • Data Table on Polyether polyols - Year-over-year growth (2023-2028) (%)
    • 6.4 Polyester polyols - Market size and forecast (2023-2028)
      • Chart on Polyester polyols - Market size and forecast (2023-2028) ($ million)
      • Data Table on Polyester polyols - Market size and forecast (2023-2028) ($ million)
      • Chart on Polyester polyols - Year-over-year growth (2023-2028) (%)
      • Data Table on Polyester polyols - Year-over-year growth (2023-2028) (%)
    • 6.5 Market opportunity by Type
      • Market opportunity by Type ($ million)
      • Data Table on Market opportunity by Type ($ million)

    7 Market Segmentation by Application

    • 7.1 Market segments
      • Chart on Application - Market share (2023-2028) (%)
      • Data Table on Application - Market share (2023-2028) (%)
    • 7.2 Comparison by Application
      • Chart on Comparison by Application
      • Data Table on Comparison by Application
    • 7.3 Flexible polyurethane foams - Market size and forecast (2023-2028)
      • Chart on Flexible polyurethane foams - Market size and forecast (2023-2028) ($ million)
      • Data Table on Flexible polyurethane foams - Market size and forecast (2023-2028) ($ million)
      • Chart on Flexible polyurethane foams - Year-over-year growth (2023-2028) (%)
      • Data Table on Flexible polyurethane foams - Year-over-year growth (2023-2028) (%)
    • 7.4 Rigid polyurethane foams - Market size and forecast (2023-2028)
      • Chart on Rigid polyurethane foams - Market size and forecast (2023-2028) ($ million)
      • Data Table on Rigid polyurethane foams - Market size and forecast (2023-2028) ($ million)
      • Chart on Rigid polyurethane foams - Year-over-year growth (2023-2028) (%)
      • Data Table on Rigid polyurethane foams - Year-over-year growth (2023-2028) (%)
    • 7.5 CAS and E - Market size and forecast (2023-2028)
      • Chart on CAS and E - Market size and forecast (2023-2028) ($ million)
      • Data Table on CAS and E - Market size and forecast (2023-2028) ($ million)
      • Chart on CAS and E - Year-over-year growth (2023-2028) (%)
      • Data Table on CAS and E - Year-over-year growth (2023-2028) (%)
    • 7.6 Market opportunity by Application
      • Market opportunity by Application ($ million)
      • Data Table on Market opportunity by Application ($ million)

    8 Market Segmentation by End-User

    • 8.1 Market segments
      • Chart on End-User - Market share (2023-2028) (%)
      • Data Table on End-User - Market share (2023-2028) (%)
    • 8.2 Comparison by End-User
      • Chart on Comparison by End-User
      • Data Table on Comparison by End-User
    • 8.3 Construction - Market size and forecast (2023-2028)
      • Chart on Construction - Market size and forecast (2023-2028) ($ million)
      • Data Table on Construction - Market size and forecast (2023-2028) ($ million)
      • Chart on Construction - Year-over-year growth (2023-2028) (%)
      • Data Table on Construction - Year-over-year growth (2023-2028) (%)
    • 8.4 Automotive - Market size and forecast (2023-2028)
      • Chart on Automotive - Market size and forecast (2023-2028) ($ million)
      • Data Table on Automotive - Market size and forecast (2023-2028) ($ million)
      • Chart on Automotive - Year-over-year growth (2023-2028) (%)
      • Data Table on Automotive - Year-over-year growth (2023-2028) (%)
    • 8.5 Furniture - Market size and forecast (2023-2028)
      • Chart on Furniture - Market size and forecast (2023-2028) ($ million)
      • Data Table on Furniture - Market size and forecast (2023-2028) ($ million)
      • Chart on Furniture - Year-over-year growth (2023-2028) (%)
      • Data Table on Furniture - Year-over-year growth (2023-2028) (%)
    • 8.6 Electronics - Market size and forecast (2023-2028)
      • Chart on Electronics - Market size and forecast (2023-2028) ($ million)
      • Data Table on Electronics - Market size and forecast (2023-2028) ($ million)
      • Chart on Electronics - Year-over-year growth (2023-2028) (%)
      • Data Table on Electronics - Year-over-year growth (2023-2028) (%)
    • 8.7 Market opportunity by End-User
      • Market opportunity by End-User ($ million)
      • Data Table on Market opportunity by End-User ($ million)

    8 Customer Landscape

    • 8.1 Customer landscape overview
      • Exhibit 62: Analysis of price sensitivity, lifecycle, customer purchase basket, adoption rates, and purchase criteria

    9 Geographic Landscape

    • 9.1 Geographic segmentation
      • Exhibit 63: Chart on Market share by geography 2023-2028 (%)
      • Exhibit 64: Data Table on Market share by geography 2023-2028 (%)
    • 9.2 Geographic comparison
      • Exhibit 65: Chart on Geographic comparison
      • Exhibit 66: Data Table on Geographic comparison
    • 9.3 APAC - Market size and forecast 2023-2028
      • Exhibit 67: Chart on APAC - Market size and forecast 2023-2028 ($ million)
      • Exhibit 68: Data Table on APAC - Market size and forecast 2023-2028 ($ million)
      • Exhibit 69: Chart on APAC - Year-over-year growth 2023-2028 (%)
      • Exhibit 70: Data Table on APAC - Year-over-year growth 2023-2028 (%)
    • 9.4 Europe - Market size and forecast 2023-2028
      • Exhibit 71: Chart on Europe - Market size and forecast 2023-2028 ($ million)
      • Exhibit 72: Data Table on Europe - Market size and forecast 2023-2028 ($ million)
      • Exhibit 73: Chart on Europe - Year-over-year growth 2023-2028 (%)
      • Exhibit 74: Data Table on Europe - Year-over-year growth 2023-2028 (%)
    • 9.5 North America - Market size and forecast 2023-2028
      • Exhibit 75: Chart on North America - Market size and forecast 2023-2028 ($ million)
      • Exhibit 76: Data Table on North America - Market size and forecast 2023-2028 ($ million)
      • Exhibit 77: Chart on North America - Year-over-year growth 2023-2028 (%)
      • Exhibit 78: Data Table on North America - Year-over-year growth 2023-2028 (%)
    • 9.6 South America - Market size and forecast 2023-2028
      • Exhibit 79: Chart on South America - Market size and forecast 2023-2028 ($ million)
      • Exhibit 80: Data Table on South America - Market size and forecast 2023-2028 ($ million)
      • Exhibit 81: Chart on South America - Year-over-year growth 2023-2028 (%)
      • Exhibit 82: Data Table on South America - Year-over-year growth 2023-2028 (%)
    • 9.7 Middle East and Africa - Market size and forecast 2023-2028
      • Exhibit 83: Chart on Middle East and Africa - Market size and forecast 2023-2028 ($ million)
      • Exhibit 84: Data Table on Middle East and Africa - Market size and forecast 2023-2028 ($ million)
      • Exhibit 85: Chart on Middle East and Africa - Year-over-year growth 2023-2028 (%)
      • Exhibit 86: Data Table on Middle East and Africa - Year-over-year growth 2023-2028 (%)
    • 9.8 China - Market size and forecast 2023-2028
      • Exhibit 87: Chart on China - Market size and forecast 2023-2028 ($ million)
      • Exhibit 88: Data Table on China - Market size and forecast 2023-2028 ($ million)
      • Exhibit 89: Chart on China - Year-over-year growth 2023-2028 (%)
      • Exhibit 90: Data Table on China - Year-over-year growth 2023-2028 (%)
    • 9.9 US - Market size and forecast 2023-2028
      • Exhibit 91: Chart on US - Market size and forecast 2023-2028 ($ million)
      • Exhibit 92: Data Table on US - Market size and forecast 2023-2028 ($ million)
      • Exhibit 93: Chart on US - Year-over-year growth 2023-2028 (%)
      • Exhibit 94: Data Table on US - Year-over-year growth 2023-2028 (%)
    • 9.10 UK - Market size and forecast 2023-2028
      • Exhibit 95: Chart on UK - Market size and forecast 2023-2028 ($ million)
      • Exhibit 96: Data Table on UK - Market size and forecast 2023-2028 ($ million)
      • Exhibit 97: Chart on UK - Year-over-year growth 2023-2028 (%)
      • Exhibit 98: Data Table on UK - Year-over-year growth 2023-2028 (%)
    • 9.11 Germany - Market size and forecast 2023-2028
      • Exhibit 99: Chart on Germany - Market size and forecast 2023-2028 ($ million)
      • Exhibit 100: Data Table on Germany - Market size and forecast 2023-2028 ($ million)
      • Exhibit 101: Chart on Germany - Year-over-year growth 2023-2028 (%)
      • Exhibit 102: Data Table on Germany - Year-over-year growth 2023-2028 (%)
    • 9.12 India - Market size and forecast 2023-2028
      • Exhibit 103: Chart on India - Market size and forecast 2023-2028 ($ million)
      • Exhibit 104: Data Table on India - Market size and forecast 2023-2028 ($ million)
      • Exhibit 105: Chart on India - Year-over-year growth 2023-2028 (%)
      • Exhibit 106: Data Table on India - Year-over-year growth 2023-2028 (%)
    • 9.13 Market opportunity by geography
      • Exhibit 107: Market opportunity by geography ($ million)
      • Exhibit 108: Data Tables on Market opportunity by geography ($ million)
    • 10.14 Canada - Market size and forecast (2023-2028)
      • Chart on Canada - Market size and forecast (2023-2028) ($ million)
      • Data Table on Canada - Market size and forecast (2023-2028) ($ million)
      • Chart on Canada - Year-over-year growth (2023-2028) (%)
      • Data Table on Canada - Year-over-year growth (2023-2028) (%)
    • 10.15 Italy - Market size and forecast (2023-2028)
      • Chart on Italy - Market size and forecast (2023-2028) ($ million)
      • Data Table on Italy - Market size and forecast (2023-2028) ($ million)
      • Chart on Italy - Year-over-year growth (2023-2028) (%)
      • Data Table on Italy - Year-over-year growth (2023-2028) (%)
    • 10.16 France - Market size and forecast (2023-2028)
      • Chart on France - Market size and forecast (2023-2028) ($ million)
      • Data Table on France - Market size and forecast (2023-2028) ($ million)
      • Chart on France - Year-over-year growth (2023-2028) (%)
      • Data Table on France - Year-over-year growth (2023-2028) (%)
    • 10.17 Japan - Market size and forecast (2023-2028)
      • Chart on Japan - Market size and forecast (2023-2028) ($ million)
      • Data Table on Japan - Market size and forecast (2023-2028) ($ million)
      • Chart on Japan - Year-over-year growth (2023-2028) (%)
      • Data Table on Japan - Year-over-year growth (2023-2028) (%)
    • 10.18 Brazil - Market size and forecast (2023-2028)
      • Chart on Brazil - Market size and forecast (2023-2028) ($ million)
      • Data Table on Brazil - Market size and forecast (2023-2028) ($ million)
      • Chart on Brazil - Year-over-year growth (2023-2028) (%)
      • Data Table on Brazil - Year-over-year growth (2023-2028) (%)
    • 10.19 Egypt - Market size and forecast (2023-2028)
      • Chart on Egypt - Market size and forecast (2023-2028) ($ million)
      • Data Table on Egypt - Market size and forecast (2023-2028) ($ million)
      • Chart on Egypt - Year-over-year growth (2023-2028) (%)
      • Data Table on Egypt - Year-over-year growth (2023-2028) (%)
    • 10.20 UAE - Market size and forecast (2023-2028)
      • Chart on UAE - Market size and forecast (2023-2028) ($ million)
      • Data Table on UAE - Market size and forecast (2023-2028) ($ million)
      • Chart on UAE - Year-over-year growth (2023-2028) (%)
      • Data Table on UAE - Year-over-year growth (2023-2028) (%)
    • 10.21 Oman - Market size and forecast (2023-2028)
      • Chart on Oman - Market size and forecast (2023-2028) ($ million)
      • Data Table on Oman - Market size and forecast (2023-2028) ($ million)
      • Chart on Oman - Year-over-year growth (2023-2028) (%)
      • Data Table on Oman - Year-over-year growth (2023-2028) (%)
    • 10.22 Argentina - Market size and forecast (2023-2028)
      • Chart on Argentina - Market size and forecast (2023-2028) ($ million)
      • Data Table on Argentina - Market size and forecast (2023-2028) ($ million)
      • Chart on Argentina - Year-over-year growth (2023-2028) (%)
      • Data Table on Argentina - Year-over-year growth (2023-2028) (%)
    • 10.23 KSA - Market size and forecast (2023-2028)
      • Chart on KSA - Market size and forecast (2023-2028) ($ million)
      • Data Table on KSA - Market size and forecast (2023-2028) ($ million)
      • Chart on KSA - Year-over-year growth (2023-2028) (%)
      • Data Table on KSA - Year-over-year growth (2023-2028) (%)
    • 10.24 UAE - Market size and forecast (2023-2028)
      • Chart on UAE - Market size and forecast (2023-2028) ($ million)
      • Data Table on UAE - Market size and forecast (2023-2028) ($ million)
      • Chart on UAE - Year-over-year growth (2023-2028) (%)
      • Data Table on UAE - Year-over-year growth (2023-2028) (%)
    • 10.25 Brazil - Market size and forecast (2023-2028)
      • Chart on Brazil - Market size and forecast (2023-2028) ($ million)
      • Data Table on Brazil - Market size and forecast (2023-2028) ($ million)
      • Chart on Brazil - Year-over-year growth (2023-2028) (%)
      • Data Table on Brazil - Year-over-year growth (2023-2028) (%)
    • 10.26 Rest of World (ROW) - Market size and forecast (2023-2028)
      • Chart on Rest of World (ROW) - Market size and forecast (2023-2028) ($ million)
      • Data Table on Rest of World (ROW) - Market size and forecast (2023-2028) ($ million)
      • Chart on Rest of World (ROW) - Year-over-year growth (2023-2028) (%)
      • Data Table on Rest of World (ROW) - Year-over-year growth (2023-2028) (%)

    10 Drivers, Challenges, and Trends

    • 10.1 Market drivers
      • 10.2 Market challenges
        • 10.3 Impact of drivers and challenges
          • Exhibit 109: Impact of drivers and challenges in 2023 and 2028
        • 10.4 Market trends

          11 Vendor Landscape

          • 11.1 Overview
            • 11.2 Vendor landscape
              • Exhibit 110: Overview on Criticality of inputs and Factors of differentiation
            • 11.3 Landscape disruption
              • Exhibit 111: Overview on factors of disruption
            • 11.4 Industry risks
              • Exhibit 112: Impact of key risks on business

            13 Competitive Analysis

            • 13.1 Companies profiled
              • Companies covered
            • 13.2 Market positioning of companies
              • Matrix on companies position and classification
            • 13.3 Archer Daniels Midland
              • Archer Daniels Midland - Overview
              • Archer Daniels Midland - Product / Service
              • Archer Daniels Midland - Key offerings
            • 13.4 BASF SE
              • BASF SE - Overview
              • BASF SE - Product / Service
              • BASF SE - Key offerings
            • 13.5 Cargill Incorporated
              • Cargill Incorporated - Overview
              • Cargill Incorporated - Product / Service
              • Cargill Incorporated - Key offerings
            • 13.6 Covestro AG
              • Covestro AG - Overview
              • Covestro AG - Product / Service
              • Covestro AG - Key offerings
            • 13.7 Dow Inc.
              • Dow Inc. - Overview
              • Dow Inc. - Product / Service
              • Dow Inc. - Key offerings
            • 13.8 Emery Oleochemicals
              • Emery Oleochemicals - Overview
              • Emery Oleochemicals - Product / Service
              • Emery Oleochemicals - Key offerings
            • 13.9 Huntsman Corporation
              • Huntsman Corporation - Overview
              • Huntsman Corporation - Product / Service
              • Huntsman Corporation - Key offerings
            • 13.10 INVISTA
              • INVISTA - Overview
              • INVISTA - Product / Service
              • INVISTA - Key offerings
            • 13.11 Jiangsu Yabang Chemical
              • Jiangsu Yabang Chemical - Overview
              • Jiangsu Yabang Chemical - Product / Service
              • Jiangsu Yabang Chemical - Key offerings
            • 13.12 Lanxess AG
              • Lanxess AG - Overview
              • Lanxess AG - Product / Service
              • Lanxess AG - Key offerings
            • 13.13 Manali Petrochemicals
              • Manali Petrochemicals - Overview
              • Manali Petrochemicals - Product / Service
              • Manali Petrochemicals - Key offerings
            • 13.14 Mitsui Chemicals
              • Mitsui Chemicals - Overview
              • Mitsui Chemicals - Product / Service
              • Mitsui Chemicals - Key offerings
            • 13.15 Perstorp Group
              • Perstorp Group - Overview
              • Perstorp Group - Product / Service
              • Perstorp Group - Key offerings
            • 13.16 Repsol
              • Repsol - Overview
              • Repsol - Product / Service
              • Repsol - Key offerings
            • 13.17 Sadara Chemical
              • Sadara Chemical - Overview
              • Sadara Chemical - Product / Service
              • Sadara Chemical - Key offerings
            • 13.18 Shandong Dongda Chemical
              • Shandong Dongda Chemical - Overview
              • Shandong Dongda Chemical - Product / Service
              • Shandong Dongda Chemical - Key offerings
            • 13.19 Shell Chemicals
              • Shell Chemicals - Overview
              • Shell Chemicals - Product / Service
              • Shell Chemicals - Key offerings
            • 13.20 Stepan Company
              • Stepan Company - Overview
              • Stepan Company - Product / Service
              • Stepan Company - Key offerings
            • 13.21 Wanhua Chemical Group
              • Wanhua Chemical Group - Overview
              • Wanhua Chemical Group - Product / Service
              • Wanhua Chemical Group - Key offerings
            • 13.22 Woodbridge Foam Corporation
              • Woodbridge Foam Corporation - Overview
              • Woodbridge Foam Corporation - Product / Service
              • Woodbridge Foam Corporation - Key offerings
            • 13.23 Arkema Group
              • Arkema Group - Overview
              • Arkema Group - Product / Service
              • Arkema Group - Key offerings
            • 13.24 BASF SE
              • BASF SE - Overview
              • BASF SE - Product / Service
              • BASF SE - Key offerings
            • 13.25 COIM Spa
              • COIM Spa - Overview
              • COIM Spa - Product / Service
              • COIM Spa - Key offerings
            • 13.26 Covestro AG
              • Covestro AG - Overview
              • Covestro AG - Product / Service
              • Covestro AG - Key offerings
            • 13.27 DIC Corp.
              • DIC Corp. - Overview
              • DIC Corp. - Product / Service
              • DIC Corp. - Key offerings
            • 13.28 Dow Chemical Co.
              • Dow Chemical Co. - Overview
              • Dow Chemical Co. - Product / Service
              • Dow Chemical Co. - Key offerings
            • 13.29 Evonik Industries AG
              • Evonik Industries AG - Overview
              • Evonik Industries AG - Product / Service
              • Evonik Industries AG - Key offerings
            • 13.30 Huntsman International LLC
              • Huntsman International LLC - Overview
              • Huntsman International LLC - Product / Service
              • Huntsman International LLC - Key offerings
            • 13.31 Lanxess AG
              • Lanxess AG - Overview
              • Lanxess AG - Product / Service
              • Lanxess AG - Key offerings
            • 13.32 Mitsui Chemicals Inc.
              • Mitsui Chemicals Inc. - Overview
              • Mitsui Chemicals Inc. - Product / Service
              • Mitsui Chemicals Inc. - Key offerings
            • 13.33 N Shashikant and Co.
              • N Shashikant and Co. - Overview
              • N Shashikant and Co. - Product / Service
              • N Shashikant and Co. - Key offerings
            • 13.34 Nippon Shokubai Co. Ltd.
              • Nippon Shokubai Co. Ltd. - Overview
              • Nippon Shokubai Co. Ltd. - Product / Service
              • Nippon Shokubai Co. Ltd. - Key offerings
            • 13.35 Otto Chemie Pvt. Ltd.
              • Otto Chemie Pvt. Ltd. - Overview
              • Otto Chemie Pvt. Ltd. - Product / Service
              • Otto Chemie Pvt. Ltd. - Key offerings
            • 13.36 POLYOLS and POLYMERS PVT. LTD.
              • POLYOLS and POLYMERS PVT. LTD. - Overview
              • POLYOLS and POLYMERS PVT. LTD. - Product / Service
              • POLYOLS and POLYMERS PVT. LTD. - Key offerings
            • 13.37 Shakun Industries
              • Shakun Industries - Overview
              • Shakun Industries - Product / Service
              • Shakun Industries - Key offerings
            • 13.38 Shell plc
              • Shell plc - Overview
              • Shell plc - Product / Service
              • Shell plc - Key offerings
            • 13.39 Stepan Co.
              • Stepan Co. - Overview
              • Stepan Co. - Product / Service
              • Stepan Co. - Key offerings
            • 13.40 Thermo Fisher Scientific Inc.
              • Thermo Fisher Scientific Inc. - Overview
              • Thermo Fisher Scientific Inc. - Product / Service
              • Thermo Fisher Scientific Inc. - Key offerings
            • 13.41 Wanhua Chemical Group Co. Ltd.
              • Wanhua Chemical Group Co. Ltd. - Overview
              • Wanhua Chemical Group Co. Ltd. - Product / Service
              • Wanhua Chemical Group Co. Ltd. - Key offerings
            • 13.42 Repsol SA
              • Repsol SA - Overview
              • Repsol SA - Product / Service
              • Repsol SA - Key offerings

            13 Appendix

            • 13.1 Scope of the report
              • 13.2 Inclusions and exclusions checklist
                • Exhibit 181: Inclusions checklist
                • Exhibit 182: Exclusions checklist
              • 13.3 Currency conversion rates for US$
                • Exhibit 183: Currency conversion rates for US$
              • 13.4 Research methodology
                • Exhibit 184: Research methodology
                • Exhibit 185: Validation techniques employed for market sizing
                • Exhibit 186: Information sources
              • 13.5 List of abbreviations
                • Exhibit 187: List of abbreviations

              Research Methodology

              Technavio presents a detailed picture of the market by way of study, synthesis, and summation of data from multiple sources. The analysts have presented the various facets of the market with a particular focus on identifying the key industry influencers. The data thus presented is comprehensive, reliable, and the result of extensive research, both primary and secondary.

              INFORMATION SOURCES

              Primary sources

              • Manufacturers and suppliers
              • Channel partners
              • Industry experts
              • Strategic decision makers

              Secondary sources

              • Industry journals and periodicals
              • Government data
              • Financial reports of key industry players
              • Historical data
              • Press releases

              DATA ANALYSIS

              Data Synthesis

              • Collation of data
              • Estimation of key figures
              • Analysis of derived insights

              Data Validation

              • Triangulation with data models
              • Reference against proprietary databases
              • Corroboration with industry experts

              REPORT WRITING

              Qualitative

              • Market drivers
              • Market challenges
              • Market trends
              • Five forces analysis

              Quantitative

              • Market size and forecast
              • Market segmentation
              • Geographical insights
              • Competitive landscape

              Interested in this report?

              Get your sample now to see our research methodology and insights!

              Download Now

              Frequently Asked Questions

              Polyols market growth will increase by $ 10.08 bn during 2024-2028 .

              The Polyols market is expected to grow at a CAGR of 5.96% during 2024-2028 .

              Polyols market is segmented by Type( Polyether polyols, Polyester polyols, Coatings, adhesives, sealants, and elastomers, adhesives, sealants) Application( Flexible polyurethane foams, Rigid polyurethane foams, CAS and E)

              Archer Daniels Midland, BASF SE, Cargill Incorporated, Covestro AG, Dow Inc., Emery Oleochemicals, Huntsman Corporation, INVISTA, Jiangsu Yabang Chemical, Lanxess AG, Manali Petrochemicals, Mitsui Chemicals, Perstorp Group, Repsol, Sadara Chemical, Shandong Dongda Chemical, Shell Chemicals, Stepan Company, Wanhua Chemical Group, Woodbridge Foam Corporation are a few of the key vendors in the Polyols market.

              APAC will register the highest growth rate of 40% among the other regions. Therefore, the Polyols market in APAC is expected to garner significant business opportunities for the vendors during the forecast period.

              US, Canada, Germany, UK, Italy, France, China, India, Japan, Brazil, Egypt, UAE, Oman, Argentina, KSA, UAE, Brazil, Rest of World (ROW)

              • Escalating demand for polyols in electronics industryThe escalating demand for polyols in the electronics industry serves as a significant driver for the global polyols market. As the electronics sector experiences exponential growth driven by technological advancements and increasing consumer demand for electronic devices is the driving factor this market.
              • there is a parallel surge in the utilization of polyols in various applications within this industry. Polyols play a pivotal role in electronic applications is the driving factor this market.
              • particularly in the formulation of adhesives is the driving factor this market.
              • sealants is the driving factor this market.
              • and encapsulants. These materials are essential for bonding delicate electronic components is the driving factor this market.
              • providing insulation is the driving factor this market.
              • protection from moisture and environmental contaminants is the driving factor this market.
              • and enhancing thermal management within electronic devices. With the trend toward miniaturization and the development of high-performance electronics is the driving factor this market.
              • the demand for polyols with tailored properties such as adhesion strength is the driving factor this market.
              • flexibility is the driving factor this market.
              • thermal conductivity is the driving factor this market.
              • and moisture resistance is on the rise. The proliferation of emerging technologies such as IoT devices is the driving factor this market.
              • wearables is the driving factor this market.
              • and electric vehicles further amplifies the demand for polyols in the electronics industry. Polyols enable the production of advanced electronic systems and components with enhanced reliability is the driving factor this market.
              • durability is the driving factor this market.
              • and performance is the driving factor this market.
              • thereby driving the growth of the global polyols market as manufacturers seek to meet the evolving needs of the electronics sector. Thus is the driving factor this market.
              • the increase in the use of escalating demand for polyols in the electronics industry will propel the growth of the global polyols market during the forecast period. is the driving factor this market.

              The Polyols market vendors should focus on grabbing business opportunities from the Polyether polyols segment as it accounted for the largest market share in the base year.