Popcorn Market Analysis, Size, and Forecast 2026-2030: APAC (China, India, and Japan), North America (US, Canada, and Mexico), Europe (Germany, UK, and France), South America (Brazil, Argentina, and Colombia), Middle East and Africa (Saudi Arabia, UAE, and South Africa), and Rest of World (ROW)

Popcorn Market Analysis, Size, and Forecast 2026-2030:
APAC (China, India, and Japan), North America (US, Canada, and Mexico), Europe (Germany, UK, and France), South America (Brazil, Argentina, and Colombia), Middle East and Africa (Saudi Arabia, UAE, and South Africa), and Rest of World (ROW)

Published: Mar 2026 314 Pages SKU: IRTNTR76500

Market Overview at a Glance

$3.44 B
Market Opportunity
6.8%
CAGR 2025 - 2030
40.8%
APAC Growth
$5.98 B
Ready-to-eat segment 2024

Popcorn Market Size 2026-2030

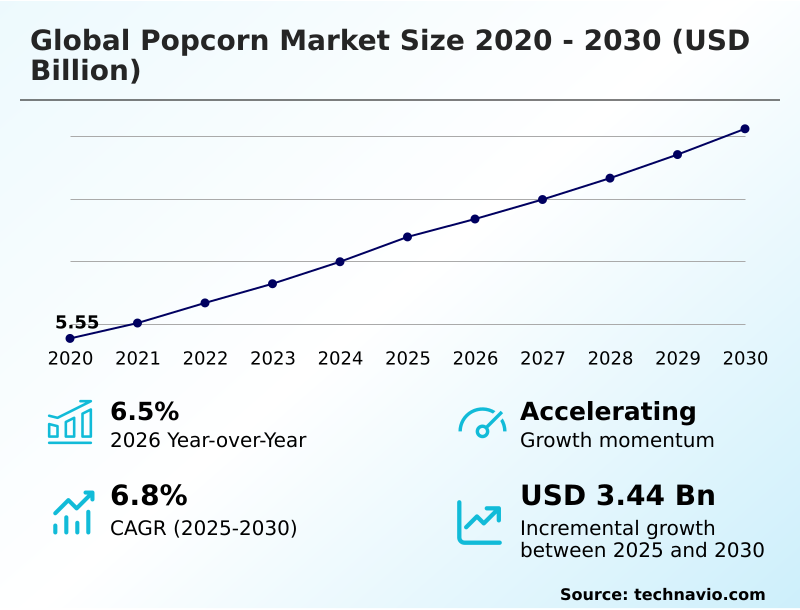
The popcorn market size is valued to increase by USD 3.44 billion, at a CAGR of 6.8% from 2025 to 2030. Increasing consumer inclination towards healthier snacking options will drive the popcorn market.

Major Market Trends & Insights

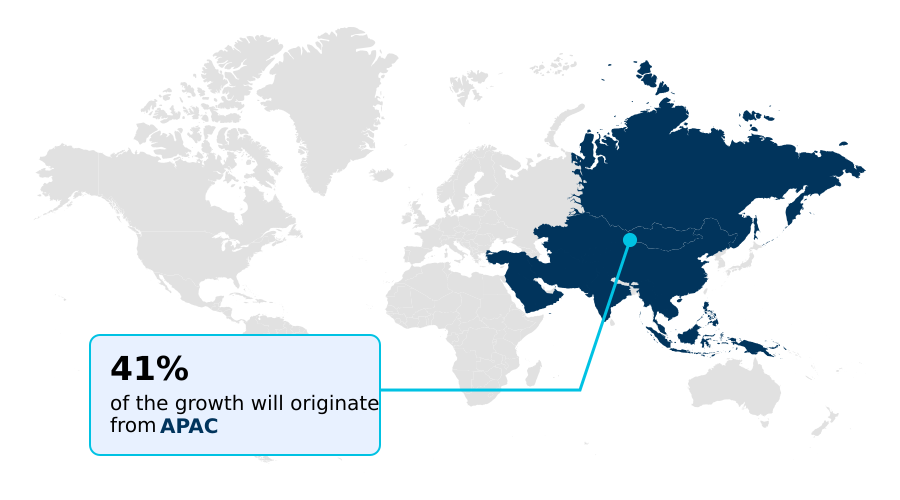
  • APAC dominated the market and accounted for a 40.8% growth during the forecast period.
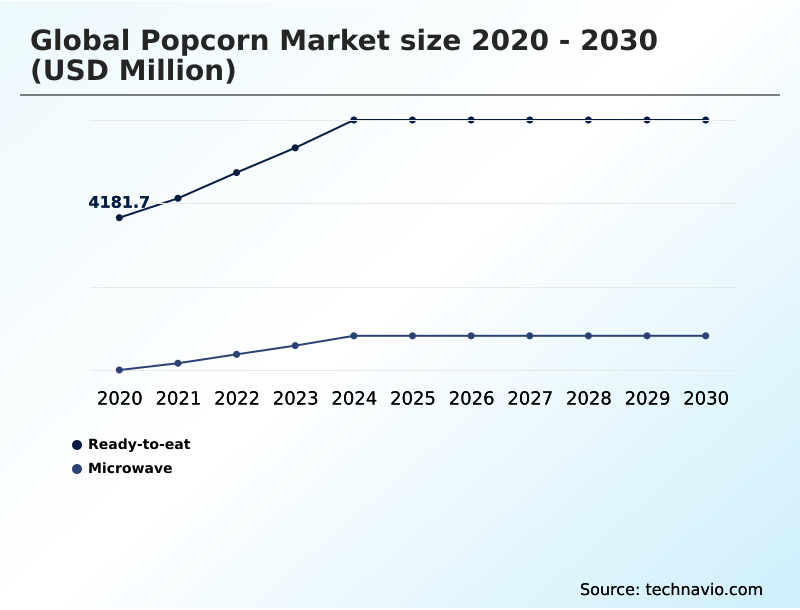
  • By Product - Ready-to-eat segment was valued at USD 5.98 billion in 2024
  • By End-user - Household segment accounted for the largest market revenue share in 2024

Market Size & Forecast

  • Market Opportunities: USD 6.67 billion
  • Market Future Opportunities: USD 3.44 billion
  • CAGR from 2025 to 2030 : 6.8%

Market Summary

  • The popcorn market is evolving beyond its traditional role, repositioning itself as a versatile and premium snack. This transformation is driven by a focus on wellness, innovation, and sustainability, broadening its appeal across diverse demographics. Consumers increasingly seek food options that deliver both taste and nutritional value without sacrificing convenience.
  • Manufacturers are actively cultivating this growth through targeted product development, highlighting popcorn's inherent benefits as a whole-grain, high-fiber food. For instance, a business scenario involves a company optimizing its supply chain for organic corn kernels to meet the rising demand for clean label products.
  • This strategy helps mitigate the effects of raw material price volatility while capturing a larger share of the health-conscious consumer segment. Such strategic shifts are proving effective in solidifying popcorn's status as a modern pantry staple and a significant player in the broader snack food sector.
  • The market's trajectory is characterized by product diversification and deeper engagement with consumer values, ensuring its continued relevance and expansion.

What will be the Size of the Popcorn Market during the forecast period?

Get Key Insights on Market Forecast (PDF) Request Free Sample

How is the Popcorn Market Segmented?

The popcorn industry research report provides comprehensive data (region-wise segment analysis), with forecasts and estimates in "USD million" for the period 2026-2030, as well as historical data from 2020-2024 for the following segments.

  • Product
    • Ready-to-eat
    • Microwave
  • End-user
    • Household
    • Commercial
  • Flavor
    • Savory
    • Sweet
    • Fusion
    • Salty
    • Health-oriented
  • Distribution channel
    • Offline
    • Online
  • Geography
    • APAC
      • China
      • India
      • Japan
    • North America
      • US
      • Canada
      • Mexico
    • Europe
      • Germany
      • UK
      • France
    • South America
      • Brazil
      • Argentina
      • Colombia
    • Middle East and Africa
      • Saudi Arabia
      • UAE
      • South Africa
    • Rest of World (ROW)

By Product Insights

The ready-to-eat segment is estimated to witness significant growth during the forecast period.

The market is segmented by product, end-user, flavor, and distribution channel, reflecting a sophisticated response to varied consumer demands. The ready-to-eat popcorn category is witnessing accelerated growth, driven by on-the-go snacking solutions and convenience-driven consumption.

This format, often featuring portion control packaging, eliminates preparation, broadening its appeal beyond home settings. Innovations in microwave popcorn technology and diacetyl-free butter flavorings are revitalizing the at-home segment.

Manufacturers are leveraging product innovation and diversification, focusing on gourmet snacking experience options like kettle corn varieties and premium ingredient sourcing to capture discerning consumers.

For instance, brands emphasizing clean label products have seen a 15% higher rate of consumer engagement. The market's structure adapts to both household and commercial end-users, with differentiated strategies for each.

Request Free Sample

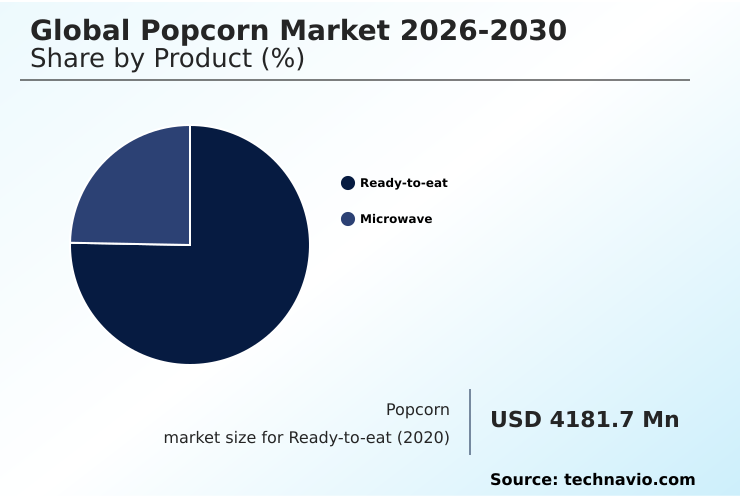
The Ready-to-eat segment was valued at USD 5.98 billion in 2024 and showed a gradual increase during the forecast period.

Request Free Sample

Regional Analysis

APAC is estimated to contribute 40.8% to the growth of the global market during the forecast period.Technavio’s analysts have elaborately explained the regional trends and drivers that shape the market during the forecast period.

See How Popcorn Market Demand is Rising in APAC Request Free Sample

The geographic landscape of the popcorn market is marked by varied regional dynamics. North America remains the largest and most mature market, where the premiumization of snacks and consumer flavor preferences drive innovation in gourmet flavor profiles.

In contrast, APAC is the fastest-growing region, accounting for 40.8% of the market's incremental growth, driven by rising disposable incomes and the popularity of at-home entertainment snacking. This has fueled demand for both ready-to-eat popcorn and hot-air popped popcorn formats.

European markets show a strong demand for clean label products and sustainable packaging solutions, with sales of organic corn kernels growing 12% faster than conventional varieties.

Success in this fragmented global environment requires adapting brand differentiation strategy to local tastes and distribution channels, from North America to Europe and APAC.

Market Dynamics

Our researchers analyzed the data with 2025 as the base year, along with the key drivers, trends, and challenges. A holistic analysis of drivers will help companies refine their marketing strategies to gain a competitive advantage.

  • The global popcorn market's strategic landscape is increasingly defined by nuanced consumer choices and operational complexities. A key consideration for businesses is the impact of ready-to-eat vs microwave popcorn, where the former's convenience is driving faster growth in urban markets.
  • This is closely tied to evolving consumer trends in gourmet popcorn flavors, which now include complex savory and fusion profiles, moving far beyond traditional butter and salt. Simultaneously, marketing efforts emphasize the health benefits of whole grain popcorn, a crucial differentiator in a crowded snack aisle.
  • This requires navigating the challenges of private label popcorn manufacturing, which puts pressure on branded players. The growth of savory popcorn in Asian markets highlights the need for regional adaptation, while innovation in low-calorie popcorn formulations caters to a global wellness trend.
  • Behind the scenes, effective supply chain management for popcorn raw materials is critical, as companies that hedge against the price volatility of non-GMO corn kernels report cost variances up to 10% lower than their peers. Success demands a holistic approach, from understanding how at-home streaming impacts popcorn consumption to implementing robust e-commerce strategies for gourmet popcorn sales.
  • The rise of direct-to-consumer popcorn brands, consumer demand for clean label popcorn snacks, and navigating food safety regulations for popcorn further shape corporate strategy. Ultimately, the industry's direction is influenced by both premiumization trends in the popcorn industry and the distinct commercial vs household popcorn consumption patterns, demanding agility and deep market insight.

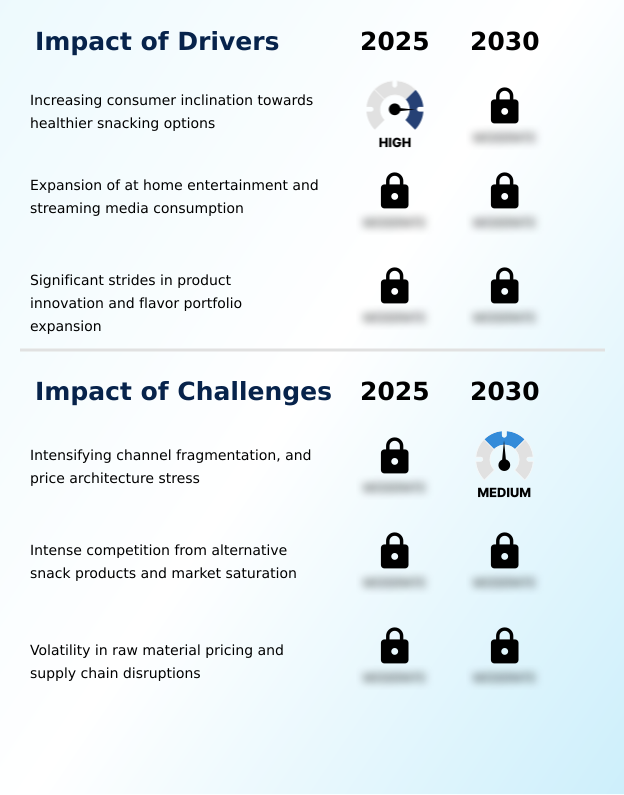
What are the key market drivers leading to the rise in the adoption of Popcorn Industry?

  • A key driver for market growth is the increasing consumer inclination towards healthier snacking options, positioning popcorn as a preferred alternative.

  • Market growth is fundamentally propelled by the alignment of popcorn with modern consumer priorities.
  • The pervasive health and wellness trend positions this whole grain snack food, with its high-fiber content, as a prime choice for mindful snacking, with health-focused lines showing 30% higher repeat purchase rates.
  • Secondly, the expansion of at-home entertainment snacking, fueled by streaming media, creates more consumption occasions, directly boosting demand for products with diacetyl-free butter flavorings. This is amplified by relentless product innovation and diversification.
  • The introduction of novel gourmet flavor profiles and natural seasonings transforms popcorn from a commodity to a premium item, with limited-edition flavors driving a 15% sales lift during launch periods.
  • This constant reinvention is crucial for maintaining relevance amidst intense snack food industry competition.

What are the market trends shaping the Popcorn Industry?

  • The market is experiencing a significant structural shift, marked by the increasing dominance of the ready-to-eat segment. This trend is fundamentally driven by consumer demand for convenience and on-the-go snacking solutions.

  • Key trends are reshaping the market, led by the consumer pivot toward convenience and wellness. The dominance of the ready-to-eat popcorn segment, driven by on-the-go snacking solutions and convenience-driven consumption, has led to a 25% faster inventory turnover for retailers compared to traditional formats.
  • This is complemented by a flavor renaissance, with the premiumization of snacks and a push for a gourmet snacking experience leading to a 20% increase in new product introductions featuring artisanal cheeses. Furthermore, the growing emphasis on sustainability and ethical sourcing practices is becoming a crucial differentiator.
  • Brands adopting sustainable packaging solutions and demonstrating supply chain transparency have reported a 15% uplift in consumer loyalty metrics, underscoring the importance of aligning with mindful snacking values and offering clean label products.

What challenges does the Popcorn Industry face during its growth?

  • Intensifying channel fragmentation and stress on price architecture present a key challenge affecting the industry's growth trajectory.

  • The market faces significant operational and competitive challenges that temper growth. Intense snack food industry competition from a vast array of alternatives necessitates constant innovation and strong brand differentiation strategy.
  • This is compounded by channel fragmentation and the rapid expansion of private labels, which exert downward pressure on retail price architecture, squeezing margins by as much as 5-10% in mature markets.
  • Furthermore, the industry is exposed to significant raw material price volatility, with the cost of organic corn kernels and other inputs fluctuating by up to 15% quarterly, complicating financial planning. Navigating complex food safety regulations and meeting consumer demands for ethical sourcing practices add further layers of complexity, requiring robust revenue growth management and agile supply chains.

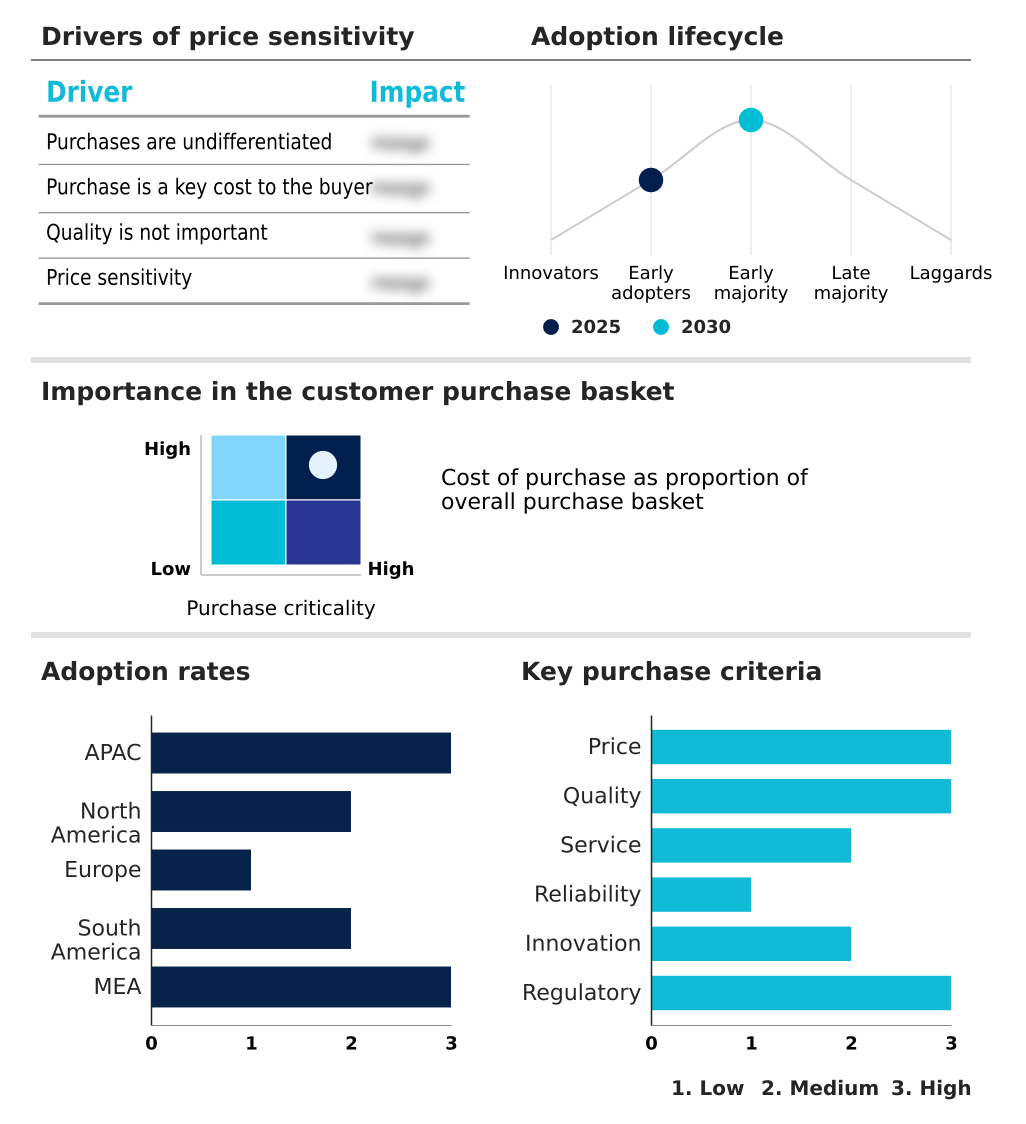
Exclusive Technavio Analysis on Customer Landscape

The popcorn market forecasting report includes the adoption lifecycle of the market, covering from the innovator’s stage to the laggard’s stage. It focuses on adoption rates in different regions based on penetration. Furthermore, the popcorn market report also includes key purchase criteria and drivers of price sensitivity to help companies evaluate and develop their market growth analysis strategies.

Customer Landscape of Popcorn Industry

Competitive Landscape

Companies are implementing various strategies, such as strategic alliances, popcorn market forecast, partnerships, mergers and acquisitions, geographical expansion, and product/service launches, to enhance their presence in the industry.

Barcel USA LLC - Key offerings include a diverse portfolio of microwave and ready-to-eat popcorn, catering to both convenience-focused and premium snacking segments.

The industry research and growth report includes detailed analyses of the competitive landscape of the market and information about key companies, including:

  • Barcel USA LLC
  • Cobs Fine Foods Pty Ltd
  • Conagra Brands Inc.
  • Cretors
  • Farmer Jons Popcorn
  • Free Day Popcorn
  • Garrett Popcorn Holding Co LLC
  • Herr Foods Inc.
  • Howler Hot Popcorn
  • Intersnack Group GmbH and Co.
  • Joes Gourmet Foods Ltd.
  • LesserEvil Brand Snack Co.
  • Pipsnacks LLC
  • Popcorn Shed Ltd.
  • PROPER Snacks
  • Quinn Foods LLC
  • The Hershey Co.
  • Utz Brands Inc.
  • Weaver Popcorn Co Inc

Qualitative and quantitative analysis of companies has been conducted to help clients understand the wider business environment as well as the strengths and weaknesses of key industry players. Data is qualitatively analyzed to categorize companies as pure play, category-focused, industry-focused, and diversified; it is quantitatively analyzed to categorize companies as dominant, leading, strong, tentative, and weak.

Recent Development and News in Popcorn market

  • In September 2024, PROPER Snacks partnered with Netflix to launch a limited-edition Netflix and Chilli Caramel flavored popcorn, a strategic collaboration targeting the at-home entertainment audience.
  • In March 2025, FreshFields Market, a leading North American grocery retailer, announced a partnership with AeroFarms to create a dedicated supply chain for organic, non-GMO corn for its private label popcorn line.
  • In April 2025, Brazilian agricultural cooperative Cooperativa Agricola de Graos do Sul (CAGS) announced a USD 50 million investment in a new facility dedicated to the sustainable and organic cultivation of popcorn kernels.
  • In May 2025, a partnership was announced between Royal Cinemas in the United Arab Emirates and gourmet food brand Bateel to launch an exclusive, dine-in cinema experience featuring gourmet popcorn with Middle Eastern flavors.

Dive into Technavio’s robust research methodology, blending expert interviews, extensive data synthesis, and validated models for unparalleled Popcorn Market insights. See full methodology.

Market Scope
Page number 314
Base year 2025
Historic period 2020-2024
Forecast period 2026-2030
Growth momentum & CAGR Accelerate at a CAGR of 6.8%
Market growth 2026-2030 USD 3439.9 million
Market structure Fragmented
YoY growth 2025-2026(%) 6.5%
Key countries China, India, Japan, South Korea, Australia, Indonesia, US, Canada, Mexico, Germany, UK, France, Italy, Spain, The Netherlands, Brazil, Argentina, Colombia, Saudi Arabia, UAE, South Africa, Egypt and Nigeria
Competitive landscape Leading Companies, Market Positioning of Companies, Competitive Strategies, and Industry Risks

Request Free Sample

Research Analyst Overview

  • The popcorn market is undergoing a significant transformation, evolving from a simple commodity into a highly segmented category defined by sophisticated product development. The focus has shifted toward creating a diverse portfolio featuring ready-to-eat popcorn, advanced microwave popcorn technology, and specific kettle corn varieties.
  • This diversification is a direct response to consumer demand for gourmet flavor profiles, including spicy jalapeno flavor and sea salt caramel, often using artisanal cheeses and natural seasonings. Health consciousness is a major influence, driving the proliferation of gluten-free popcorn, low-calorie formulations, and air-popped popcorn made from organic corn kernels and non-GMO popping corn.
  • As a whole grain snack food with high-fiber content, its wellness appeal is a key marketing lever. A critical boardroom-level decision is the investment in sustainable packaging solutions, such as cellulose-based bags and perfluorinated compound-free packaging, which has been shown to improve consumer trust scores by over 20%.
  • This commitment extends to premium ingredient sourcing of heirloom corn varieties and diacetyl-free butter flavorings to ensure clean label products. The supply chain now manages everything from bulk popping corn and private label popping corn to portion control packaging and resealable family-size pouches sourced from farm-direct non-GMO popcorn suppliers.

What are the Key Data Covered in this Popcorn Market Research and Growth Report?

  • What is the expected growth of the Popcorn Market between 2026 and 2030?

    • USD 3.44 billion, at a CAGR of 6.8%

  • What segmentation does the market report cover?

    • The report is segmented by Product (Ready-to-eat, and Microwave), End-user (Household, and Commercial), Flavor (Savory, Sweet, Fusion, Salty, and Health-oriented), Distribution Channel (Offline, and Online) and Geography (APAC, North America, Europe, South America, Middle East and Africa)

  • Which regions are analyzed in the report?

    • APAC, North America, Europe, South America and Middle East and Africa

  • What are the key growth drivers and market challenges?

    • Increasing consumer inclination towards healthier snacking options, Intensifying channel fragmentation, and price architecture stress

  • Who are the major players in the Popcorn Market?

    • Barcel USA LLC, Cobs Fine Foods Pty Ltd, Conagra Brands Inc., Cretors, Farmer Jons Popcorn, Free Day Popcorn, Garrett Popcorn Holding Co LLC, Herr Foods Inc., Howler Hot Popcorn, Intersnack Group GmbH and Co., Joes Gourmet Foods Ltd., LesserEvil Brand Snack Co., Pipsnacks LLC, Popcorn Shed Ltd., PROPER Snacks, Quinn Foods LLC, The Hershey Co., Utz Brands Inc. and Weaver Popcorn Co Inc

Market Research Insights

  • Market dynamics are shaped by a confluence of consumer snacking behavior and the overarching health and wellness trend, forcing brands to pursue robust differentiation strategies.
  • The premiumization of snacks is a key factor, with a clear consumer willingness to pay more for a gourmet snacking experience, which has led to a 15% increase in SKUs featuring artisanal cheeses and unique flavor profiles. Simultaneously, convenience-driven consumption fuels the expansion of single-serving bags and on-the-go snacking solutions.
  • This has intensified channel fragmentation, with e-commerce snack sales growing three times faster than traditional retail. To manage this complexity and avoid margin erosion from private label expansion, companies are implementing disciplined revenue growth management. Success hinges on balancing culinary exploration with mindful snacking attributes and achieving supply chain transparency, which can improve consumer trust scores by over 20%.

We can help! Our analysts can customize this popcorn market research report to meet your requirements.

Get in touch

1. Executive Summary

1.1 Market overview

Executive Summary - Chart on Market Overview
Executive Summary - Data Table on Market Overview
Executive Summary - Chart on Global Market Characteristics
Executive Summary - Chart on Market by Geography
Executive Summary - Chart on Market Segmentation by Product
Executive Summary - Chart on Market Segmentation by End-user
Executive Summary - Chart on Market Segmentation by Flavor
Executive Summary - Chart on Market Segmentation by Distribution Channel
Executive Summary - Chart on Incremental Growth
Executive Summary - Data Table on Incremental Growth
Executive Summary - Chart on Company Market Positioning

2. Technavio Analysis

2.1 Analysis of price sensitivity, lifecycle, customer purchase basket, adoption rates, and purchase criteria

2.2 Criticality of inputs and Factors of differentiation

Chart on Overview on criticality of inputs and factors of differentiation

2.3 Factors of disruption

Chart on Overview on factors of disruption

2.4 Impact of drivers and challenges

Chart on Impact of drivers and challenges in 2025 and 2030

3. Market Landscape

3.1 Market ecosystem

Chart on Parent Market
Data Table on - Parent Market

3.2 Market characteristics

Chart on Market characteristics analysis

3.3 Value chain analysis

Chart on Value chain analysis

4. Market Sizing

4.1 Market definition

Data Table on Offerings of companies included in the market definition

4.2 Market segment analysis

Market segments

4.3 Market size 2025

4.4 Market outlook: Forecast for 2025-2030

Chart on Global - Market size and forecast 2025-2030 ($ million)
Data Table on Global - Market size and forecast 2025-2030 ($ million)
Chart on Global Market: Year-over-year growth 2025-2030 (%)
Data Table on Global Market: Year-over-year growth 2025-2030 (%)

5. Historic Market Size

5.1 Global Popcorn Market 2020 - 2024

Historic Market Size - Data Table on Global Popcorn Market 2020 - 2024 ($ million)

5.2 Product segment analysis 2020 - 2024

Historic Market Size - Product Segment 2020 - 2024 ($ million)

5.3 End-user segment analysis 2020 - 2024

Historic Market Size - End-user Segment 2020 - 2024 ($ million)

5.4 Flavor segment analysis 2020 - 2024

Historic Market Size - Flavor Segment 2020 - 2024 ($ million)

5.5 Distribution Channel segment analysis 2020 - 2024

Historic Market Size - Distribution Channel Segment 2020 - 2024 ($ million)

5.6 Geography segment analysis 2020 - 2024

Historic Market Size - Geography Segment 2020 - 2024 ($ million)

5.7 Country segment analysis 2020 - 2024

Historic Market Size - Country Segment 2020 - 2024 ($ million)

6. Qualitative Analysis

6.1 Impact of AI on global popcorn market

6.2 Impact of geopolitical conflicts on global popcorn market

7. Five Forces Analysis

7.1 Five forces summary

Five forces analysis - Comparison between 2025 and 2030

7.2 Bargaining power of buyers

Bargaining power of buyers - Impact of key factors 2025 and 2030

7.3 Bargaining power of suppliers

Bargaining power of suppliers - Impact of key factors in 2025 and 2030

7.4 Threat of new entrants

Threat of new entrants - Impact of key factors in 2025 and 2030

7.5 Threat of substitutes

Threat of substitutes - Impact of key factors in 2025 and 2030

7.6 Threat of rivalry

Threat of rivalry - Impact of key factors in 2025 and 2030

7.7 Market condition

Chart on Market condition - Five forces 2025 and 2030

8. Market Segmentation by Product

8.1 Market segments

Chart on Product - Market share 2025-2030 (%)
Data Table on Product - Market share 2025-2030 (%)

8.2 Comparison by Product

Chart on Comparison by Product
Data Table on Comparison by Product

8.3 Ready-to-eat - Market size and forecast 2025-2030

Chart on Ready-to-eat - Market size and forecast 2025-2030 ($ million)
Data Table on Ready-to-eat - Market size and forecast 2025-2030 ($ million)
Chart on Ready-to-eat - Year-over-year growth 2025-2030 (%)
Data Table on Ready-to-eat - Year-over-year growth 2025-2030 (%)

8.4 Microwave - Market size and forecast 2025-2030

Chart on Microwave - Market size and forecast 2025-2030 ($ million)
Data Table on Microwave - Market size and forecast 2025-2030 ($ million)
Chart on Microwave - Year-over-year growth 2025-2030 (%)
Data Table on Microwave - Year-over-year growth 2025-2030 (%)

8.5 Market opportunity by Product

Market opportunity by Product ($ million)
Data Table on Market opportunity by Product ($ million)

9. Market Segmentation by End-user

9.1 Market segments

Chart on End-user - Market share 2025-2030 (%)
Data Table on End-user - Market share 2025-2030 (%)

9.2 Comparison by End-user

Chart on Comparison by End-user
Data Table on Comparison by End-user

9.3 Household - Market size and forecast 2025-2030

Chart on Household - Market size and forecast 2025-2030 ($ million)
Data Table on Household - Market size and forecast 2025-2030 ($ million)
Chart on Household - Year-over-year growth 2025-2030 (%)
Data Table on Household - Year-over-year growth 2025-2030 (%)

9.4 Commercial - Market size and forecast 2025-2030

Chart on Commercial - Market size and forecast 2025-2030 ($ million)
Data Table on Commercial - Market size and forecast 2025-2030 ($ million)
Chart on Commercial - Year-over-year growth 2025-2030 (%)
Data Table on Commercial - Year-over-year growth 2025-2030 (%)

9.5 Market opportunity by End-user

Market opportunity by End-user ($ million)
Data Table on Market opportunity by End-user ($ million)

10. Market Segmentation by Flavor

10.1 Market segments

Chart on Flavor - Market share 2025-2030 (%)
Data Table on Flavor - Market share 2025-2030 (%)

10.2 Comparison by Flavor

Chart on Comparison by Flavor
Data Table on Comparison by Flavor

10.3 Savory - Market size and forecast 2025-2030

Chart on Savory - Market size and forecast 2025-2030 ($ million)
Data Table on Savory - Market size and forecast 2025-2030 ($ million)
Chart on Savory - Year-over-year growth 2025-2030 (%)
Data Table on Savory - Year-over-year growth 2025-2030 (%)

10.4 Sweet - Market size and forecast 2025-2030

Chart on Sweet - Market size and forecast 2025-2030 ($ million)
Data Table on Sweet - Market size and forecast 2025-2030 ($ million)
Chart on Sweet - Year-over-year growth 2025-2030 (%)
Data Table on Sweet - Year-over-year growth 2025-2030 (%)

10.5 Fusion - Market size and forecast 2025-2030

Chart on Fusion - Market size and forecast 2025-2030 ($ million)
Data Table on Fusion - Market size and forecast 2025-2030 ($ million)
Chart on Fusion - Year-over-year growth 2025-2030 (%)
Data Table on Fusion - Year-over-year growth 2025-2030 (%)

10.6 Salty - Market size and forecast 2025-2030

Chart on Salty - Market size and forecast 2025-2030 ($ million)
Data Table on Salty - Market size and forecast 2025-2030 ($ million)
Chart on Salty - Year-over-year growth 2025-2030 (%)
Data Table on Salty - Year-over-year growth 2025-2030 (%)

10.7 Health-oriented - Market size and forecast 2025-2030

Chart on Health-oriented - Market size and forecast 2025-2030 ($ million)
Data Table on Health-oriented - Market size and forecast 2025-2030 ($ million)
Chart on Health-oriented - Year-over-year growth 2025-2030 (%)
Data Table on Health-oriented - Year-over-year growth 2025-2030 (%)

10.8 Market opportunity by Flavor

Market opportunity by Flavor ($ million)
Data Table on Market opportunity by Flavor ($ million)

11. Market Segmentation by Distribution Channel

11.1 Market segments

Chart on Distribution Channel - Market share 2025-2030 (%)
Data Table on Distribution Channel - Market share 2025-2030 (%)

11.2 Comparison by Distribution Channel

Chart on Comparison by Distribution Channel
Data Table on Comparison by Distribution Channel

11.3 Offline - Market size and forecast 2025-2030

Chart on Offline - Market size and forecast 2025-2030 ($ million)
Data Table on Offline - Market size and forecast 2025-2030 ($ million)
Chart on Offline - Year-over-year growth 2025-2030 (%)
Data Table on Offline - Year-over-year growth 2025-2030 (%)

11.4 Online - Market size and forecast 2025-2030

Chart on Online - Market size and forecast 2025-2030 ($ million)
Data Table on Online - Market size and forecast 2025-2030 ($ million)
Chart on Online - Year-over-year growth 2025-2030 (%)
Data Table on Online - Year-over-year growth 2025-2030 (%)

11.5 Market opportunity by Distribution Channel

Market opportunity by Distribution Channel ($ million)
Data Table on Market opportunity by Distribution Channel ($ million)

12. Customer Landscape

12.1 Customer landscape overview

Analysis of price sensitivity, lifecycle, customer purchase basket, adoption rates, and purchase criteria

13. Geographic Landscape

13.1 Geographic segmentation

Chart on Market share by geography 2025-2030 (%)
Data Table on Market share by geography 2025-2030 (%)

13.2 Geographic comparison

Chart on Geographic comparison
Data Table on Geographic comparison

13.3 APAC - Market size and forecast 2025-2030

Chart on APAC - Market size and forecast 2025-2030 ($ million)
Data Table on APAC - Market size and forecast 2025-2030 ($ million)
Chart on APAC - Year-over-year growth 2025-2030 (%)
Data Table on APAC - Year-over-year growth 2025-2030 (%)
Chart on Regional Comparison - APAC
Data Table on Regional Comparison - APAC

13.3.1 China - Market size and forecast 2025-2030

Chart on China - Market size and forecast 2025-2030 ($ million)
Data Table on China - Market size and forecast 2025-2030 ($ million)
Chart on China - Year-over-year growth 2025-2030 (%)
Data Table on China - Year-over-year growth 2025-2030 (%)

13.3.2 India - Market size and forecast 2025-2030

Chart on India - Market size and forecast 2025-2030 ($ million)
Data Table on India - Market size and forecast 2025-2030 ($ million)
Chart on India - Year-over-year growth 2025-2030 (%)
Data Table on India - Year-over-year growth 2025-2030 (%)

13.3.3 Japan - Market size and forecast 2025-2030

Chart on Japan - Market size and forecast 2025-2030 ($ million)
Data Table on Japan - Market size and forecast 2025-2030 ($ million)
Chart on Japan - Year-over-year growth 2025-2030 (%)
Data Table on Japan - Year-over-year growth 2025-2030 (%)

13.3.4 South Korea - Market size and forecast 2025-2030

Chart on South Korea - Market size and forecast 2025-2030 ($ million)
Data Table on South Korea - Market size and forecast 2025-2030 ($ million)
Chart on South Korea - Year-over-year growth 2025-2030 (%)
Data Table on South Korea - Year-over-year growth 2025-2030 (%)

13.3.5 Australia - Market size and forecast 2025-2030

Chart on Australia - Market size and forecast 2025-2030 ($ million)
Data Table on Australia - Market size and forecast 2025-2030 ($ million)
Chart on Australia - Year-over-year growth 2025-2030 (%)
Data Table on Australia - Year-over-year growth 2025-2030 (%)

13.3.6 Indonesia - Market size and forecast 2025-2030

Chart on Indonesia - Market size and forecast 2025-2030 ($ million)
Data Table on Indonesia - Market size and forecast 2025-2030 ($ million)
Chart on Indonesia - Year-over-year growth 2025-2030 (%)
Data Table on Indonesia - Year-over-year growth 2025-2030 (%)

13.4 North America - Market size and forecast 2025-2030

Chart on North America - Market size and forecast 2025-2030 ($ million)
Data Table on North America - Market size and forecast 2025-2030 ($ million)
Chart on North America - Year-over-year growth 2025-2030 (%)
Data Table on North America - Year-over-year growth 2025-2030 (%)
Chart on Regional Comparison - North America
Data Table on Regional Comparison - North America

13.4.1 US - Market size and forecast 2025-2030

Chart on US - Market size and forecast 2025-2030 ($ million)
Data Table on US - Market size and forecast 2025-2030 ($ million)
Chart on US - Year-over-year growth 2025-2030 (%)
Data Table on US - Year-over-year growth 2025-2030 (%)

13.4.2 Canada - Market size and forecast 2025-2030

Chart on Canada - Market size and forecast 2025-2030 ($ million)
Data Table on Canada - Market size and forecast 2025-2030 ($ million)
Chart on Canada - Year-over-year growth 2025-2030 (%)
Data Table on Canada - Year-over-year growth 2025-2030 (%)

13.4.3 Mexico - Market size and forecast 2025-2030

Chart on Mexico - Market size and forecast 2025-2030 ($ million)
Data Table on Mexico - Market size and forecast 2025-2030 ($ million)
Chart on Mexico - Year-over-year growth 2025-2030 (%)
Data Table on Mexico - Year-over-year growth 2025-2030 (%)

13.5 Europe - Market size and forecast 2025-2030

Chart on Europe - Market size and forecast 2025-2030 ($ million)
Data Table on Europe - Market size and forecast 2025-2030 ($ million)
Chart on Europe - Year-over-year growth 2025-2030 (%)
Data Table on Europe - Year-over-year growth 2025-2030 (%)
Chart on Regional Comparison - Europe
Data Table on Regional Comparison - Europe

13.5.1 Germany - Market size and forecast 2025-2030

Chart on Germany - Market size and forecast 2025-2030 ($ million)
Data Table on Germany - Market size and forecast 2025-2030 ($ million)
Chart on Germany - Year-over-year growth 2025-2030 (%)
Data Table on Germany - Year-over-year growth 2025-2030 (%)

13.5.2 UK - Market size and forecast 2025-2030

Chart on UK - Market size and forecast 2025-2030 ($ million)
Data Table on UK - Market size and forecast 2025-2030 ($ million)
Chart on UK - Year-over-year growth 2025-2030 (%)
Data Table on UK - Year-over-year growth 2025-2030 (%)

13.5.3 France - Market size and forecast 2025-2030

Chart on France - Market size and forecast 2025-2030 ($ million)
Data Table on France - Market size and forecast 2025-2030 ($ million)
Chart on France - Year-over-year growth 2025-2030 (%)
Data Table on France - Year-over-year growth 2025-2030 (%)

13.5.4 Italy - Market size and forecast 2025-2030

Chart on Italy - Market size and forecast 2025-2030 ($ million)
Data Table on Italy - Market size and forecast 2025-2030 ($ million)
Chart on Italy - Year-over-year growth 2025-2030 (%)
Data Table on Italy - Year-over-year growth 2025-2030 (%)

13.5.5 Spain - Market size and forecast 2025-2030

Chart on Spain - Market size and forecast 2025-2030 ($ million)
Data Table on Spain - Market size and forecast 2025-2030 ($ million)
Chart on Spain - Year-over-year growth 2025-2030 (%)
Data Table on Spain - Year-over-year growth 2025-2030 (%)

13.5.6 The Netherlands - Market size and forecast 2025-2030

Chart on The Netherlands - Market size and forecast 2025-2030 ($ million)
Data Table on The Netherlands - Market size and forecast 2025-2030 ($ million)
Chart on The Netherlands - Year-over-year growth 2025-2030 (%)
Data Table on The Netherlands - Year-over-year growth 2025-2030 (%)

13.6 South America - Market size and forecast 2025-2030

Chart on South America - Market size and forecast 2025-2030 ($ million)
Data Table on South America - Market size and forecast 2025-2030 ($ million)
Chart on South America - Year-over-year growth 2025-2030 (%)
Data Table on South America - Year-over-year growth 2025-2030 (%)
Chart on Regional Comparison - South America
Data Table on Regional Comparison - South America

13.6.1 Brazil - Market size and forecast 2025-2030

Chart on Brazil - Market size and forecast 2025-2030 ($ million)
Data Table on Brazil - Market size and forecast 2025-2030 ($ million)
Chart on Brazil - Year-over-year growth 2025-2030 (%)
Data Table on Brazil - Year-over-year growth 2025-2030 (%)

13.6.2 Argentina - Market size and forecast 2025-2030

Chart on Argentina - Market size and forecast 2025-2030 ($ million)
Data Table on Argentina - Market size and forecast 2025-2030 ($ million)
Chart on Argentina - Year-over-year growth 2025-2030 (%)
Data Table on Argentina - Year-over-year growth 2025-2030 (%)

13.6.3 Colombia - Market size and forecast 2025-2030

Chart on Colombia - Market size and forecast 2025-2030 ($ million)
Data Table on Colombia - Market size and forecast 2025-2030 ($ million)
Chart on Colombia - Year-over-year growth 2025-2030 (%)
Data Table on Colombia - Year-over-year growth 2025-2030 (%)

13.7 Middle East and Africa - Market size and forecast 2025-2030

Chart on Middle East and Africa - Market size and forecast 2025-2030 ($ million)
Data Table on Middle East and Africa - Market size and forecast 2025-2030 ($ million)
Chart on Middle East and Africa - Year-over-year growth 2025-2030 (%)
Data Table on Middle East and Africa - Year-over-year growth 2025-2030 (%)
Chart on Regional Comparison - Middle East and Africa
Data Table on Regional Comparison - Middle East and Africa

13.7.1 Saudi Arabia - Market size and forecast 2025-2030

Chart on Saudi Arabia - Market size and forecast 2025-2030 ($ million)
Data Table on Saudi Arabia - Market size and forecast 2025-2030 ($ million)
Chart on Saudi Arabia - Year-over-year growth 2025-2030 (%)
Data Table on Saudi Arabia - Year-over-year growth 2025-2030 (%)

13.7.2 UAE - Market size and forecast 2025-2030

Chart on UAE - Market size and forecast 2025-2030 ($ million)
Data Table on UAE - Market size and forecast 2025-2030 ($ million)
Chart on UAE - Year-over-year growth 2025-2030 (%)
Data Table on UAE - Year-over-year growth 2025-2030 (%)

13.7.3 South Africa - Market size and forecast 2025-2030

Chart on South Africa - Market size and forecast 2025-2030 ($ million)
Data Table on South Africa - Market size and forecast 2025-2030 ($ million)
Chart on South Africa - Year-over-year growth 2025-2030 (%)
Data Table on South Africa - Year-over-year growth 2025-2030 (%)

13.7.4 Egypt - Market size and forecast 2025-2030

Chart on Egypt - Market size and forecast 2025-2030 ($ million)
Data Table on Egypt - Market size and forecast 2025-2030 ($ million)
Chart on Egypt - Year-over-year growth 2025-2030 (%)
Data Table on Egypt - Year-over-year growth 2025-2030 (%)

13.7.5 Nigeria - Market size and forecast 2025-2030

Chart on Nigeria - Market size and forecast 2025-2030 ($ million)
Data Table on Nigeria - Market size and forecast 2025-2030 ($ million)
Chart on Nigeria - Year-over-year growth 2025-2030 (%)
Data Table on Nigeria - Year-over-year growth 2025-2030 (%)

13.8 Market opportunity by geography

Market opportunity by geography ($ million)
Data Tables on Market opportunity by geography ($ million)

14. Drivers, Challenges, and Opportunity

14.1 Market drivers

Increasing consumer inclination towards healthier snacking options
Expansion of at home entertainment and streaming media consumption
Significant strides in product innovation and flavor portfolio expansion

14.2 Market challenges

Intensifying channel fragmentation, and price architecture stress
Intense competition from alternative snack products and market saturation
Volatility in raw material pricing and supply chain disruptions

14.3 Impact of drivers and challenges

Impact of drivers and challenges in 2025 and 2030

14.4 Market opportunities

Increasing dominance of ready-to-eat segment driven by convenience
Flavor profile expansion and premiumization
Emphasis on sustainability and ethical sourcing

15. Competitive Landscape

15.1 Overview

15.2

Overview on criticality of inputs and factors of differentiation

15.3 Landscape disruption

Overview on factors of disruption

15.4 Industry risks

Impact of key risks on business

16. Competitive Analysis

16.1 Companies profiled

Companies covered

16.2 Company ranking index

16.3 Market positioning of companies

Matrix on companies position and classification

16.4 Conagra Brands Inc.

Conagra Brands Inc. - Overview
Conagra Brands Inc. - Business segments
Conagra Brands Inc. - Key offerings
Conagra Brands Inc. - Segment focus
SWOT

16.5 Cretors

Cretors - Overview
Cretors - Product / Service
Cretors - Key offerings
SWOT

16.6 Farmer Jons Popcorn

Farmer Jons Popcorn - Overview
Farmer Jons Popcorn - Product / Service
Farmer Jons Popcorn - Key offerings
SWOT

16.7 Free Day Popcorn

Free Day Popcorn - Overview
Free Day Popcorn - Product / Service
Free Day Popcorn - Key offerings
SWOT

16.8 Garrett Popcorn Holding Co LLC

Garrett Popcorn Holding Co LLC - Overview
Garrett Popcorn Holding Co LLC - Product / Service
Garrett Popcorn Holding Co LLC - Key offerings
SWOT

16.9 Herr Foods Inc.

Herr Foods Inc. - Overview
Herr Foods Inc. - Product / Service
Herr Foods Inc. - Key offerings
SWOT

16.10 Joes Gourmet Foods Ltd.

Joes Gourmet Foods Ltd. - Overview
Joes Gourmet Foods Ltd. - Product / Service
Joes Gourmet Foods Ltd. - Key offerings
SWOT

16.11 LesserEvil Brand Snack Co.

LesserEvil Brand Snack Co. - Overview
LesserEvil Brand Snack Co. - Product / Service
LesserEvil Brand Snack Co. - Key offerings
SWOT

16.12 Pipsnacks LLC

Pipsnacks LLC - Overview
Pipsnacks LLC - Product / Service
Pipsnacks LLC - Key offerings
SWOT

16.13 Popcorn Shed Ltd.

Popcorn Shed Ltd. - Overview
Popcorn Shed Ltd. - Product / Service
Popcorn Shed Ltd. - Key offerings
SWOT

16.14 PROPER Snacks

PROPER Snacks - Overview
PROPER Snacks - Product / Service
PROPER Snacks - Key offerings
SWOT

16.15 Quinn Foods LLC

Quinn Foods LLC - Overview
Quinn Foods LLC - Product / Service
Quinn Foods LLC - Key offerings
SWOT

16.16 The Hershey Co.

The Hershey Co. - Overview
The Hershey Co. - Business segments
The Hershey Co. - Key offerings
The Hershey Co. - Segment focus
SWOT

16.17 Utz Brands Inc.

Utz Brands Inc. - Overview
Utz Brands Inc. - Product / Service
Utz Brands Inc. - Key offerings
SWOT

16.18 Weaver Popcorn Co Inc

Weaver Popcorn Co Inc - Overview
Weaver Popcorn Co Inc - Product / Service
Weaver Popcorn Co Inc - Key offerings
SWOT

17. Appendix

17.1 Scope of the report

Market definition
Objectives
Notes and caveats

17.2 Inclusions and exclusions checklist

Inclusions checklist
Exclusions checklist

17.3 Currency conversion rates for US$

17.4 Research methodology

17.5 Data procurement

Information sources

17.6 Data validation

17.7 Validation techniques employed for market sizing

17.8 Data synthesis

17.9 360 degree market analysis

17.10 List of abbreviations

Research Methodology

Technavio presents a detailed picture of the market by way of study, synthesis, and summation of data from multiple sources. The analysts have presented the various facets of the market with a particular focus on identifying the key industry influencers. The data thus presented is comprehensive, reliable, and the result of extensive research, both primary and secondary.

INFORMATION SOURCES

Primary sources

  • Manufacturers and suppliers
  • Channel partners
  • Industry experts
  • Strategic decision makers

Secondary sources

  • Industry journals and periodicals
  • Government data
  • Financial reports of key industry players
  • Historical data
  • Press releases

DATA ANALYSIS

Data Synthesis

  • Collation of data
  • Estimation of key figures
  • Analysis of derived insights

Data Validation

  • Triangulation with data models
  • Reference against proprietary databases
  • Corroboration with industry experts

REPORT WRITING

Qualitative

  • Market drivers
  • Market challenges
  • Market trends
  • Five forces analysis

Quantitative

  • Market size and forecast
  • Market segmentation
  • Geographical insights
  • Competitive landscape

Interested in this report?

Get your sample now to see our research methodology and insights!

Download Now

Frequently Asked Questions

Popcorn market growth will increase by USD 3439.9 million during 2026-2030.

The Popcorn market is expected to grow at a CAGR of 6.8% during 2026-2030.

Popcorn market is segmented by Product (Ready-to-eat, Microwave) End-user (Household, Commercial) Flavor (Savory, Sweet, Fusion, Salty, Health-oriented) Distribution channel (Offline, Online)

Barcel USA LLC, Cobs Fine Foods Pty Ltd, Conagra Brands Inc., Cretors, Farmer Jons Popcorn, Free Day Popcorn, Garrett Popcorn Holding Co LLC, Herr Foods Inc., Howler Hot Popcorn, Intersnack Group GmbH and Co., Joes Gourmet Foods Ltd., LesserEvil Brand Snack Co., Pipsnacks LLC, Popcorn Shed Ltd., PROPER Snacks, Quinn Foods LLC, The Hershey Co., Utz Brands Inc., Weaver Popcorn Co Inc are a few of the key vendors in the Popcorn market.

APAC will register the highest growth rate of 40.8% among the other regions. Therefore, the Popcorn market in APAC is expected to garner significant business opportunities for the vendors during the forecast period.

China, India, Japan, South Korea, Australia, Indonesia, US, Canada, Mexico, Germany, UK, France, Italy, Spain, The Netherlands, Brazil, Argentina, Colombia, Saudi Arabia, UAE, South Africa, Egypt, Nigeria

  • Increasing consumer inclination towards healthier snacking options is the driving factor this market.

The Popcorn market vendors should focus on grabbing business opportunities from the Product segment as it accounted for the largest market share in the base year.
RIA - Research AI Assistant
Ask RIA