Post Quantum Cryptography Market Analysis, Size, and Forecast 2026-2030: North America (US, Canada, and Mexico), Europe (Germany, France, and UK), APAC (China, Japan, and India), Middle East and Africa (Saudi Arabia, UAE, and South Africa), South America (Brazil, Argentina, and Colombia), and Rest of World (ROW)

Post Quantum Cryptography Market Analysis, Size, and Forecast 2026-2030:
North America (US, Canada, and Mexico), Europe (Germany, France, and UK), APAC (China, Japan, and India), Middle East and Africa (Saudi Arabia, UAE, and South Africa), South America (Brazil, Argentina, and Colombia), and Rest of World (ROW)

Published: Dec 2025 309 Pages SKU: IRTNTR81200

Market Overview at a Glance

$3.42 B
Market Opportunity
43.4%
CAGR 2025 - 2030
40.3%
North America Growth
$239.5 Mn
Lattice-based segment 2024

Post Quantum Cryptography Market Size 2026-2030

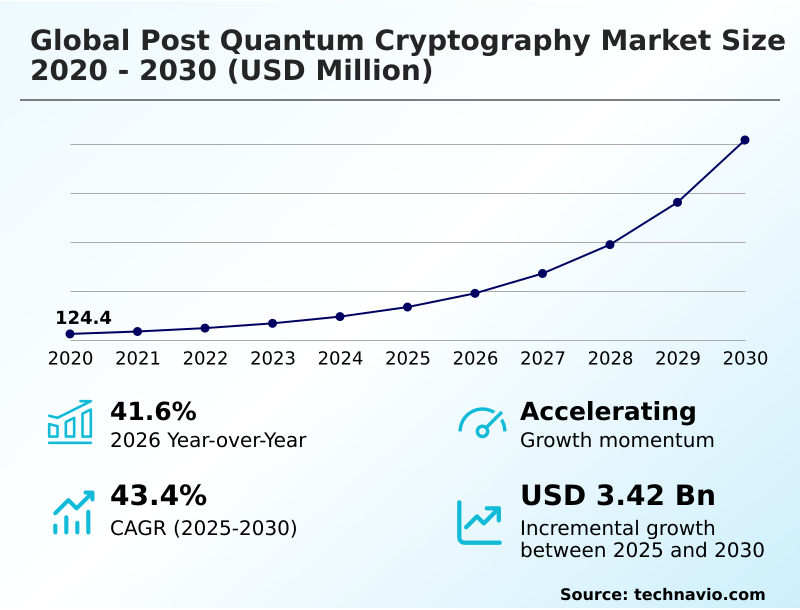
The post quantum cryptography market size is valued to increase by USD 3.42 billion, at a CAGR of 43.4% from 2025 to 2030. Escalating threat of quantum computing will drive the post quantum cryptography market.

Major Market Trends & Insights

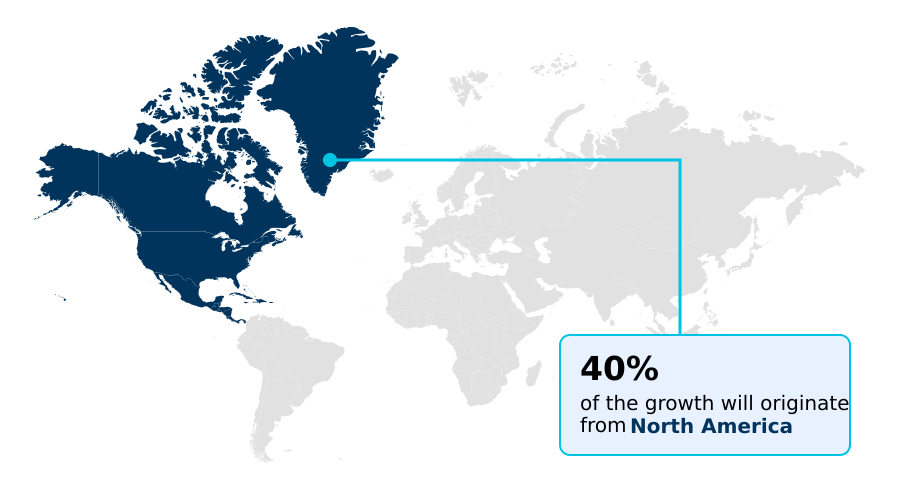
  • North America dominated the market and accounted for a 40.3% growth during the forecast period.
  • By Type - Lattice-based segment was valued at USD 239.5 million in 2024
  • By Component - Software segment accounted for the largest market revenue share in 2024

Market Size & Forecast

  • Market Opportunities: USD 3.97 billion
  • Market Future Opportunities: USD 3.42 billion
  • CAGR from 2025 to 2030 : 43.4%

Market Summary

  • The post quantum cryptography market is defined by the urgent need to develop and deploy new cryptographic systems secure against the threat posed by quantum computers. Current public key encryption standards are vulnerable to attacks from a cryptographically relevant quantum computer, rendering vast amounts of secured data insecure.
  • This has catalyzed a global effort, led by bodies overseeing NIST PQC standardization, to develop quantum-resistant algorithms based on diverse mathematical problems, including lattice-based cryptography, code-based cryptography, and hash-based signatures. The primary driver is the need for long-term data security, particularly for sectors with sensitive information like government, finance, and healthcare, who face the 'harvest now, decrypt later' threat.
  • A key trend is the move toward crypto-agility, enabling systems to transition to new cryptographic primitives without complete overhauls. For instance, a financial institution must plan a PQC migration strategy to protect decades of transaction archives, which involves integrating standardized PQC algorithms into legacy systems while managing performance overhead.
  • This transition is complex, necessitating significant investment in PQC implementation services and skilled personnel to ensure a secure digital future. The adoption of a hybrid cryptographic approach often serves as an interim solution.

What will be the Size of the Post Quantum Cryptography Market during the forecast period?

Get Key Insights on Market Forecast (PDF) Request Free Sample

How is the Post Quantum Cryptography Market Segmented?

The post quantum cryptography industry research report provides comprehensive data (region-wise segment analysis), with forecasts and estimates in "USD million" for the period 2026-2030, as well as historical data from 2020-2024 for the following segments.

  • Type
    • Lattice-based
    • Code-based
    • Hash-based
    • Others
  • Component
    • Software
    • Services
    • Hardware
  • Application
    • Network security
    • Cloud security
    • Application security
    • Others
  • Geography
    • North America
      • US
      • Canada
      • Mexico
    • Europe
      • Germany
      • France
      • UK
    • APAC
      • China
      • Japan
      • India
    • Middle East and Africa
      • Saudi Arabia
      • UAE
      • South Africa
    • South America
      • Brazil
      • Argentina
      • Colombia
    • Rest of World (ROW)

By Type Insights

The lattice-based segment is estimated to witness significant growth during the forecast period.

The market is segmented by type, component, application, and geography. Within the type segment, lattice-based cryptography has emerged as a foundational technology due to its robust security and efficiency.

These quantum-resistant algorithms, built on computationally hard lattice problems, offer a strong balance of performance and protection against the quantum computing threat. This makes them suitable for diverse cryptographic primitives, including key encapsulation mechanism and digital signatures.

The NIST PQC standardization process has further solidified their prominence, selecting specific lattice-based schemes for widespread adoption. This endorsement has driven integration into secure boot process and transport layer security protocols.

Implementations have demonstrated that while some performance overhead exists, optimizations can mitigate impact, with certain PQC-enabled hardware showing only a 15% increase in power consumption during intensive operations, a manageable trade-off for achieving forward secrecy.

This underpins the importance of crypto-agility.

Request Free Sample

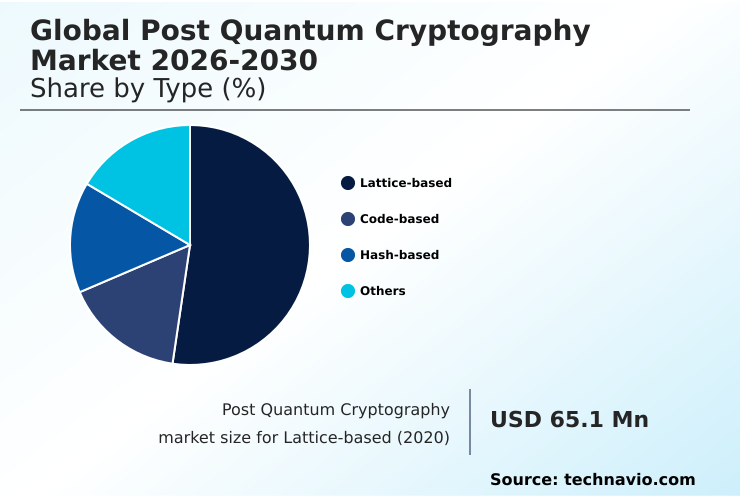
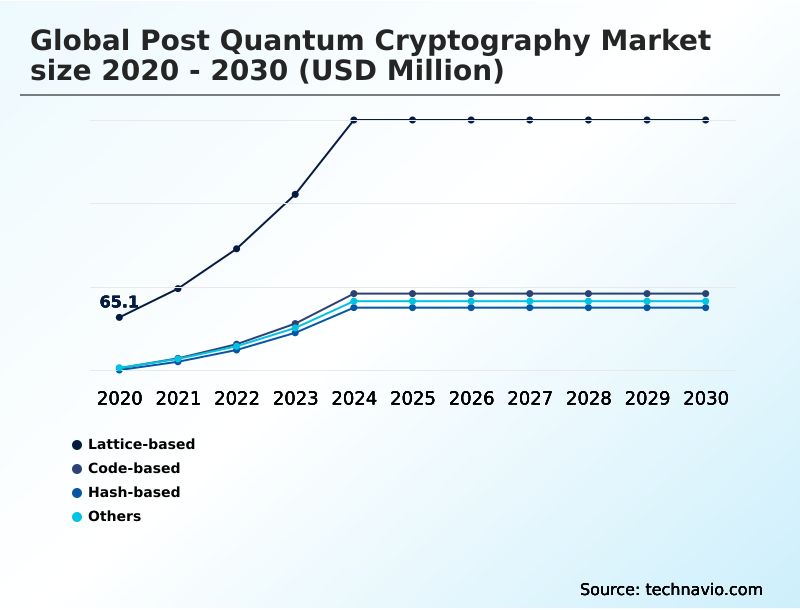
The Lattice-based segment was valued at USD 239.5 million in 2024 and showed a gradual increase during the forecast period.

Request Free Sample

Regional Analysis

North America is estimated to contribute 40.3% to the growth of the global market during the forecast period.Technavio’s analysts have elaborately explained the regional trends and drivers that shape the market during the forecast period.

See How Post Quantum Cryptography Market Demand is Rising in North America Request Free Sample

The geographic landscape of the post quantum cryptography market is led by North America, which accounts for over 40% of the incremental growth, driven by US-led NIST PQC standardization efforts and substantial investment in quantum-safe VPN and cloud security with PQC.

This region is home to key vendors developing PQC hardware accelerators and quantum-resistant libraries. Europe is also a significant market, focusing on digital sovereignty and collaborative research into a crypto-agility framework.

The APAC region is experiencing the fastest growth, with a CAGR of 44.3%, propelled by major investments from China, Japan, and South Korea in developing indigenous quantum-resistant authentication and securing network security protocols.

These nations see post-quantum key exchange and quantum-proof encryption as vital for economic and national security, fostering a competitive environment for innovation in PQC algorithm selection.

Market Dynamics

Our researchers analyzed the data with 2025 as the base year, along with the key drivers, trends, and challenges. A holistic analysis of drivers will help companies refine their marketing strategies to gain a competitive advantage.

  • Navigating the transition to post-quantum cryptography requires a detailed strategic roadmap, as migrating legacy systems to PQC is a complex undertaking with significant operational implications. A primary concern is the performance impact of PQC on networks, as some quantum-resistant algorithms have larger key and signature sizes compared to their classical counterparts.
  • This necessitates a thorough cost analysis of PQC migration projects to balance security with efficiency. Comparing lattice-based and code-based PQC schemes reveals trade-offs in performance and key size, influencing their suitability for different applications. The challenges of PQC adoption in enterprises are further compounded by the existing talent gap in post-quantum cryptography expertise, making external support essential.
  • Organizations are increasingly adopting a hybrid approach for PQC transition, which allows for gradual integration and mitigates risks associated with new PQC algorithms. This strategy is critical for PQC for securing IoT and OT environments, where resource constraints demand careful planning.
  • The role of NIST in PQC standardization provides a crucial foundation, but developing a PQC crypto-agility roadmap is the responsibility of each organization. This roadmap must address quantum-safe digital identity management and the integration of PQC with existing security ecosystems.
  • Ultimately, securing long-term data archives with PQC is paramount to counter the threat of Shor's algorithm to RSA and ensure PQC compliance and regulatory mandates.

What are the key market drivers leading to the rise in the adoption of Post Quantum Cryptography Industry?

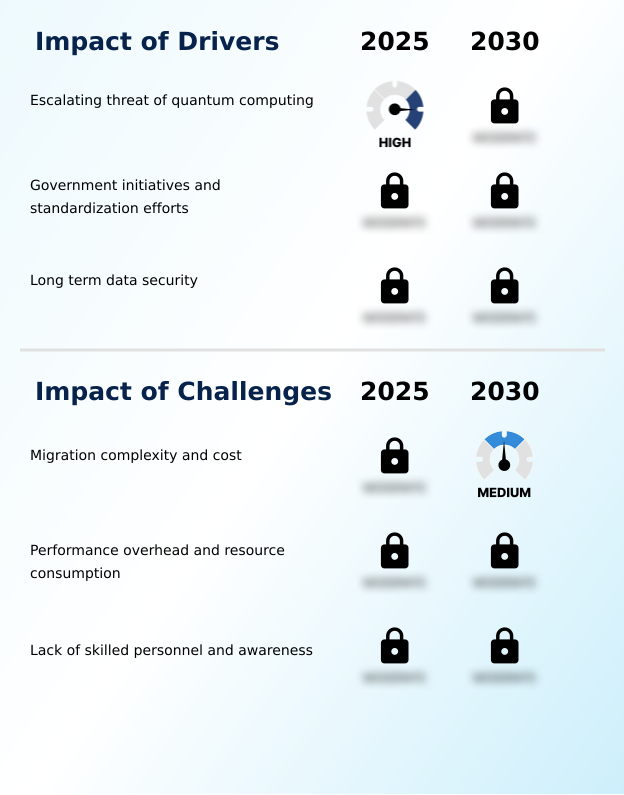
  • The escalating threat that quantum computing poses to current encryption standards is the foremost driver of market growth.

  • The primary driver is the escalating quantum computing threat, which renders current public key encryption vulnerable and necessitates a shift to quantum-resistant algorithms.
  • This has created an urgent need for long-term data security to counter the 'harvest now, decrypt later' scenario, where adversaries store encrypted data to decrypt later with a cryptographically relevant quantum computer.
  • In response, government initiatives and the NIST PQC standardization process are providing a clear roadmap for adoption, fueling investment in PQC for critical infrastructure and financial services.
  • This top-down push for quantum-proof encryption de-risks the migration process for enterprises, which are now actively pursuing PQC migration strategy development and quantum risk assessment to safeguard data that requires protection for decades.

What are the market trends shaping the Post Quantum Cryptography Industry?

  • The accelerated pace of standardization efforts, coupled with the increasing issuance of government mandates for adoption, is a prominent trend shaping the market's trajectory.

  • Key trends are reshaping the market, led by accelerated government mandates and the finalization of standardized PQC algorithms. This clarity is driving a pragmatic shift toward the adoption of a hybrid cryptographic approach, blending classical algorithms with new quantum-resistant libraries to ensure a secure transition.
  • This layered strategy mitigates risks associated with the relative novelty of post quantum key exchange protocols. Another significant trend is the seamless integration of PQC for IoT devices into existing ecosystems, with vendors embedding quantum-safe VPN capabilities and quantum-resistant authentication directly into hardware.
  • This approach simplifies crypto-agility, but a skills gap remains a hurdle, with less than 5% of professionals feeling prepared for PQC implementation services.

What challenges does the Post Quantum Cryptography Industry face during its growth?

  • The inherent complexity and substantial cost associated with migrating existing infrastructures represent a significant challenge to market adoption.

  • Significant challenges temper the pace of adoption, primarily the complexity and cost of a full PQC migration strategy. Transitioning from legacy systems requires a complete inventory of all cryptographic primitives and extensive testing, a daunting task for large organizations.
  • The PQC performance overhead is another concern; some quantum-resistant algorithms demand more resources, with benchmark studies showing that certain implementations can increase power consumption by 15% in embedded systems, impacting PQC for IoT devices.
  • Furthermore, a severe talent shortage, with less than 5% of cybersecurity professionals feeling fully prepared, complicates PQC algorithm selection and deployment, increasing reliance on specialized PQC implementation services to achieve a secure and efficient transition.

Exclusive Technavio Analysis on Customer Landscape

The post quantum cryptography market forecasting report includes the adoption lifecycle of the market, covering from the innovator’s stage to the laggard’s stage. It focuses on adoption rates in different regions based on penetration. Furthermore, the post quantum cryptography market report also includes key purchase criteria and drivers of price sensitivity to help companies evaluate and develop their market growth analysis strategies.

Customer Landscape of Post Quantum Cryptography Industry

Competitive Landscape

Companies are implementing various strategies, such as strategic alliances, post quantum cryptography market forecast, partnerships, mergers and acquisitions, geographical expansion, and product/service launches, to enhance their presence in the industry.

Amazon.com Inc. - Expertise is demonstrated through advanced, quantum-resistant key management and data encryption services integrated within a scalable cloud environment, ensuring long-term information security.

The industry research and growth report includes detailed analyses of the competitive landscape of the market and information about key companies, including:

  • Amazon.com Inc.
  • Cisco Systems Inc.
  • Cloudflare Inc.
  • Google Cloud
  • IDEMIA France SAS
  • Infineon Technologies AG
  • Intel Corp.
  • IBM Corp.
  • Microsoft Corp.
  • NEC Corp.
  • NXP Semiconductors NV
  • Palo Alto Networks Inc.
  • Qualcomm Inc.
  • Quantinuum Ltd.
  • STMicroelectronics NV
  • Thales Group
  • Toshiba Corp.

Qualitative and quantitative analysis of companies has been conducted to help clients understand the wider business environment as well as the strengths and weaknesses of key industry players. Data is qualitatively analyzed to categorize companies as pure play, category-focused, industry-focused, and diversified; it is quantitatively analyzed to categorize companies as dominant, leading, strong, tentative, and weak.

Recent Development and News in Post quantum cryptography market

  • In August 2024, the United States Cybersecurity and Infrastructure Security Agency (CISA) issued a directive requiring federal agencies to develop and begin implementing plans for migrating to post-quantum cryptography.
  • In September 2024, a major web browser provider updated its experimental features to include an option for hybrid Transport Layer Security (TLS) connections, combining X25519 with CRYSTALS-Kyber for key exchange.
  • In October 2024, a prominent enterprise identity and access management (IAM) company announced that its next-generation platform would natively support quantum-resistant authentication protocols.
  • In May 2025, a major operating system developer announced the planned integration of the SPHINCS+ signature scheme for securing future software updates, ensuring the integrity of distributed code.

Dive into Technavio’s robust research methodology, blending expert interviews, extensive data synthesis, and validated models for unparalleled Post Quantum Cryptography Market insights. See full methodology.

Market Scope
Page number 309
Base year 2025
Historic period 2020-2024
Forecast period 2026-2030
Growth momentum & CAGR Accelerate at a CAGR of 43.4%
Market growth 2026-2030 USD 3417.9 million
Market structure Fragmented
YoY growth 2025-2026(%) 41.6%
Key countries US, Canada, Mexico, Germany, France, UK, Italy, The Netherlands, Spain, China, Japan, India, South Korea, Australia, Indonesia, Saudi Arabia, UAE, South Africa, Israel, Turkey, Brazil, Argentina and Colombia
Competitive landscape Leading Companies, Market Positioning of Companies, Competitive Strategies, and Industry Risks

Request Free Sample

Research Analyst Overview

  • The post quantum cryptography market is rapidly maturing from theoretical research into practical deployment, driven by the existential quantum computing threat to modern public key encryption. The industry-wide shift toward adopting quantum-resistant algorithms is now a strategic imperative. This transition involves more than just swapping cryptographic primitives; it requires a deep commitment to crypto-agility and a redesign of security architectures.
  • Boardroom decisions are increasingly focused on risk mitigation strategies, such as adopting hybrid cryptography, which blends classical and post-quantum methods to ensure a seamless security posture during the multi-year migration. Key technologies like lattice-based cryptography and hash-based signatures, now part of the NIST PQC standardization, are being integrated into key exchange protocols and digital signatures.
  • However, performance remains a key consideration, with some hardware security modules experiencing up to a 15% increase in power consumption, influencing hardware selection for secure boot process and firmware signing.
  • The goal is to achieve forward secrecy without compromising operational efficiency, a challenge that requires careful planning to guard against both side-channel attacks and future quantum threats from a cryptographically relevant quantum computer.

What are the Key Data Covered in this Post Quantum Cryptography Market Research and Growth Report?

  • What is the expected growth of the Post Quantum Cryptography Market between 2026 and 2030?

    • USD 3.42 billion, at a CAGR of 43.4%

  • What segmentation does the market report cover?

    • The report is segmented by Type (Lattice-based, Code-based, Hash-based, and Others), Component (Software, Services, and Hardware), Application (Network security, Cloud security, Application security, and Others) and Geography (North America, Europe, APAC, Middle East and Africa, South America)

  • Which regions are analyzed in the report?

    • North America, Europe, APAC, Middle East and Africa and South America

  • What are the key growth drivers and market challenges?

    • Escalating threat of quantum computing, Migration complexity and cost

  • Who are the major players in the Post Quantum Cryptography Market?

    • Amazon.com Inc., Cisco Systems Inc., Cloudflare Inc., Google Cloud, IDEMIA France SAS, Infineon Technologies AG, Intel Corp., IBM Corp., Microsoft Corp., NEC Corp., NXP Semiconductors NV, Palo Alto Networks Inc., Qualcomm Inc., Quantinuum Ltd., STMicroelectronics NV, Thales Group and Toshiba Corp.

Market Research Insights

  • The market's dynamics are shaped by a strategic push toward quantum-safe communication, driven by the need to secure critical infrastructure and ensure long-term data security. Organizations are actively pursuing a PQC migration strategy, balancing the adoption of standardized PQC algorithms with practical implementation challenges.
  • This transition is not without friction; benchmark studies show that some PQC hardware accelerators can lead to a 15% increase in power consumption in embedded systems, a key consideration for PQC for IoT devices.
  • Furthermore, a significant talent gap persists, with less than 5% of cybersecurity professionals feeling fully equipped to manage a migration, highlighting the critical need for PQC implementation services and quantum risk assessment. The adoption of a hybrid cryptographic approach offers a pragmatic path forward, allowing for a phased transition while providing robust security.

We can help! Our analysts can customize this post quantum cryptography market research report to meet your requirements.

Get in touch

1. Executive Summary

1.1 Market overview

Executive Summary - Chart on Market Overview
Executive Summary - Data Table on Market Overview
Executive Summary - Chart on Global Market Characteristics
Executive Summary - Chart on Market by Geography
Executive Summary - Chart on Market Segmentation by Type
Executive Summary - Chart on Market Segmentation by Component
Executive Summary - Chart on Market Segmentation by Application
Executive Summary - Chart on Incremental Growth
Executive Summary - Data Table on Incremental Growth
Executive Summary - Chart on Company Market Positioning

2. Technavio Analysis

2.1 Analysis of price sensitivity, lifecycle, customer purchase basket, adoption rates, and purchase criteria

2.2 Criticality of inputs and Factors of differentiation

Chart on Overview on criticality of inputs and factors of differentiation

2.3 Factors of disruption

Chart on Overview on factors of disruption

2.4 Impact of drivers and challenges

Chart on Impact of drivers and challenges in 2025 and 2030

3. Market Landscape

3.1 Market ecosystem

Chart on Parent Market
Data Table on - Parent Market

3.2 Market characteristics

Chart on Market characteristics analysis

3.3 Value chain analysis

Chart on Value chain analysis

4. Market Sizing

4.1 Market definition

Data Table on Offerings of companies included in the market definition

4.2 Market segment analysis

Market segments

4.3 Market size 2025

4.4 Market outlook: Forecast for 2025-2030

Chart on Global - Market size and forecast 2025-2030 ($ million)
Data Table on Global - Market size and forecast 2025-2030 ($ million)
Chart on Global Market: Year-over-year growth 2025-2030 (%)
Data Table on Global Market: Year-over-year growth 2025-2030 (%)

5. Historic Market Size

5.1 Global Post Quantum Cryptography Market 2020 - 2024

Historic Market Size - Data Table on Global Post Quantum Cryptography Market 2020 - 2024 ($ million)

5.2 Type segment analysis 2020 - 2024

Historic Market Size - Type Segment 2020 - 2024 ($ million)

5.3 Component segment analysis 2020 - 2024

Historic Market Size - Component Segment 2020 - 2024 ($ million)

5.4 Application segment analysis 2020 - 2024

Historic Market Size - Application Segment 2020 - 2024 ($ million)

5.5 Geography segment analysis 2020 - 2024

Historic Market Size - Geography Segment 2020 - 2024 ($ million)

5.6 Country segment analysis 2020 - 2024

Historic Market Size - Country Segment 2020 - 2024 ($ million)

6. Qualitative Analysis

6.1 The AI impact on global post quantum cryptography market

7. Five Forces Analysis

7.1 Five forces summary

Five forces analysis - Comparison between 2025 and 2030

7.2 Bargaining power of buyers

Bargaining power of buyers - Impact of key factors 2025 and 2030

7.3 Bargaining power of suppliers

Bargaining power of suppliers - Impact of key factors in 2025 and 2030

7.4 Threat of new entrants

Threat of new entrants - Impact of key factors in 2025 and 2030

7.5 Threat of substitutes

Threat of substitutes - Impact of key factors in 2025 and 2030

7.6 Threat of rivalry

Threat of rivalry - Impact of key factors in 2025 and 2030

7.7 Market condition

Chart on Market condition - Five forces 2025 and 2030

8. Market Segmentation by Type

8.1 Market segments

Chart on Type - Market share 2025-2030 (%)
Data Table on Type - Market share 2025-2030 (%)

8.2 Comparison by Type

Chart on Comparison by Type
Data Table on Comparison by Type

8.3 Lattice-based - Market size and forecast 2025-2030

Chart on Lattice-based - Market size and forecast 2025-2030 ($ million)
Data Table on Lattice-based - Market size and forecast 2025-2030 ($ million)
Chart on Lattice-based - Year-over-year growth 2025-2030 (%)
Data Table on Lattice-based - Year-over-year growth 2025-2030 (%)

8.4 Code-based - Market size and forecast 2025-2030

Chart on Code-based - Market size and forecast 2025-2030 ($ million)
Data Table on Code-based - Market size and forecast 2025-2030 ($ million)
Chart on Code-based - Year-over-year growth 2025-2030 (%)
Data Table on Code-based - Year-over-year growth 2025-2030 (%)

8.5 Hash-based - Market size and forecast 2025-2030

Chart on Hash-based - Market size and forecast 2025-2030 ($ million)
Data Table on Hash-based - Market size and forecast 2025-2030 ($ million)
Chart on Hash-based - Year-over-year growth 2025-2030 (%)
Data Table on Hash-based - Year-over-year growth 2025-2030 (%)

8.6 Others - Market size and forecast 2025-2030

Chart on Others - Market size and forecast 2025-2030 ($ million)
Data Table on Others - Market size and forecast 2025-2030 ($ million)
Chart on Others - Year-over-year growth 2025-2030 (%)
Data Table on Others - Year-over-year growth 2025-2030 (%)

8.7 Market opportunity by Type

Market opportunity by Type ($ million)
Data Table on Market opportunity by Type ($ million)

9. Market Segmentation by Component

9.1 Market segments

Chart on Component - Market share 2025-2030 (%)
Data Table on Component - Market share 2025-2030 (%)

9.2 Comparison by Component

Chart on Comparison by Component
Data Table on Comparison by Component

9.3 Software - Market size and forecast 2025-2030

Chart on Software - Market size and forecast 2025-2030 ($ million)
Data Table on Software - Market size and forecast 2025-2030 ($ million)
Chart on Software - Year-over-year growth 2025-2030 (%)
Data Table on Software - Year-over-year growth 2025-2030 (%)

9.4 Services - Market size and forecast 2025-2030

Chart on Services - Market size and forecast 2025-2030 ($ million)
Data Table on Services - Market size and forecast 2025-2030 ($ million)
Chart on Services - Year-over-year growth 2025-2030 (%)
Data Table on Services - Year-over-year growth 2025-2030 (%)

9.5 Hardware - Market size and forecast 2025-2030

Chart on Hardware - Market size and forecast 2025-2030 ($ million)
Data Table on Hardware - Market size and forecast 2025-2030 ($ million)
Chart on Hardware - Year-over-year growth 2025-2030 (%)
Data Table on Hardware - Year-over-year growth 2025-2030 (%)

9.6 Market opportunity by Component

Market opportunity by Component ($ million)
Data Table on Market opportunity by Component ($ million)

10. Market Segmentation by Application

10.1 Market segments

Chart on Application - Market share 2025-2030 (%)
Data Table on Application - Market share 2025-2030 (%)

10.2 Comparison by Application

Chart on Comparison by Application
Data Table on Comparison by Application

10.3 Network security - Market size and forecast 2025-2030

Chart on Network security - Market size and forecast 2025-2030 ($ million)
Data Table on Network security - Market size and forecast 2025-2030 ($ million)
Chart on Network security - Year-over-year growth 2025-2030 (%)
Data Table on Network security - Year-over-year growth 2025-2030 (%)

10.4 Cloud security - Market size and forecast 2025-2030

Chart on Cloud security - Market size and forecast 2025-2030 ($ million)
Data Table on Cloud security - Market size and forecast 2025-2030 ($ million)
Chart on Cloud security - Year-over-year growth 2025-2030 (%)
Data Table on Cloud security - Year-over-year growth 2025-2030 (%)

10.5 Application security - Market size and forecast 2025-2030

Chart on Application security - Market size and forecast 2025-2030 ($ million)
Data Table on Application security - Market size and forecast 2025-2030 ($ million)
Chart on Application security - Year-over-year growth 2025-2030 (%)
Data Table on Application security - Year-over-year growth 2025-2030 (%)

10.6 Others - Market size and forecast 2025-2030

Chart on Others - Market size and forecast 2025-2030 ($ million)
Data Table on Others - Market size and forecast 2025-2030 ($ million)
Chart on Others - Year-over-year growth 2025-2030 (%)
Data Table on Others - Year-over-year growth 2025-2030 (%)

10.7 Market opportunity by Application

Market opportunity by Application ($ million)
Data Table on Market opportunity by Application ($ million)

11. Customer Landscape

11.1 Customer landscape overview

Analysis of price sensitivity, lifecycle, customer purchase basket, adoption rates, and purchase criteria

12. Geographic Landscape

12.1 Geographic segmentation

Chart on Market share by geography 2025-2030 (%)
Data Table on Market share by geography 2025-2030 (%)

12.2 Geographic comparison

Chart on Geographic comparison
Data Table on Geographic comparison

12.3 North America - Market size and forecast 2025-2030

Chart on North America - Market size and forecast 2025-2030 ($ million)
Data Table on North America - Market size and forecast 2025-2030 ($ million)
Chart on North America - Year-over-year growth 2025-2030 (%)
Data Table on North America - Year-over-year growth 2025-2030 (%)
Chart on Regional Comparison - North America
Data Table on Regional Comparison - North America

12.3.1 US - Market size and forecast 2025-2030

Chart on US - Market size and forecast 2025-2030 ($ million)
Data Table on US - Market size and forecast 2025-2030 ($ million)
Chart on US - Year-over-year growth 2025-2030 (%)
Data Table on US - Year-over-year growth 2025-2030 (%)

12.3.2 Canada - Market size and forecast 2025-2030

Chart on Canada - Market size and forecast 2025-2030 ($ million)
Data Table on Canada - Market size and forecast 2025-2030 ($ million)
Chart on Canada - Year-over-year growth 2025-2030 (%)
Data Table on Canada - Year-over-year growth 2025-2030 (%)

12.3.3 Mexico - Market size and forecast 2025-2030

Chart on Mexico - Market size and forecast 2025-2030 ($ million)
Data Table on Mexico - Market size and forecast 2025-2030 ($ million)
Chart on Mexico - Year-over-year growth 2025-2030 (%)
Data Table on Mexico - Year-over-year growth 2025-2030 (%)

12.4 Europe - Market size and forecast 2025-2030

Chart on Europe - Market size and forecast 2025-2030 ($ million)
Data Table on Europe - Market size and forecast 2025-2030 ($ million)
Chart on Europe - Year-over-year growth 2025-2030 (%)
Data Table on Europe - Year-over-year growth 2025-2030 (%)
Chart on Regional Comparison - Europe
Data Table on Regional Comparison - Europe

12.4.1 Germany - Market size and forecast 2025-2030

Chart on Germany - Market size and forecast 2025-2030 ($ million)
Data Table on Germany - Market size and forecast 2025-2030 ($ million)
Chart on Germany - Year-over-year growth 2025-2030 (%)
Data Table on Germany - Year-over-year growth 2025-2030 (%)

12.4.2 France - Market size and forecast 2025-2030

Chart on France - Market size and forecast 2025-2030 ($ million)
Data Table on France - Market size and forecast 2025-2030 ($ million)
Chart on France - Year-over-year growth 2025-2030 (%)
Data Table on France - Year-over-year growth 2025-2030 (%)

12.4.3 UK - Market size and forecast 2025-2030

Chart on UK - Market size and forecast 2025-2030 ($ million)
Data Table on UK - Market size and forecast 2025-2030 ($ million)
Chart on UK - Year-over-year growth 2025-2030 (%)
Data Table on UK - Year-over-year growth 2025-2030 (%)

12.4.4 Italy - Market size and forecast 2025-2030

Chart on Italy - Market size and forecast 2025-2030 ($ million)
Data Table on Italy - Market size and forecast 2025-2030 ($ million)
Chart on Italy - Year-over-year growth 2025-2030 (%)
Data Table on Italy - Year-over-year growth 2025-2030 (%)

12.4.5 The Netherlands - Market size and forecast 2025-2030

Chart on The Netherlands - Market size and forecast 2025-2030 ($ million)
Data Table on The Netherlands - Market size and forecast 2025-2030 ($ million)
Chart on The Netherlands - Year-over-year growth 2025-2030 (%)
Data Table on The Netherlands - Year-over-year growth 2025-2030 (%)

12.4.6 Spain - Market size and forecast 2025-2030

Chart on Spain - Market size and forecast 2025-2030 ($ million)
Data Table on Spain - Market size and forecast 2025-2030 ($ million)
Chart on Spain - Year-over-year growth 2025-2030 (%)
Data Table on Spain - Year-over-year growth 2025-2030 (%)

12.5 APAC - Market size and forecast 2025-2030

Chart on APAC - Market size and forecast 2025-2030 ($ million)
Data Table on APAC - Market size and forecast 2025-2030 ($ million)
Chart on APAC - Year-over-year growth 2025-2030 (%)
Data Table on APAC - Year-over-year growth 2025-2030 (%)
Chart on Regional Comparison - APAC
Data Table on Regional Comparison - APAC

12.5.1 China - Market size and forecast 2025-2030

Chart on China - Market size and forecast 2025-2030 ($ million)
Data Table on China - Market size and forecast 2025-2030 ($ million)
Chart on China - Year-over-year growth 2025-2030 (%)
Data Table on China - Year-over-year growth 2025-2030 (%)

12.5.2 Japan - Market size and forecast 2025-2030

Chart on Japan - Market size and forecast 2025-2030 ($ million)
Data Table on Japan - Market size and forecast 2025-2030 ($ million)
Chart on Japan - Year-over-year growth 2025-2030 (%)
Data Table on Japan - Year-over-year growth 2025-2030 (%)

12.5.3 India - Market size and forecast 2025-2030

Chart on India - Market size and forecast 2025-2030 ($ million)
Data Table on India - Market size and forecast 2025-2030 ($ million)
Chart on India - Year-over-year growth 2025-2030 (%)
Data Table on India - Year-over-year growth 2025-2030 (%)

12.5.4 South Korea - Market size and forecast 2025-2030

Chart on South Korea - Market size and forecast 2025-2030 ($ million)
Data Table on South Korea - Market size and forecast 2025-2030 ($ million)
Chart on South Korea - Year-over-year growth 2025-2030 (%)
Data Table on South Korea - Year-over-year growth 2025-2030 (%)

12.5.5 Australia - Market size and forecast 2025-2030

Chart on Australia - Market size and forecast 2025-2030 ($ million)
Data Table on Australia - Market size and forecast 2025-2030 ($ million)
Chart on Australia - Year-over-year growth 2025-2030 (%)
Data Table on Australia - Year-over-year growth 2025-2030 (%)

12.5.6 Indonesia - Market size and forecast 2025-2030

Chart on Indonesia - Market size and forecast 2025-2030 ($ million)
Data Table on Indonesia - Market size and forecast 2025-2030 ($ million)
Chart on Indonesia - Year-over-year growth 2025-2030 (%)
Data Table on Indonesia - Year-over-year growth 2025-2030 (%)

12.6 Middle East and Africa - Market size and forecast 2025-2030

Chart on Middle East and Africa - Market size and forecast 2025-2030 ($ million)
Data Table on Middle East and Africa - Market size and forecast 2025-2030 ($ million)
Chart on Middle East and Africa - Year-over-year growth 2025-2030 (%)
Data Table on Middle East and Africa - Year-over-year growth 2025-2030 (%)
Chart on Regional Comparison - Middle East and Africa
Data Table on Regional Comparison - Middle East and Africa

12.6.1 Saudi Arabia - Market size and forecast 2025-2030

Chart on Saudi Arabia - Market size and forecast 2025-2030 ($ million)
Data Table on Saudi Arabia - Market size and forecast 2025-2030 ($ million)
Chart on Saudi Arabia - Year-over-year growth 2025-2030 (%)
Data Table on Saudi Arabia - Year-over-year growth 2025-2030 (%)

12.6.2 UAE - Market size and forecast 2025-2030

Chart on UAE - Market size and forecast 2025-2030 ($ million)
Data Table on UAE - Market size and forecast 2025-2030 ($ million)
Chart on UAE - Year-over-year growth 2025-2030 (%)
Data Table on UAE - Year-over-year growth 2025-2030 (%)

12.6.3 South Africa - Market size and forecast 2025-2030

Chart on South Africa - Market size and forecast 2025-2030 ($ million)
Data Table on South Africa - Market size and forecast 2025-2030 ($ million)
Chart on South Africa - Year-over-year growth 2025-2030 (%)
Data Table on South Africa - Year-over-year growth 2025-2030 (%)

12.6.4 Israel - Market size and forecast 2025-2030

Chart on Israel - Market size and forecast 2025-2030 ($ million)
Data Table on Israel - Market size and forecast 2025-2030 ($ million)
Chart on Israel - Year-over-year growth 2025-2030 (%)
Data Table on Israel - Year-over-year growth 2025-2030 (%)

12.6.5 Turkey - Market size and forecast 2025-2030

Chart on Turkey - Market size and forecast 2025-2030 ($ million)
Data Table on Turkey - Market size and forecast 2025-2030 ($ million)
Chart on Turkey - Year-over-year growth 2025-2030 (%)
Data Table on Turkey - Year-over-year growth 2025-2030 (%)

12.7 South America - Market size and forecast 2025-2030

Chart on South America - Market size and forecast 2025-2030 ($ million)
Data Table on South America - Market size and forecast 2025-2030 ($ million)
Chart on South America - Year-over-year growth 2025-2030 (%)
Data Table on South America - Year-over-year growth 2025-2030 (%)
Chart on Regional Comparison - South America
Data Table on Regional Comparison - South America

12.7.1 Brazil - Market size and forecast 2025-2030

Chart on Brazil - Market size and forecast 2025-2030 ($ million)
Data Table on Brazil - Market size and forecast 2025-2030 ($ million)
Chart on Brazil - Year-over-year growth 2025-2030 (%)
Data Table on Brazil - Year-over-year growth 2025-2030 (%)

12.7.2 Argentina - Market size and forecast 2025-2030

Chart on Argentina - Market size and forecast 2025-2030 ($ million)
Data Table on Argentina - Market size and forecast 2025-2030 ($ million)
Chart on Argentina - Year-over-year growth 2025-2030 (%)
Data Table on Argentina - Year-over-year growth 2025-2030 (%)

12.7.3 Colombia - Market size and forecast 2025-2030

Chart on Colombia - Market size and forecast 2025-2030 ($ million)
Data Table on Colombia - Market size and forecast 2025-2030 ($ million)
Chart on Colombia - Year-over-year growth 2025-2030 (%)
Data Table on Colombia - Year-over-year growth 2025-2030 (%)

12.8 Market opportunity by geography

Market opportunity by geography ($ million)
Data Tables on Market opportunity by geography ($ million)

13. Drivers, Challenges, and Opportunity

13.1 Market drivers

Escalating threat of quantum computing
Government initiatives and standardization efforts
Long term data security

13.2 Market challenges

Migration complexity and cost
Performance overhead and resource consumption
Lack of skilled personnel and awareness

13.3 Impact of drivers and challenges

Impact of drivers and challenges in 2025 and 2030

13.4 Market opportunities

Accelerated standardization and government mandates
Hybrid cryptography adoption
Integration into existing security ecosystems

14. Competitive Landscape

14.1 Overview

14.2

Overview on criticality of inputs and factors of differentiation

14.3 Landscape disruption

Overview on factors of disruption

14.4 Industry risks

Impact of key risks on business

15. Competitive Analysis

15.1 Companies profiled

Companies covered

15.2 Company ranking index

15.3 Market positioning of companies

Matrix on companies position and classification

15.4 Amazon.com Inc.

Amazon.com Inc. - Overview
Amazon.com Inc. - Business segments
Amazon.com Inc. - Key news
Amazon.com Inc. - Key offerings
Amazon.com Inc. - Segment focus
SWOT

15.5 Cisco Systems Inc.

Cisco Systems Inc. - Overview
Cisco Systems Inc. - Business segments
Cisco Systems Inc. - Key news
Cisco Systems Inc. - Key offerings
Cisco Systems Inc. - Segment focus
SWOT

15.6 Google Cloud

Google Cloud - Overview
Google Cloud - Product / Service
Google Cloud - Key offerings
SWOT

15.7 IDEMIA France SAS

IDEMIA France SAS - Overview
IDEMIA France SAS - Product / Service
IDEMIA France SAS - Key news
IDEMIA France SAS - Key offerings
SWOT

15.8 Infineon Technologies AG

Infineon Technologies AG - Overview
Infineon Technologies AG - Business segments
Infineon Technologies AG - Key news
Infineon Technologies AG - Key offerings
Infineon Technologies AG - Segment focus
SWOT

15.9 Intel Corp.

Intel Corp. - Overview
Intel Corp. - Business segments
Intel Corp. - Key news
Intel Corp. - Key offerings
Intel Corp. - Segment focus
SWOT

15.10 IBM Corp.

IBM Corp. - Overview
IBM Corp. - Business segments
IBM Corp. - Key news
IBM Corp. - Key offerings
IBM Corp. - Segment focus
SWOT

15.11 Microsoft Corp.

Microsoft Corp. - Overview
Microsoft Corp. - Business segments
Microsoft Corp. - Key news
Microsoft Corp. - Key offerings
Microsoft Corp. - Segment focus
SWOT

15.12 NEC Corp.

NEC Corp. - Overview
NEC Corp. - Business segments
NEC Corp. - Key news
NEC Corp. - Key offerings
NEC Corp. - Segment focus
SWOT

15.13 NXP Semiconductors NV

NXP Semiconductors NV - Overview
NXP Semiconductors NV - Product / Service
NXP Semiconductors NV - Key offerings
SWOT

15.14 Palo Alto Networks Inc.

Palo Alto Networks Inc. - Overview
Palo Alto Networks Inc. - Product / Service
Palo Alto Networks Inc. - Key news
Palo Alto Networks Inc. - Key offerings
SWOT

15.15 Qualcomm Inc.

Qualcomm Inc. - Overview
Qualcomm Inc. - Business segments
Qualcomm Inc. - Key news
Qualcomm Inc. - Key offerings
Qualcomm Inc. - Segment focus
SWOT

15.16 STMicroelectronics NV

STMicroelectronics NV - Overview
STMicroelectronics NV - Business segments
STMicroelectronics NV - Key news
STMicroelectronics NV - Key offerings
STMicroelectronics NV - Segment focus
SWOT

15.17 Thales Group

Thales Group - Overview
Thales Group - Business segments
Thales Group - Key news
Thales Group - Key offerings
Thales Group - Segment focus
SWOT

15.18 Toshiba Corp.

Toshiba Corp. - Overview
Toshiba Corp. - Business segments
Toshiba Corp. - Key news
Toshiba Corp. - Key offerings
Toshiba Corp. - Segment focus
SWOT

16. Appendix

16.1 Scope of the report

Market definition
Objectives
Notes and caveats

16.2 Inclusions and exclusions checklist

Inclusions checklist
Exclusions checklist

16.3 Currency conversion rates for US$

16.4 Research methodology

16.5 Data procurement

Information sources

16.6 Data validation

16.7 Validation techniques employed for market sizing

16.8 Data synthesis

16.9 360 degree market analysis

16.10 List of abbreviations

Research Methodology

Technavio presents a detailed picture of the market by way of study, synthesis, and summation of data from multiple sources. The analysts have presented the various facets of the market with a particular focus on identifying the key industry influencers. The data thus presented is comprehensive, reliable, and the result of extensive research, both primary and secondary.

INFORMATION SOURCES

Primary sources

  • Manufacturers and suppliers
  • Channel partners
  • Industry experts
  • Strategic decision makers

Secondary sources

  • Industry journals and periodicals
  • Government data
  • Financial reports of key industry players
  • Historical data
  • Press releases

DATA ANALYSIS

Data Synthesis

  • Collation of data
  • Estimation of key figures
  • Analysis of derived insights

Data Validation

  • Triangulation with data models
  • Reference against proprietary databases
  • Corroboration with industry experts

REPORT WRITING

Qualitative

  • Market drivers
  • Market challenges
  • Market trends
  • Five forces analysis

Quantitative

  • Market size and forecast
  • Market segmentation
  • Geographical insights
  • Competitive landscape

Interested in this report?

Get your sample now to see our research methodology and insights!

Download Now

Frequently Asked Questions

Post Quantum Cryptography market growth will increase by USD 3417.9 million during 2026-2030 .

The Post Quantum Cryptography market is expected to grow at a CAGR of 43.4% during 2026-2030 .

Post Quantum Cryptography market is segmented by Type (Lattice-based, Code-based, Hash-based, Others) Component (Software, Services, Hardware) Application (Network security, Cloud security, Application security, Others)

Amazon.com Inc., Cisco Systems Inc., Cloudflare Inc., Google Cloud, IDEMIA France SAS, Infineon Technologies AG, Intel Corp., IBM Corp., Microsoft Corp., NEC Corp., NXP Semiconductors NV, Palo Alto Networks Inc., Qualcomm Inc., Quantinuum Ltd., STMicroelectronics NV, Thales Group, Toshiba Corp. are a few of the key vendors in the Post Quantum Cryptography market.

North America will register the highest growth rate of 40.3% among the other regions. Therefore, the Post Quantum Cryptography market in North America is expected to garner significant business opportunities for the vendors during the forecast period.

US, Canada, Mexico, Germany, France, UK, Italy, The Netherlands, Spain, China, Japan, India, South Korea, Australia, Indonesia, Saudi Arabia, UAE, South Africa, Israel, Turkey, Brazil, Argentina, Colombia

  • Escalating threat of quantum computing is the driving factor this market.

The Post Quantum Cryptography market vendors should focus on grabbing business opportunities from the Type segment as it accounted for the largest market share in the base year.