Power Amplifier Market Analysis APAC, North America, Europe, South America, Middle East and Africa - US, China, Japan, South Korea, Germany - Size and Forecast 2024-2028

Power Amplifier Market Analysis APAC, North America, Europe, South America, Middle East and Africa - US, China, Japan, South Korea, Germany - Size and Forecast 2024-2028

Published: Feb 2024 169 Pages SKU: IRTNTR72961

Market Overview at a Glance

$15.6 B
Market Opportunity
8.45%
CAGR
10.77
YoY growth 2023-2024(%)

Power Amplifier Market Size 2024-2028

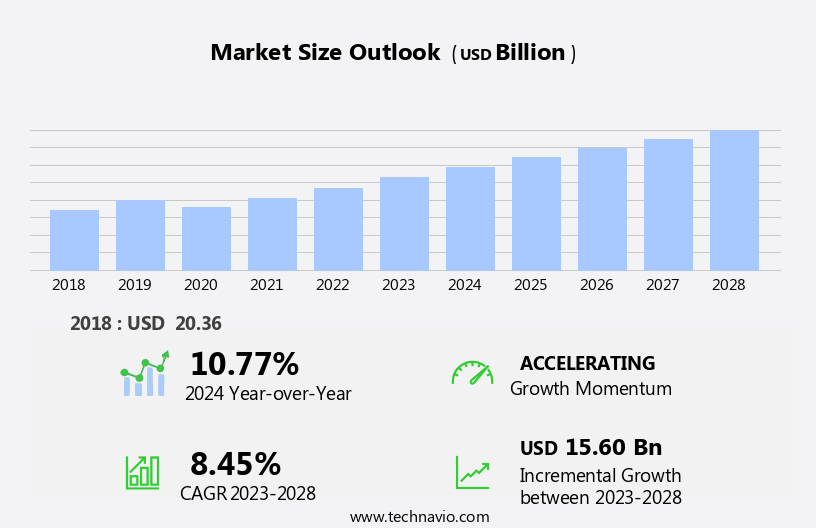
The power amplifier market size is forecast to increase by USD 15.60 billion at a CAGR of 8.45% between 2023 and 2028.

  • The market is experiencing significant growth, driven by the increasing adoption of Long-Term Evolution (LTE) technology and the availability of alternative manufacturing techniques to Gallium Arsenide (GaAs). LTE, a fourth-generation mobile telecommunications technology, requires advanced power amplifiers to support high data transfer rates and improved network coverage. Consequently, the demand for power amplifiers is escalating in the telecommunications sector. However, the market is not without complexities. The complexity associated with frequency bands for smartphones is a notable challenge. With the proliferation of various frequency bands, power amplifier manufacturers must develop solutions that cater to diverse frequency requirements.
  • Moreover, the emergence of alternative manufacturing techniques, such as Silicon-Germanium (SiGe) and Gallium Nitride (GaN), poses competition to GaAs-based power amplifiers. Companies seeking to capitalize on market opportunities must stay abreast of these trends and adapt their strategies accordingly. Effective navigation of these challenges requires a deep of the evolving technological landscape and a commitment to innovation.

What will be the Size of the Power Amplifier Market during the forecast period?

Power Amplifier Market Size

 Request Free Sample

  • The market encompasses a wide range of applications, including consumer electronics, telecommunications, industrial, military and defense, and medical devices. Key drivers of market growth include the deployment of 5G networks, which require high-power RF power amplifiers for signal amplification, and the expansion of the Internet of Things (IoT) and wireless connectivity in various industries. Indium phosphide and gallium nitride are among the semiconductor materials used in power amplifier production, with silicon and silicon germanium also playing significant roles. Market size is substantial, with audio power amplifiers finding extensive use in consumer electronics such as modern smartphones, tablets, and audio systems.
  • Linear power amplifiers are also in demand for network infrastructure and military applications. Overall, the market is experiencing activity and growth, fueled by the increasing need for high-power output and efficient signal amplification across diverse industries.

How is this Power Amplifier Industry segmented?

The power amplifier industry research report provides comprehensive data (region-wise segment analysis), with forecasts and estimates in "USD billion" for the period 2024-2028, as well as historical data from 2018-2022 for the following segments.

  • Technology
    • CMOS
    • GaAs/GaN/SiGe
  • Application
    • Consumer electronics
    • Wireless communication
    • Industrial
  • Geography
    • APAC
      • China
      • Japan
      • South Korea
    • North America
      • US
    • Europe
      • Germany
    • South America
      • Middle East and Africa

      By Technology Insights

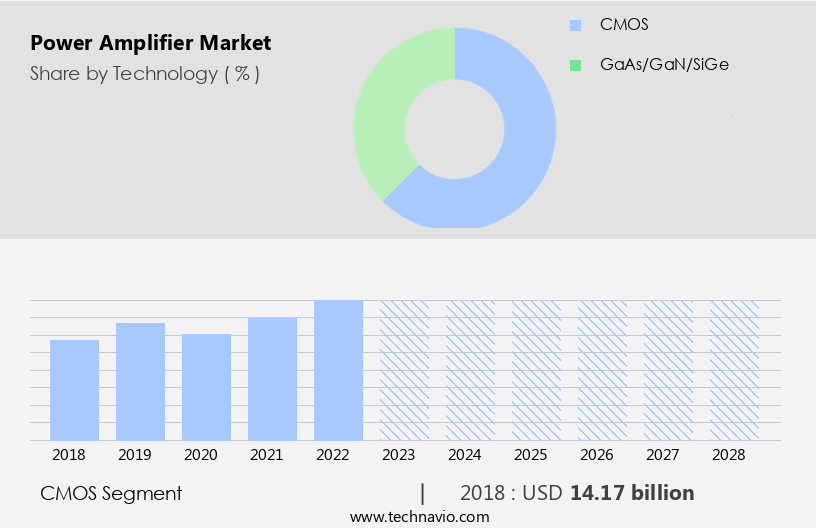
      The cmos segment is estimated to witness significant growth during the forecast period.

      Power amplifiers play a crucial role in various industries, including Home Entertainment Systems, Telecommunication, Industrial Automation, and Renewable energy systems. CMOS technology is the preferred choice for highly integrated baseband and transceiver dies in mobile radios due to its cost-effectiveness and ability to integrate a large number of transistors. Although transceiver and baseband ICs were once separate dies, they are now merged onto a single CMOS chip, significantly reducing overall costs. However, integrating power amplifiers onto the same die for true single-chip radios is unlikely due to practical considerations. Advanced materials like Indium Phosphide, Gallium nitride, Silicon germanium, and Silicon are used to develop power amplifiers for high power output and energy efficiency.

      These amplifiers are essential for 5G Cellular Networks, Wireless communication systems, and Modern Smartphones, enabling high data rates, wireless connectivity, and signal amplification. Additionally, power amplifiers are utilized in M2M Communication, Telecommunication, Military and Defense, Aerospace and defense, Smart-home Applications, Medical Devices, and Network infrastructure. Energy-efficient solutions, such as Class-D Audio Amplifiers and Linear power amplifiers, are gaining popularity due to the increasing demand for compact amplifiers in Consumer electronics, including PCs and Laptops, Tablets, Music Streaming Services, and Audio Equipment. Furthermore, power amplifiers are integral to the development of 5G Cellular Infrastructure, Internet of Things, and 5G deployment, enabling LTE technology and IoT expansion.

      Power Amplifier Market Size

      Get a glance at the market report of share of various segments Request Free Sample

      The CMOS segment was valued at USD 14.17 billion in 2018 and showed a gradual increase during the forecast period.

      Regional Analysis

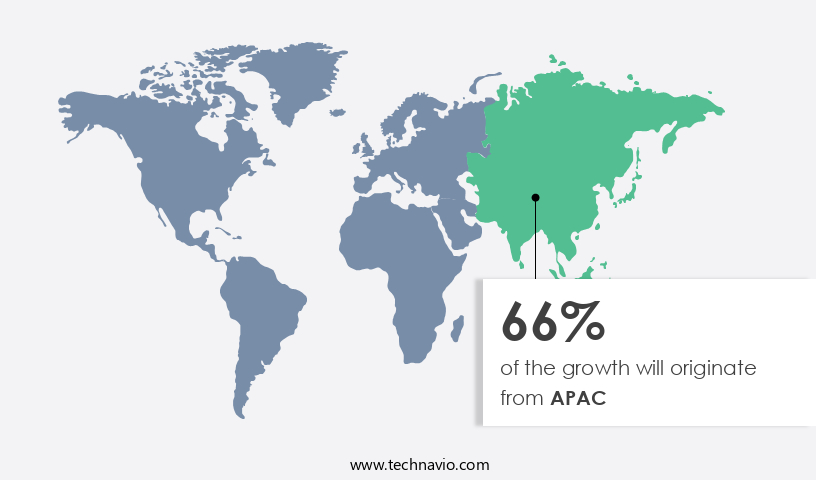
      APAC is estimated to contribute 66% to the growth of the global market during the forecast period.Technavio’s analysts have elaborately explained the regional trends and drivers that shape the market during the forecast period.

      Power Amplifier Market Share by Geography

      For more insights on the market size of various regions, Request Free Sample

      The market encompasses various industries, including Home Entertainment Systems, Telecommunication, Industrial, Renewable energy systems, M2M Communication, and Consumer Electronics. In 2023, APAC was the leading contributor to the market, with China and Japan being significant revenue generators. The region's growth can be attributed to the early deployment of advanced technologies like 5G Cellular Networks, IoT expansion, and the increasing demand for energy-efficient solutions in Industrial Automation and Telecommunications. The penetration of mobile Internet in APAC reached 42% in 2020, fueling the demand for power amplifiers in Mobile Hotspots and Smartphones. Additionally, the rise in government initiatives for building smart cities and long-term investments in smart technologies are expected to further propel market growth.

      Advanced materials such as Indium Phosphide, Gallium nitride, Silicon Germanium, and Silicon are increasingly being used in the production of Audio-Power Amplifiers, Linear Power Amplifiers, RF Power Amplifiers, and Class-D Audio Amplifiers for applications in Audio Equipment, Medical Devices, and Network Infrastructure. In the Telecommunications sector, the growing need for high data rates and signal amplification in 5G Cellular Infrastructure and Aerospace and Defense communication systems is driving the demand for power amplifiers. Furthermore, the increasing popularity of Music Streaming Services and the proliferation of Modern Smartphones and Tablets are expected to boost market growth.

      Wireless communication systems, including Wireless connectivity and RF Power Amplifiers, are essential components in various applications, including Industrial Automation, Military and Defense, and Smart-home Applications. The adoption of these systems is expected to continue growing due to their role in enabling seamless communication and signal integrity. In , the market is witnessing significant growth due to the increasing demand for energy-efficient solutions, advanced materials, and wireless communication systems across various industries. The market is expected to continue expanding as technology advances and new applications emerge.

      Market Dynamics

      Our researchers analyzed the data with 2023 as the base year, along with the key drivers, trends, and challenges. A holistic analysis of drivers will help companies refine their marketing strategies to gain a competitive advantage.

      What are the key market drivers leading to the rise in the adoption of Power Amplifier Industry?

      • Availability of alternative manufacturing techniques of power amplifiers instead of Gallium arsenide (GaAs) is the key driver of the market. 

      • The manufacturing cost of radio frequency (RF) devices, including power amplifiers, is significantly high due to the expensive raw materials required. In response, market companies are actively exploring new materials to reduce the manufacturing costs of RF power amplifiers. Silicon and gallium arsenide (GaAs) are two potential materials gaining attention in this regard. GaAs-based power amplifiers offer several advantages, such as high saturated electron velocity and mobility, making them suitable for use at higher frequencies.
      • Moreover, GaAs is a cost-effective material and can be easily integrated with other electronic components, such as amplifier and power supply sections. As a result, the adoption of GaAs in the production of power amplifiers is expected to increase.

      What are the market trends shaping the Power Amplifier Industry?

      • Increased adoption of LTE technology is the upcoming market trend. 

      • LTE, a standard for advanced wireless data network technology, is gaining significant traction due to its ability to deliver rapid and efficient communication in areas where traditional technologies like DSL or cable may be inaccessible. LTE's distinguished features include transmission bandwidth capacities of up to 20 MHz for LTE and 100 MHz for LTE-Advanced. The exponential growth of smartphone penetration in emerging economies is driving the adoption of LTE technology, making it a crucial component of modern communication infrastructure.
      • With its high-speed data transfer capabilities, LTE is poised to revolutionize the way we connect and communicate.

      What challenges does the Power Amplifier Industry face during its growth?

      • Complexity associated with frequency bands for smartphones is a key challenge affecting the industry growth. 

      • The market faces complexity as multiple wireless communication standards, including 4G LTE, 5G, Wi-Fi, and Bluetooth, necessitate smartphones to support various frequency bands concurrently. Each standard operates on distinct frequency ranges, requiring advanced RF front-end solutions for seamless integration. Power amplifiers must handle this intricacy, ensuring efficient signal transmission and reception without interference between the diverse frequency bands. This challenge calls for advanced technologies to accommodate the increasing demand for uninterrupted connectivity across multiple frequency bands.
      • The market dynamics revolve around addressing this complexity while maintaining signal quality and power efficiency.

      Exclusive Customer Landscape

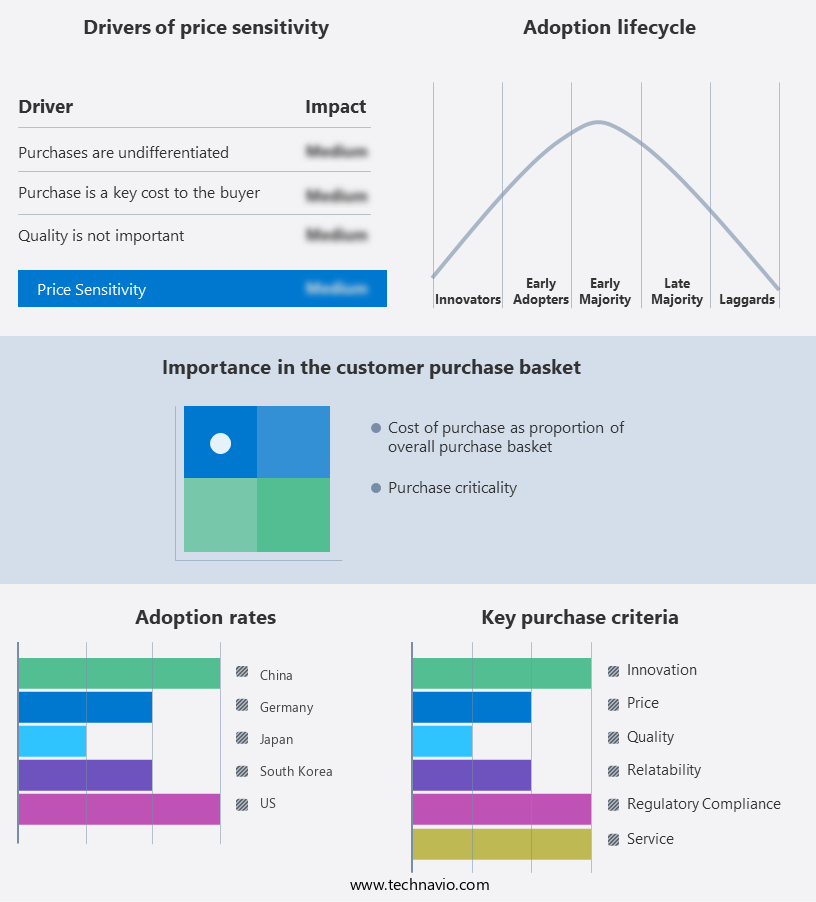
      The power amplifier market forecasting report includes the adoption lifecycle of the market, covering from the innovator’s stage to the laggard’s stage. It focuses on adoption rates in different regions based on penetration. Furthermore, the power amplifier market report also includes key purchase criteria and drivers of price sensitivity to help companies evaluate and develop their market growth analysis strategies.

      Power Amplifier Market Share by Geography

       Customer Landscape

      Key Companies & Market Insights

      Companies are implementing various strategies, such as strategic alliances, power amplifier market forecast, partnerships, mergers and acquisitions, geographical expansion, and product/service launches, to enhance their presence in the industry.

      Analog Devices Inc. - The company provides high-performing power amplifiers, such as the MCA GEN 2 Series, delivering 225 continuous watts per channel into 8 ohms, enhancing audio systems with superior power and clarity.

      The industry research and growth report includes detailed analyses of the competitive landscape of the market and information about key companies, including:

      • Analog Devices Inc.
      • Anthem
      • BONN Elektronik GmbH
      • Broadcom Inc.
      • CML Microcircuits UK Ltd.
      • Infineon Technologies AG
      • MACOM Technology Solutions Inc.
      • Microchip Technology Inc.
      • NXP Semiconductors NV
      • Peavey Electronics Corp.
      • Qorvo Inc.
      • QSC LLC
      • Qualcomm Inc.
      • Skyworks Solutions Inc.
      • Spectrum Control Microelectronics Ltd.
      • STMicroelectronics International N.V.
      • Texas Instruments Inc.
      • Toshiba Corp.
      • Yamaha Corp.
      • Murata Manufacturing Co. Ltd.

      Qualitative and quantitative analysis of companies has been conducted to help clients understand the wider business environment as well as the strengths and weaknesses of key industry players. Data is qualitatively analyzed to categorize companies as pure play, category-focused, industry-focused, and diversified; it is quantitatively analyzed to categorize companies as dominant, leading, strong, tentative, and weak.

      Research Analyst Overview

      The market encompasses a diverse range of applications, driven by the ever-increasing demand for efficient and high-performance signal amplification solutions. This market caters to various industries, including telecommunications, industrial automation, military and defense, aerospace and defense, and consumer electronics, among others. Power amplifiers play a crucial role in enhancing the power level of electrical signals to ensure effective transmission and reception in various applications. These amplifiers are integral to modern communication systems, enabling high data rates and wireless connectivity in various sectors. The telecommunications industry is a significant contributor to the market, with the ongoing expansion of 5G cellular networks driving the demand for advanced materials such as indium phosphide, gallium nitride, and silicon germanium.

      These materials offer improved power handling capabilities and efficiency, making them ideal for high power output applications in the telecommunications sector. The industrial sector also represents a substantial market for power amplifiers, with applications ranging from M2M communication and industrial automation to renewable energy systems and electric vehicles. Power amplifiers are essential in industrial settings to ensure reliable and efficient communication between various devices and systems. In the consumer electronics sector, power amplifiers are an integral component of home entertainment systems, audio equipment, and smartphones. Class-D audio amplifiers and compact amplifiers are popular choices for powering speakers and headphones, while linear power amplifiers are used in smartphones to amplify the signal from the battery to the antenna.

      The military and defense sector relies on power amplifiers for various applications, including wireless communication systems, radio-power, and signal integrity. These amplifiers are crucial for maintaining communication in challenging environments and ensuring the reliability and security of military operations. The aerospace and defense industry also utilizes power amplifiers for applications such as satellite communication, navigation systems, and radar systems. These amplifiers must be designed to operate in extreme conditions, with high power handling capabilities and efficiency. The medical devices sector is another significant market for power amplifiers, with applications ranging from medical imaging to wireless communication systems for patient monitoring and telemedicine.

      Power amplifiers are essential in medical devices to ensure reliable and efficient communication between various components and to amplify signals for imaging and monitoring applications. The market is expected to continue growing due to the increasing demand for energy-efficient solutions and the ongoing expansion of various industries, including telecommunications, industrial automation, and consumer electronics. The development of advanced materials and technologies, such as gallium nitride and silicon germanium, is also expected to drive market growth. In , the market is a dynamic and diverse industry, with applications ranging from telecommunications and industrial automation to consumer electronics and medical devices.

      Power amplifiers play a crucial role in enhancing the power level of electrical signals, enabling effective transmission and reception in various applications. The ongoing expansion of various industries and the development of advanced materials and technologies are expected to drive market growth in the coming years.

      Market Scope

      Report Coverage

      Details

      Page number

      169

      Base year

      2023

      Historic period

      2018-2022

      Forecast period

      2024-2028

      Growth momentum & CAGR

      Decelerate at a CAGR of 8.45%

      Market growth 2024-2028

      USD 15.60 billion

      Market structure

      Fragmented

      YoY growth 2023-2024(%)

      10.77

      Key countries

      US, China, Japan, South Korea, and Germany

      Competitive landscape

      Leading Companies, Market Positioning of Companies, Competitive Strategies, and Industry Risks

      Request Free Sample

      What are the Key Data Covered in this Power Amplifier Market Research and Growth Report?

      • CAGR of the Power Amplifier industry during the forecast period
      • Detailed information on factors that will drive the growth and forecasting between 2024 and 2028
      • Precise estimation of the size of the market and its contribution of the industry in focus to the parent market
      • Accurate predictions about upcoming growth and trends and changes in consumer behaviour
      • Growth of the market across APAC, North America, Europe, South America, and Middle East and Africa
      • Thorough analysis of the market’s competitive landscape and detailed information about companies
      • Comprehensive analysis of factors that will challenge the power amplifier market growth of industry companies

      We can help! Our analysts can customize this power amplifier market research report to meet your requirements.

      Get in touch


      1 Executive Summary

      • 1.1 Market overview
        • Exhibit 01: Executive Summary – Chart on Market Overview
        • Exhibit 02: Executive Summary – Data Table on Market Overview
        • Exhibit 03: Executive Summary – Chart on Global Market Characteristics
        • Exhibit 04: Executive Summary – Chart on Market by Geography
        • Exhibit 05: Executive Summary – Chart on Market Segmentation by Technology
        • Exhibit 06: Executive Summary – Chart on Market Segmentation by Application
        • Exhibit 07: Executive Summary – Chart on Incremental Growth
        • Exhibit 08: Executive Summary – Data Table on Incremental Growth
        • Exhibit 09: Executive Summary – Chart on Vendor Market Positioning

      2 Market Landscape

      • 2.1 Market ecosystem
        • Exhibit 10: Parent market
        • Exhibit 11: Market Characteristics

      3 Market Sizing

      • 3.1 Market definition
        • Exhibit 12: Offerings of vendors included in the market definition
      • 3.2 Market segment analysis
        • Exhibit 13: Market segments
      • 3.3 Market size 2023
        • 3.4 Market outlook: Forecast for 2023-2028
          • Exhibit 14: Chart on Global - Market size and forecast 2023-2028 ($ billion)
          • Exhibit 15: Data Table on Global - Market size and forecast 2023-2028 ($ billion)
          • Exhibit 16: Chart on Global Market: Year-over-year growth 2023-2028 (%)
          • Exhibit 17: Data Table on Global Market: Year-over-year growth 2023-2028 (%)

        4 Historic Market Size

        • 4.1 Global power amplifier market 2018 - 2022
          • Exhibit 18: Historic Market Size – Data Table on global power amplifier market 2018 - 2022 ($ billion)
        • 4.2 Technology Segment Analysis 2018 - 2022
          • Exhibit 19: Historic Market Size – Technology Segment 2018 - 2022 ($ billion)
        • 4.3 Application Segment Analysis 2018 - 2022
          • Exhibit 20: Historic Market Size – Application Segment 2018 - 2022 ($ billion)
        • 4.4 Geography Segment Analysis 2018 - 2022
          • Exhibit 21: Historic Market Size – Geography Segment 2018 - 2022 ($ billion)
        • 4.5 Country Segment Analysis 2018 - 2022
          • Exhibit 22: Historic Market Size – Country Segment 2018 - 2022 ($ billion)

        5 Five Forces Analysis

        • 5.1 Five forces summary
          • Exhibit 23: Five forces analysis - Comparison between 2023 and 2028
        • 5.2 Bargaining power of buyers
          • Exhibit 24: Chart on Bargaining power of buyers – Impact of key factors 2023 and 2028
        • 5.3 Bargaining power of suppliers
          • Exhibit 25: Bargaining power of suppliers – Impact of key factors in 2023 and 2028
        • 5.4 Threat of new entrants
          • Exhibit 26: Threat of new entrants – Impact of key factors in 2023 and 2028
        • 5.5 Threat of substitutes
          • Exhibit 27: Threat of substitutes – Impact of key factors in 2023 and 2028
        • 5.6 Threat of rivalry
          • Exhibit 28: Threat of rivalry – Impact of key factors in 2023 and 2028
        • 5.7 Market condition
          • Exhibit 29: Chart on Market condition - Five forces 2023 and 2028

        6 Market Segmentation by Technology

        • 6.1 Market segments
          • Exhibit 30: Chart on Technology - Market share 2023-2028 (%)
          • Exhibit 31: Data Table on Technology - Market share 2023-2028 (%)
        • 6.2 Comparison by Technology
          • Exhibit 32: Chart on Comparison by Technology
          • Exhibit 33: Data Table on Comparison by Technology
        • 6.3 CMOS - Market size and forecast 2023-2028
          • Exhibit 34: Chart on CMOS - Market size and forecast 2023-2028 ($ billion)
          • Exhibit 35: Data Table on CMOS - Market size and forecast 2023-2028 ($ billion)
          • Exhibit 36: Chart on CMOS - Year-over-year growth 2023-2028 (%)
          • Exhibit 37: Data Table on CMOS - Year-over-year growth 2023-2028 (%)
        • 6.4 GaAs/GaN/SiGe - Market size and forecast 2023-2028
          • Exhibit 38: Chart on GaAs/GaN/SiGe - Market size and forecast 2023-2028 ($ billion)
          • Exhibit 39: Data Table on GaAs/GaN/SiGe - Market size and forecast 2023-2028 ($ billion)
          • Exhibit 40: Chart on GaAs/GaN/SiGe - Year-over-year growth 2023-2028 (%)
          • Exhibit 41: Data Table on GaAs/GaN/SiGe - Year-over-year growth 2023-2028 (%)
        • 6.5 Market opportunity by Technology
          • Exhibit 42: Market opportunity by Technology ($ billion)
          • Exhibit 43: Data Table on Market opportunity by Technology ($ billion)

        7 Market Segmentation by Application

        • 7.1 Market segments
          • Exhibit 44: Chart on Application - Market share 2023-2028 (%)
          • Exhibit 45: Data Table on Application - Market share 2023-2028 (%)
        • 7.2 Comparison by Application
          • Exhibit 46: Chart on Comparison by Application
          • Exhibit 47: Data Table on Comparison by Application
        • 7.3 Consumer electronics - Market size and forecast 2023-2028
          • Exhibit 48: Chart on Consumer electronics - Market size and forecast 2023-2028 ($ billion)
          • Exhibit 49: Data Table on Consumer electronics - Market size and forecast 2023-2028 ($ billion)
          • Exhibit 50: Chart on Consumer electronics - Year-over-year growth 2023-2028 (%)
          • Exhibit 51: Data Table on Consumer electronics - Year-over-year growth 2023-2028 (%)
        • 7.4 Wireless communication - Market size and forecast 2023-2028
          • Exhibit 52: Chart on Wireless communication - Market size and forecast 2023-2028 ($ billion)
          • Exhibit 53: Data Table on Wireless communication - Market size and forecast 2023-2028 ($ billion)
          • Exhibit 54: Chart on Wireless communication - Year-over-year growth 2023-2028 (%)
          • Exhibit 55: Data Table on Wireless communication - Year-over-year growth 2023-2028 (%)
        • 7.5 Industrial - Market size and forecast 2023-2028
          • Exhibit 56: Chart on Industrial - Market size and forecast 2023-2028 ($ billion)
          • Exhibit 57: Data Table on Industrial - Market size and forecast 2023-2028 ($ billion)
          • Exhibit 58: Chart on Industrial - Year-over-year growth 2023-2028 (%)
          • Exhibit 59: Data Table on Industrial - Year-over-year growth 2023-2028 (%)
        • 7.6 Market opportunity by Application
          • Exhibit 60: Market opportunity by Application ($ billion)
          • Exhibit 61: Data Table on Market opportunity by Application ($ billion)

        8 Customer Landscape

        • 8.1 Customer landscape overview
          • Exhibit 62: Analysis of price sensitivity, lifecycle, customer purchase basket, adoption rates, and purchase criteria

        9 Geographic Landscape

        • 9.1 Geographic segmentation
          • Exhibit 63: Chart on Market share by geography 2023-2028 (%)
          • Exhibit 64: Data Table on Market share by geography 2023-2028 (%)
        • 9.2 Geographic comparison
          • Exhibit 65: Chart on Geographic comparison
          • Exhibit 66: Data Table on Geographic comparison
        • 9.3 APAC - Market size and forecast 2023-2028
          • Exhibit 67: Chart on APAC - Market size and forecast 2023-2028 ($ billion)
          • Exhibit 68: Data Table on APAC - Market size and forecast 2023-2028 ($ billion)
          • Exhibit 69: Chart on APAC - Year-over-year growth 2023-2028 (%)
          • Exhibit 70: Data Table on APAC - Year-over-year growth 2023-2028 (%)
        • 9.4 North America - Market size and forecast 2023-2028
          • Exhibit 71: Chart on North America - Market size and forecast 2023-2028 ($ billion)
          • Exhibit 72: Data Table on North America - Market size and forecast 2023-2028 ($ billion)
          • Exhibit 73: Chart on North America - Year-over-year growth 2023-2028 (%)
          • Exhibit 74: Data Table on North America - Year-over-year growth 2023-2028 (%)
        • 9.5 Europe - Market size and forecast 2023-2028
          • Exhibit 75: Chart on Europe - Market size and forecast 2023-2028 ($ billion)
          • Exhibit 76: Data Table on Europe - Market size and forecast 2023-2028 ($ billion)
          • Exhibit 77: Chart on Europe - Year-over-year growth 2023-2028 (%)
          • Exhibit 78: Data Table on Europe - Year-over-year growth 2023-2028 (%)
        • 9.6 South America - Market size and forecast 2023-2028
          • Exhibit 79: Chart on South America - Market size and forecast 2023-2028 ($ billion)
          • Exhibit 80: Data Table on South America - Market size and forecast 2023-2028 ($ billion)
          • Exhibit 81: Chart on South America - Year-over-year growth 2023-2028 (%)
          • Exhibit 82: Data Table on South America - Year-over-year growth 2023-2028 (%)
        • 9.7 Middle East and Africa - Market size and forecast 2023-2028
          • Exhibit 83: Chart on Middle East and Africa - Market size and forecast 2023-2028 ($ billion)
          • Exhibit 84: Data Table on Middle East and Africa - Market size and forecast 2023-2028 ($ billion)
          • Exhibit 85: Chart on Middle East and Africa - Year-over-year growth 2023-2028 (%)
          • Exhibit 86: Data Table on Middle East and Africa - Year-over-year growth 2023-2028 (%)
        • 9.8 China - Market size and forecast 2023-2028
          • Exhibit 87: Chart on China - Market size and forecast 2023-2028 ($ billion)
          • Exhibit 88: Data Table on China - Market size and forecast 2023-2028 ($ billion)
          • Exhibit 89: Chart on China - Year-over-year growth 2023-2028 (%)
          • Exhibit 90: Data Table on China - Year-over-year growth 2023-2028 (%)
        • 9.9 US - Market size and forecast 2023-2028
          • Exhibit 91: Chart on US - Market size and forecast 2023-2028 ($ billion)
          • Exhibit 92: Data Table on US - Market size and forecast 2023-2028 ($ billion)
          • Exhibit 93: Chart on US - Year-over-year growth 2023-2028 (%)
          • Exhibit 94: Data Table on US - Year-over-year growth 2023-2028 (%)
        • 9.10 Japan - Market size and forecast 2023-2028
          • Exhibit 95: Chart on Japan - Market size and forecast 2023-2028 ($ billion)
          • Exhibit 96: Data Table on Japan - Market size and forecast 2023-2028 ($ billion)
          • Exhibit 97: Chart on Japan - Year-over-year growth 2023-2028 (%)
          • Exhibit 98: Data Table on Japan - Year-over-year growth 2023-2028 (%)
        • 9.11 South Korea - Market size and forecast 2023-2028
          • Exhibit 99: Chart on South Korea - Market size and forecast 2023-2028 ($ billion)
          • Exhibit 100: Data Table on South Korea - Market size and forecast 2023-2028 ($ billion)
          • Exhibit 101: Chart on South Korea - Year-over-year growth 2023-2028 (%)
          • Exhibit 102: Data Table on South Korea - Year-over-year growth 2023-2028 (%)
        • 9.12 Germany - Market size and forecast 2023-2028
          • Exhibit 103: Chart on Germany - Market size and forecast 2023-2028 ($ billion)
          • Exhibit 104: Data Table on Germany - Market size and forecast 2023-2028 ($ billion)
          • Exhibit 105: Chart on Germany - Year-over-year growth 2023-2028 (%)
          • Exhibit 106: Data Table on Germany - Year-over-year growth 2023-2028 (%)
        • 9.13 Market opportunity by geography
          • Exhibit 107: Market opportunity by geography ($ billion)
          • Exhibit 108: Data Tables on Market opportunity by geography ($ billion)

        10 Drivers, Challenges, and Trends

        • 10.1 Market drivers
          • 10.2 Market challenges
            • 10.3 Impact of drivers and challenges
              • Exhibit 109: Impact of drivers and challenges in 2023 and 2028
            • 10.4 Market trends

              11 Vendor Landscape

              • 11.1 Overview
                • 11.2 Vendor landscape
                  • Exhibit 110: Overview on Criticality of inputs and Factors of differentiation
                • 11.3 Landscape disruption
                  • Exhibit 111: Overview on factors of disruption
                • 11.4 Industry risks
                  • Exhibit 112: Impact of key risks on business

                12 Vendor Analysis

                • 12.1 Vendors covered
                  • Exhibit 113: Vendors covered
                • 12.2 Market positioning of vendors
                  • Exhibit 114: Matrix on vendor position and classification
                • 12.3 Analog Devices Inc.
                  • Exhibit 115: Analog Devices Inc. - Overview
                  • Exhibit 116: Analog Devices Inc. - Business segments
                  • Exhibit 117: Analog Devices Inc. - Key news
                  • Exhibit 118: Analog Devices Inc. - Key offerings
                  • Exhibit 119: Analog Devices Inc. - Segment focus
                • 12.4 Anthem
                  • Exhibit 120: Anthem - Overview
                  • Exhibit 121: Anthem - Product / Service
                  • Exhibit 122: Anthem - Key offerings
                • 12.5 BONN Elektronik GmbH
                  • Exhibit 123: BONN Elektronik GmbH - Overview
                  • Exhibit 124: BONN Elektronik GmbH - Product / Service
                  • Exhibit 125: BONN Elektronik GmbH - Key offerings
                • 12.6 Broadcom Inc.
                  • Exhibit 126: Broadcom Inc. - Overview
                  • Exhibit 127: Broadcom Inc. - Business segments
                  • Exhibit 128: Broadcom Inc. - Key news
                  • Exhibit 129: Broadcom Inc. - Key offerings
                  • Exhibit 130: Broadcom Inc. - Segment focus
                • 12.7 Infineon Technologies AG
                  • Exhibit 131: Infineon Technologies AG - Overview
                  • Exhibit 132: Infineon Technologies AG - Business segments
                  • Exhibit 133: Infineon Technologies AG - Key news
                  • Exhibit 134: Infineon Technologies AG - Key offerings
                  • Exhibit 135: Infineon Technologies AG - Segment focus
                • 12.8 Murata Manufacturing Co. Ltd.
                  • Exhibit 136: Murata Manufacturing Co. Ltd. - Overview
                  • Exhibit 137: Murata Manufacturing Co. Ltd. - Business segments
                  • Exhibit 138: Murata Manufacturing Co. Ltd. - Key news
                  • Exhibit 139: Murata Manufacturing Co. Ltd. - Key offerings
                  • Exhibit 140: Murata Manufacturing Co. Ltd. - Segment focus
                • 12.9 NXP Semiconductors NV
                  • Exhibit 141: NXP Semiconductors NV - Overview
                  • Exhibit 142: NXP Semiconductors NV - Product / Service
                  • Exhibit 143: NXP Semiconductors NV - Key news
                  • Exhibit 144: NXP Semiconductors NV - Key offerings
                • 12.10 Peavey Electronics Corp.
                  • Exhibit 145: Peavey Electronics Corp. - Overview
                  • Exhibit 146: Peavey Electronics Corp. - Product / Service
                  • Exhibit 147: Peavey Electronics Corp. - Key offerings
                • 12.11 Qorvo Inc.
                  • Exhibit 148: Qorvo Inc. - Overview
                  • Exhibit 149: Qorvo Inc. - Business segments
                  • Exhibit 150: Qorvo Inc. - Key news
                  • Exhibit 151: Qorvo Inc. - Key offerings
                  • Exhibit 152: Qorvo Inc. - Segment focus
                • 12.12 QSC LLC
                  • Exhibit 153: QSC LLC - Overview
                  • Exhibit 154: QSC LLC - Product / Service
                  • Exhibit 155: QSC LLC - Key offerings
                • 12.13 Skyworks Solutions Inc.
                  • Exhibit 156: Skyworks Solutions Inc. - Overview
                  • Exhibit 157: Skyworks Solutions Inc. - Product / Service
                  • Exhibit 158: Skyworks Solutions Inc. - Key offerings
                • 12.14 STMicroelectronics International N.V.
                  • Exhibit 159: STMicroelectronics International N.V. - Overview
                  • Exhibit 160: STMicroelectronics International N.V. - Business segments
                  • Exhibit 161: STMicroelectronics International N.V. - Key news
                  • Exhibit 162: STMicroelectronics International N.V. - Key offerings
                  • Exhibit 163: STMicroelectronics International N.V. - Segment focus
                • 12.15 Texas Instruments Inc.
                  • Exhibit 164: Texas Instruments Inc. - Overview
                  • Exhibit 165: Texas Instruments Inc. - Business segments
                  • Exhibit 166: Texas Instruments Inc. - Key news
                  • Exhibit 167: Texas Instruments Inc. - Key offerings
                  • Exhibit 168: Texas Instruments Inc. - Segment focus
                • 12.16 Toshiba Corp.
                  • Exhibit 169: Toshiba Corp. - Overview
                  • Exhibit 170: Toshiba Corp. - Business segments
                  • Exhibit 171: Toshiba Corp. - Key news
                  • Exhibit 172: Toshiba Corp. - Key offerings
                  • Exhibit 173: Toshiba Corp. - Segment focus
                • 12.17 Yamaha Corp.
                  • Exhibit 174: Yamaha Corp. - Overview
                  • Exhibit 175: Yamaha Corp. - Business segments
                  • Exhibit 176: Yamaha Corp. - Key news
                  • Exhibit 177: Yamaha Corp. - Key offerings
                  • Exhibit 178: Yamaha Corp. - Segment focus

                13 Appendix

                • 13.1 Scope of the report
                  • 13.2 Inclusions and exclusions checklist
                    • Exhibit 179: Inclusions checklist
                    • Exhibit 180: Exclusions checklist
                  • 13.3 Currency conversion rates for US$
                    • Exhibit 181: Currency conversion rates for US$
                  • 13.4 Research methodology
                    • Exhibit 182: Research methodology
                    • Exhibit 183: Validation techniques employed for market sizing
                    • Exhibit 184: Information sources
                  • 13.5 List of abbreviations
                    • Exhibit 185: List of abbreviations

                  Research Methodology

                  Technavio presents a detailed picture of the market by way of study, synthesis, and summation of data from multiple sources. The analysts have presented the various facets of the market with a particular focus on identifying the key industry influencers. The data thus presented is comprehensive, reliable, and the result of extensive research, both primary and secondary.

                  INFORMATION SOURCES

                  Primary sources

                  • Manufacturers and suppliers
                  • Channel partners
                  • Industry experts
                  • Strategic decision makers

                  Secondary sources

                  • Industry journals and periodicals
                  • Government data
                  • Financial reports of key industry players
                  • Historical data
                  • Press releases

                  DATA ANALYSIS

                  Data Synthesis

                  • Collation of data
                  • Estimation of key figures
                  • Analysis of derived insights

                  Data Validation

                  • Triangulation with data models
                  • Reference against proprietary databases
                  • Corroboration with industry experts

                  REPORT WRITING

                  Qualitative

                  • Market drivers
                  • Market challenges
                  • Market trends
                  • Five forces analysis

                  Quantitative

                  • Market size and forecast
                  • Market segmentation
                  • Geographical insights
                  • Competitive landscape

                  Interested in this report?

                  Get your sample now to see our research methodology and insights!

                  Download Now

                  Frequently Asked Questions

                  Power Amplifier market growth will increase by $ 15.60 bn during 2024-2028.

                  The Power Amplifier market is expected to grow at a CAGR of 8.45% during 2024-2028.

                  Power Amplifier market is segmented by Technology( CMOS, GaAs/GaN/SiGe, Industrial) Application( Consumer electronics, Wireless communication, Industrial)

                  Analog Devices Inc., Anthem, BONN Elektronik GmbH, Broadcom Inc., CML Microcircuits UK Ltd., Infineon Technologies AG, MACOM Technology Solutions Inc., Microchip Technology Inc., NXP Semiconductors NV, Peavey Electronics Corp., Qorvo Inc., QSC LLC, Qualcomm Inc., Skyworks Solutions Inc., Spectrum Control Microelectronics Ltd., STMicroelectronics International N.V., Texas Instruments Inc., Toshiba Corp., Yamaha Corp., Murata Manufacturing Co. Ltd. are a few of the key vendors in the Power Amplifier market.

                  APAC will register the highest growth rate of 66% among the other regions. Therefore, the Power Amplifier market in APAC is expected to garner significant business opportunities for the vendors during the forecast period.

                  US, China, Japan, South Korea, Germany

                  • Availability of alternative manufacturing techniques of power amplifiers instead of Gallium arsenide (GaAs)The manufacturing cost of RF devices such as power amplifiers is high because of the high cost of raw materials. As a result is the driving factor this market.
                  • market vendors are seeking new materials that can help them reduce the manufacturing costs of RF devices such as RF power amplifiers. Materials such as silicon and GaAs are expected to find increasing application in the production of power amplifiers. GaAs-based power amplifiers have high saturated electron velocity and mobility to function is the driving factor this market.
                  • especially at higher frequencies. Also is the driving factor this market.
                  • these materials are cost-effective and display superior levels of integration with other electronic components such as amplifier and power supply sections. Hence is the driving factor this market.
                  • companies such as Murata and TriQuint are trying to use these materials is the driving factor this market.
                  • which are not only cost-effective but also offer superior performance for manufacturing RF power amplifiers. Currently is the driving factor this market.
                  • the use of these materials in the market is low and it is expected to increase during the forecast period. In recent years is the driving factor this market.
                  • Gallium nitride (GaN) is the driving factor this market.
                  • silicon-germanium (SiGe) is the driving factor this market.
                  • laterally diffused metal-oxide-semiconductor (LDMOS) is the driving factor this market.
                  • and complementary metal-oxide semiconductor (CMOS) devices have emerged as alternatives to GaAs-based devices. Power amplifiers use GaN and LDMOS devices is the driving factor this market.
                  • while SiGe devices are increasingly used in low-noise amplifier (LNA) applications. CMOS power amplifiers are used in entry-level mobile phones and are expected to be used in smartphones as well. Therefore is the driving factor this market.
                  • end-user segments in the market that are currently served by GaAs devices are now being targeted for the use of these alternative technologies. This can significantly lower the demand for GaAs devices is the driving factor this market.
                  • thus increasing the growth of the global power amplifier market during the forecast period. is the driving factor this market.

                  The Power Amplifier market vendors should focus on grabbing business opportunities from the CMOS segment as it accounted for the largest market share in the base year.