India Power EPC Market Size 2024-2028
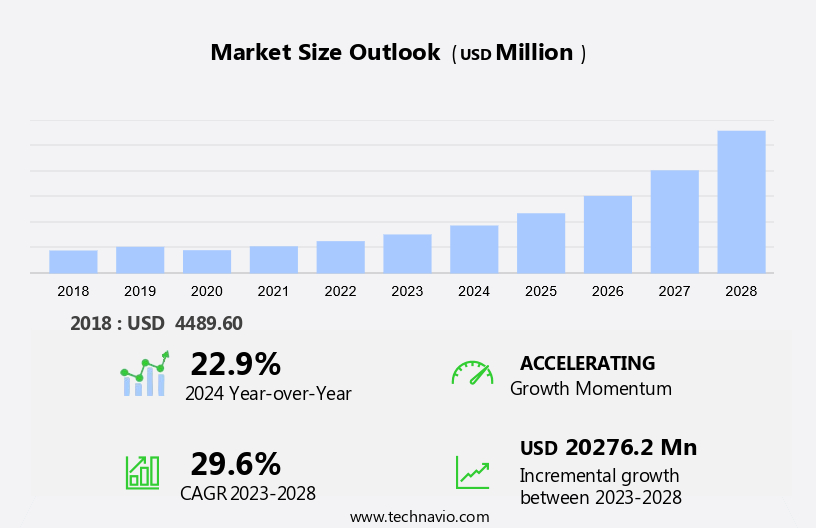
The India power EPC market size is forecast to increase by USD 20.28 billion at a CAGR of 29.6% between 2023 and 2028.
- The Power Engineering, Procurement, and Construction (EPC) market is experiencing significant growth due to various drivers and trends. One key factor is the increasing focus on carbon emissions reduction, leading to increased investment in renewable energy sources such as solar and wind. Additionally, the development of smart cities is creating demand for advanced power infrastructure. Another trend is the decline in crude oil prices, making alternative energy sources more economically viable. Energy security is also a major concern for many countries, driving the need for reliable electricity generation and efficient energy consumption.
What will be the size of the India Power EPC Market during the forecast period?
- The power engineering, procurement, and construction (EPC) market plays a pivotal role in the power generation sector, encompassing project planning, design, construction, and commissioning of power plants. This market caters to the ever-increasing electricity demand, driven by the expansion of industries and urbanization. Power generation continues to evolve, with a growing emphasis on renewable energy sources such as wind, solar, and hydroelectric power. Technology advancements, including artificial intelligence (AI), are revolutionizing the power sector, enhancing efficiency, and reducing carbon emissions. Project planning and design stages are crucial in the power EPC market.
- Engineers and architects utilize advanced software and AI algorithms to optimize power plant designs, ensuring efficient energy consumption and minimal environmental impact. Construction in the power EPC market is a complex process, involving the coordination of various stakeholders and the procurement of specialized equipment. Coal-based power plants and crude oil prices significantly influence the construction process, as these energy sources dominate the global power generation landscape. Commissioning is a critical phase in the power EPC market, ensuring that power plants meet client requests and regulatory requirements. AI is increasingly being employed in this stage to monitor and optimize plant performance, enhancing overall efficiency and reducing downtime.
How is this market segmented and which is the largest segment?
The market research report provides comprehensive data (region-wise segment analysis), with forecasts and estimates in "USD billion" for the period 2024-2028, as well as historical data from 2018-2022 for the following segments.
- Application
- Non-renewable
- Renewable
- End-user
- Private
- Government
- Geography
- India
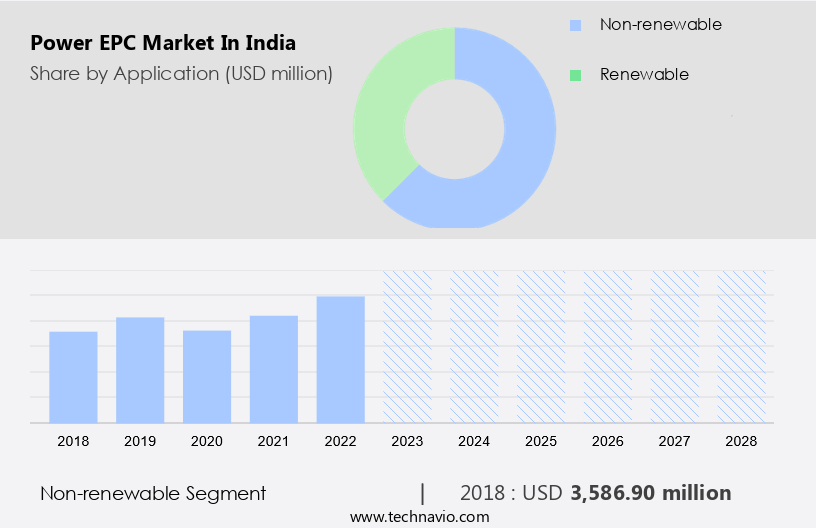
By Application Insights
- The non-renewable segment is estimated to witness significant growth during the forecast period.
The market is primarily driven by the non-renewable segment, which accounted for over 78% of the total electricity production in the country in 2023. This segment mainly comprises conventional thermal power plants that generate energy from the combustion of fossil fuels such as coal, oil, and natural gas. With the rapid expansion of industrialization and urbanization, the demand for non-renewable power is expected to increase further during the forecast period. Additionally, various government initiatives, including Power For All, aim to increase power consumption in the country, thereby fueling the growth of the power EPC market. In the context of the global shift towards electrification and reducing carbon emissions, digital electricity services are gaining significant traction.
Furthermore, the Indian government's emphasis on renewable energy sources is expected to create opportunities for EPC service providers in the renewable energy sector. However, the non-renewable segment's dominance in the power EPC market can be attributed to the country's current energy requirements, which are mainly fulfilled by coal-fired power plants. Feed-in tariffs and client requests for specialized knowledge and expertise are key factors driving the demand for EPC services in the power sector. As the industry continues to evolve, the focus on improving efficiency, reducing costs, and integrating digital technologies is expected to create new opportunities for market participants.
Get a glance at the market share of various segments Request Free Sample
The non-renewable segment was valued at USD 3.59 billion in 2018 and showed a gradual increase during the forecast period.
Market Dynamics
Our researchers analyzed the data with 2023 as the base year, along with the key drivers, trends, and challenges. A holistic analysis of drivers will help companies refine their marketing strategies to gain a competitive advantage.
What are the key market drivers leading to the rise in adoption of the India Power EPC Market?
Increasing investments in renewable energy is the key driver of the market.
- The energy landscape has undergone substantial transformation over the past two decades, with energy efficiency playing a pivotal role in maintaining equilibrium between energy supply and demand. As per the International Energy Agency (IEA), renewable power capacity for hydrogen fuel production is projected to expand by approximately 45 GW throughout the forecast period, accounting for merely 7% of the total announced project capacity for the same duration.
- Despite the higher cost of generating power through renewables compared to conventional methods, the sector's evolution and competition with fossil fuel-based power plants have made it an appealing investment opportunity. With growing government support and improved economics, the power EPC (Engineering, Procurement, and Construction) market for renewable energy is gaining traction. Key technologies, including AI and advanced turbines, are being integrated into project planning, design, and construction processes to enhance efficiency and productivity.
What are the market trends shaping the India Power EPC Market?
The development of smart cities is the upcoming trend in the market.
- The implementation of Information and Communication Technologies (ICT) in municipalities and cities is a key aspect of modern urban development, aiming to boost operational efficiency, performance, and the quality of essential services such as energy, transportation, and utilities. The ultimate objective is to lower costs, reduce wastage, and conserve resources, ultimately enhancing citizens' quality of living. Several governments worldwide are spearheading initiatives for sustainable smart city projects.
- One notable example is India, which launched the Smart City Mission in 2015 under the Ministry of Housing and Urban Affairs. This initiative, led by Prime Minister Narendra Modi, focuses on developing smart cities that prioritize energy security, carbon emissions reduction, and renewable energy investment. By leveraging technology, these cities aim to optimize electricity generation, consumption, and procurement, ensuring a more sustainable and secure energy future.
What challenges does the India Power EPC Market face during the growth?
The decline in crude oil prices is a key challenge affecting the market growth.
- The market encompasses the commissioning of renewable energy projects, including equipment procurement, construction supervision, land acquisition, and substation connectivity. Biomass, as a sustainable alternative to fossil fuels, has gained popularity due to its abundance of feedstocks. However, the escalating prices of biomass feedstocks may impede market growth.
- Moreover, the decline in crude oil prices since 2015, which constitutes a significant portion of power generation, may influence the adoption of biomass power EPC. These factors may hinder the market expansion during the forecast period.
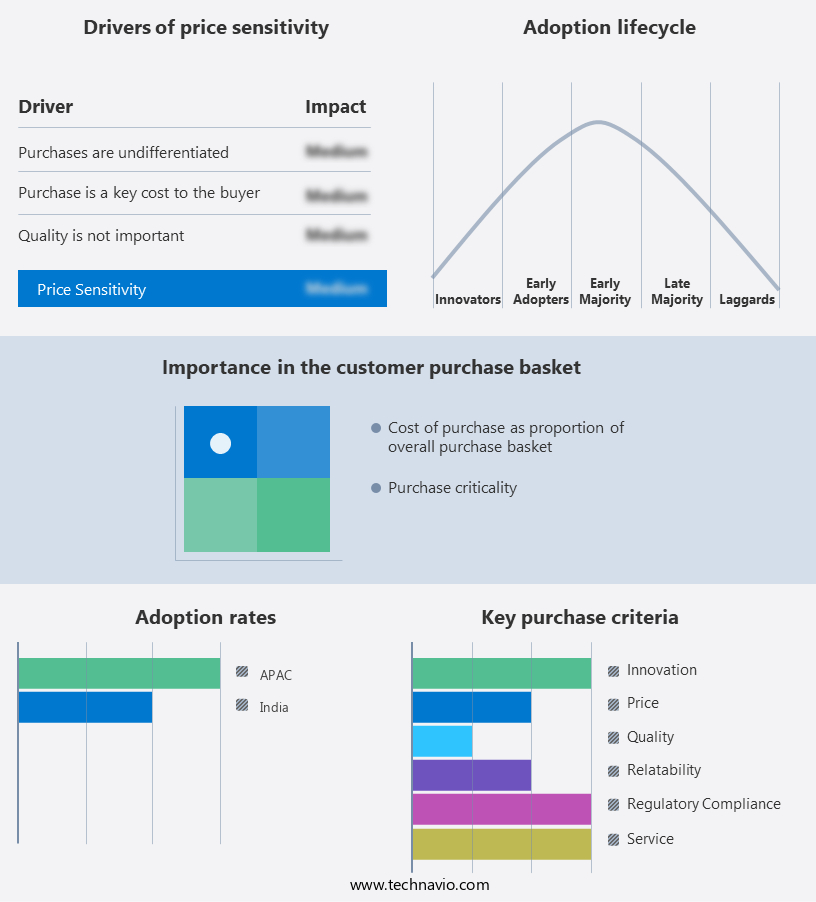
Exclusive India Power EPC Market Customer Landscape
The market forecasting report includes the adoption lifecycle of the market, covering from the innovator's stage to the laggard's stage. It focuses on adoption rates in different regions based on penetration. Furthermore, the report also includes key purchase criteria and drivers of price sensitivity to help companies evaluate and develop their market growth analysis strategies.
Customer Landscape
Key Companies & Market Insights
Companies are implementing various strategies, such as strategic alliances, market forecast partnerships, mergers and acquisitions, geographical expansion, and product/service launches, to enhance their presence in the market. The market research and growth report includes detailed analyses of the competitive landscape of the market and information about key companies, including:
- Bajaj Electricals Ltd.
- Bharat Heavy Electricals Ltd.
- Doosan Corp.
- Era Buildsys Ltd.
- Green Power International Pvt. Ltd.
- Hartek Power Pvt. Ltd.
- Hindustan Construction Co. Ltd
- IJM(India) Infrastructure Ltd.
- Intec Energy Solutions
- IVRCL Ltd.
- Larsen and Toubro Ltd.
- NS Thermal Energy Pvt. Ltd.
- Shapoorji Pallonji And Co. Pvt. Ltd.
- Skipper Ltd.
- Sterling and Wilson Renewable Energy Ltd
- Sterlite Power Transmission Ltd.
- Tata Sons Pvt. Ltd.
- UPCEM Engineering and Consultancy Pvt Ltd
Qualitative and quantitative analysis of companies has been conducted to help clients understand the wider business environment as well as the strengths and weaknesses of key market players. Data is qualitatively analyzed to categorize companies as pure play, category-focused, industry-focused, and diversified; it is quantitatively analyzed to categorize companies as dominant, leading, strong, tentative, and weak.
Research Analyst Overview
The power Engineering, Procurement, and Construction (EPC) market plays a significant role in the global power generation industry. With the increasing energy demand and the shift towards renewable energy sources, the Power EPC market is witnessing significant growth. Power EPC companies provide specialized knowledge and services for project planning, design, construction, commissioning, and equipment procurement for power generation projects. The market is driven by the need for carbon emission reduction and energy security. Renewable energy technologies, such as solar, wind, hydroelectric, biomass, and tidal energy, are gaining popularity due to their lower carbon emissions and sustainable nature.
Furthermore, the Power EPC market also caters to the construction of coal-based power plants and other non-renewable energy sources. The market is influenced by various factors, including crude oil prices, electricity consumption, and feed-in tariffs. Power EPC companies are responsible for land acquisition, substation connectivity, and ensuring worker safety regulations and social distance during construction. The market is expected to witness an increase in renewable energy investment and the addition of new renewable generation capacity in gigawatts (GW) in the coming years. Digital electricity services and electrification are also emerging trends in the Power EPC market.
|
Market Scope |
|
|
Report Coverage |
Details |
|
Page number |
129 |
|
Base year |
2023 |
|
Historic period |
2018-2022 |
|
Forecast period |
2024-2028 |
|
Growth momentum & CAGR |
Accelerate at a CAGR of 29.6% |
|
Market Growth 2024-2028 |
USD 20.28 billion |
|
Market structure |
Fragmented |
|
YoY growth 2023-2024(%) |
22.9 |
|
Competitive landscape |
Leading Companies, Market Positioning of Companies, Competitive Strategies, and Industry Risks |
What are the Key Data Covered in this Market Research Report?
- CAGR of the market during the forecast period
- Detailed information on factors that will drive the market growth and forecasting between 2024 and 2028
- Precise estimation of the size of the market and its contribution of the market in focus to the parent market
- Accurate predictions about upcoming market growth and trends and changes in consumer behaviour
- Growth of the market across India
- Thorough analysis of the market's competitive landscape and detailed information about companies
- Comprehensive analysis of factors that will challenge the growth of market companies
We can help! Our analysts can customize this market research report to meet your requirements Get in touch
 RIA -
RIA - 
