Pretzel Market Analysis, Size, and Forecast 2026-2030: Europe (Germany, UK, and France), North America (US, Canada, and Mexico), APAC (China, Japan, and India), South America (Brazil and Argentina), Middle East and Africa (UAE, Saudi Arabia, and South Africa), and Rest of World (ROW)

Pretzel Market Analysis, Size, and Forecast 2026-2030:
Europe (Germany, UK, and France), North America (US, Canada, and Mexico), APAC (China, Japan, and India), South America (Brazil and Argentina), Middle East and Africa (UAE, Saudi Arabia, and South Africa), and Rest of World (ROW)

Published: Mar 2026 286 Pages SKU: IRTNTR46424

Market Overview at a Glance

$1.46 B
Market Opportunity
3.3%
CAGR 2025 - 2030
33.1%
North America Growth
$4.87 B
Salted segment 2024

Pretzel Market Size 2026-2030

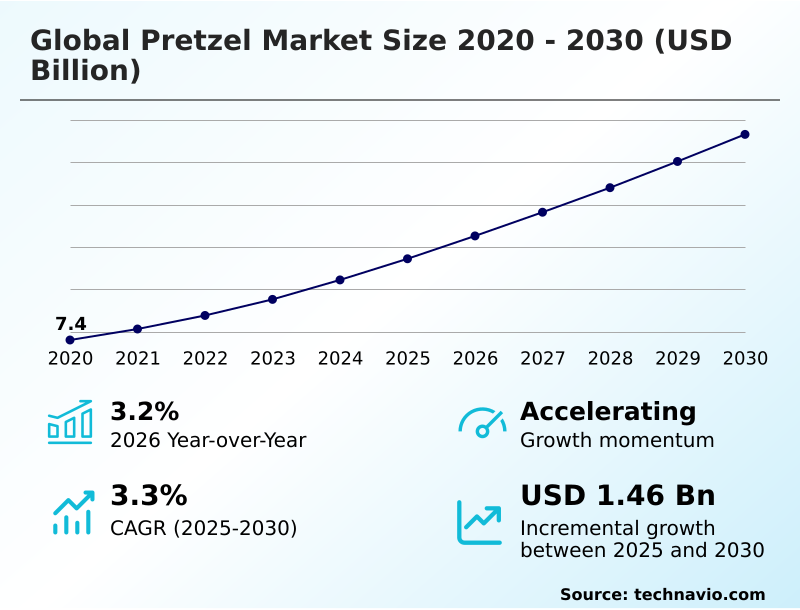
The pretzel market size is valued to increase by USD 1.46 billion, at a CAGR of 3.3% from 2025 to 2030. Acceleration of flavor innovation and culinary experimentation will drive the pretzel market.

Major Market Trends & Insights

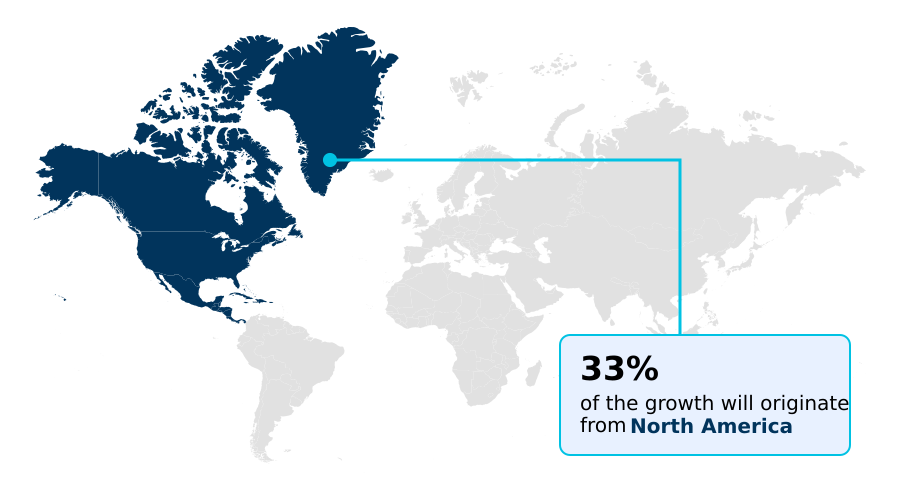
  • North America dominated the market and accounted for a 33.1% growth during the forecast period.
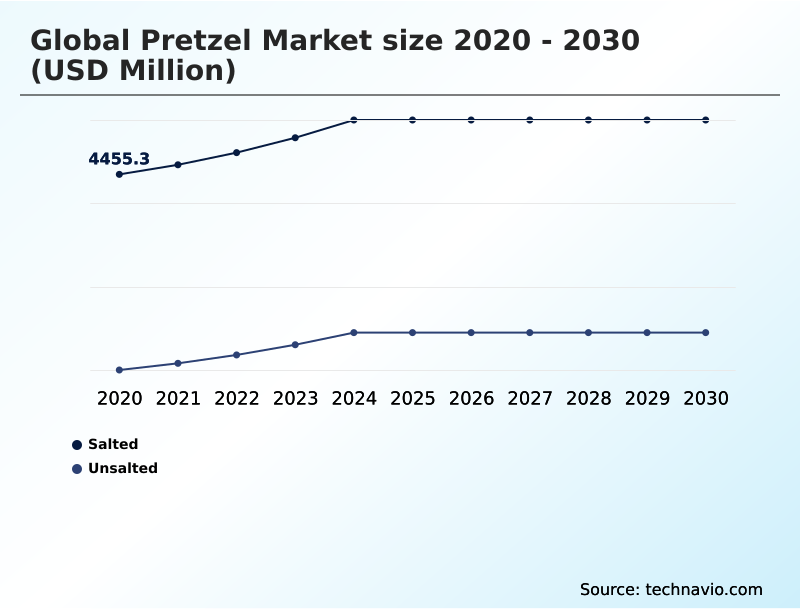
  • By Product Type - Salted segment was valued at USD 4.87 billion in 2024
  • By Distribution Channel - Offline segment accounted for the largest market revenue share in 2024

Market Size & Forecast

  • Market Opportunities: USD 2.42 billion
  • Market Future Opportunities: USD 1.46 billion
  • CAGR from 2025 to 2030 : 3.3%

Market Summary

  • The pretzel market is undergoing a significant transformation, evolving from a traditional commodity to a dynamic category defined by innovation and strategic adaptation. Growth is driven by an aggressive diversification of flavor profiles, with manufacturers moving beyond standard salted varieties to complex sweet, spicy, and savory notes to attract new demographics.
  • Concurrently, a strong pivot toward better-for-you (BFY) formulations using gluten-free options and non-gmo ingredients addresses rising health consciousness. This premiumization strategy allows brands to command higher price points. However, the industry grapples with raw material cost volatility, particularly with soft red winter wheat, and intensifying regulatory pressure for sodium reduction.
  • A key business scenario involves supply chain optimization, where a company implements regenerative agriculture practices for its wheat sourcing.
  • This not only builds supply chain transparency but also creates a compelling marketing narrative around sustainability, allowing the firm to secure premium shelf space and build loyalty with eco-conscious consumers, thereby mitigating some margin pressure from fluctuating input costs and addressing the skilled labor deficit through more stable supplier relationships.
  • This requires sophisticated flavor adhesion technology in the final baking process.

What will be the Size of the Pretzel Market during the forecast period?

Get Key Insights on Market Forecast (PDF) Request Free Sample

How is the Pretzel Market Segmented?

The pretzel industry research report provides comprehensive data (region-wise segment analysis), with forecasts and estimates in "USD million" for the period 2026-2030, as well as historical data from 2020-2024 for the following segments.

  • Product type
    • Salted
    • Unsalted
  • Distribution channel
    • Offline
    • Online
  • Type
    • Hard pretzels
    • Soft pretzels
    • Pretzel sticks
  • Geography
    • Europe
      • Germany
      • UK
      • France
    • North America
      • US
      • Canada
      • Mexico
    • APAC
      • China
      • Japan
      • India
    • South America
      • Brazil
      • Argentina
    • Middle East and Africa
      • UAE
      • Saudi Arabia
      • South Africa
    • Rest of World (ROW)

By Product Type Insights

The salted segment is estimated to witness significant growth during the forecast period.

The salted segment remains the cornerstone of the pretzel market, driven by consumer expectations for the classic interplay of alkaline-flavored, lye-dipped dough and a sharp, crystalline salt texture.

This category has evolved beyond commodity status, now encompassing premium salts and acting as the foundational carrier for complex savory seasoning profiles.

The inherent shelf stability and low moisture content of these baked snacks make them a staple in retail, where their high turnover rates are critical.

Targeted marketing efforts focusing on the product as an ideal snack board pairing have led to a more than 15% increase in shelf space allocation in major grocery chains, reinforcing the segment's commercial significance within the broader snack food industry and for foodservice pretzel products.

This involves using advanced dough formulation and flavor adhesion technology for both retail pretzel products and this quintessential salty snack.

Request Free Sample

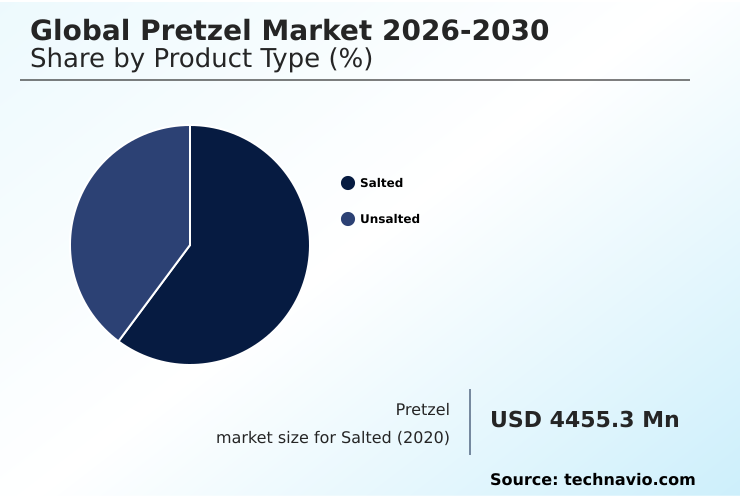
The Salted segment was valued at USD 4.87 billion in 2024 and showed a gradual increase during the forecast period.

Request Free Sample

Regional Analysis

North America is estimated to contribute 33.1% to the growth of the global market during the forecast period.Technavio’s analysts have elaborately explained the regional trends and drivers that shape the market during the forecast period.

See How Pretzel Market Demand is Rising in North America Request Free Sample

The geographic landscape of the pretzel market is diverse, with North America representing the largest market, contributing over 33% of the projected incremental growth. In this mature region, growth is fueled by a premiumization strategy and innovations in better-for-you formulations.

In contrast, the APAC region is the fastest-growing at 4.1%, driven by the adoption of pretzels as a novelty savory snack with localized flavors.

European markets exhibit a dichotomy between traditional artisanal pretzels in Germany and the rising popularity of hard, seasoned baked snack varieties in the UK.

Across these regions, manufacturers are implementing supply chain transparency measures; for example, optimizing distribution networks has led to a 15% reduction in out-of-stock instances in key retail channels.

This focus on operational efficiency is critical for managing raw material cost volatility while catering to divergent regional tastes with different savory seasoning profiles.

Market Dynamics

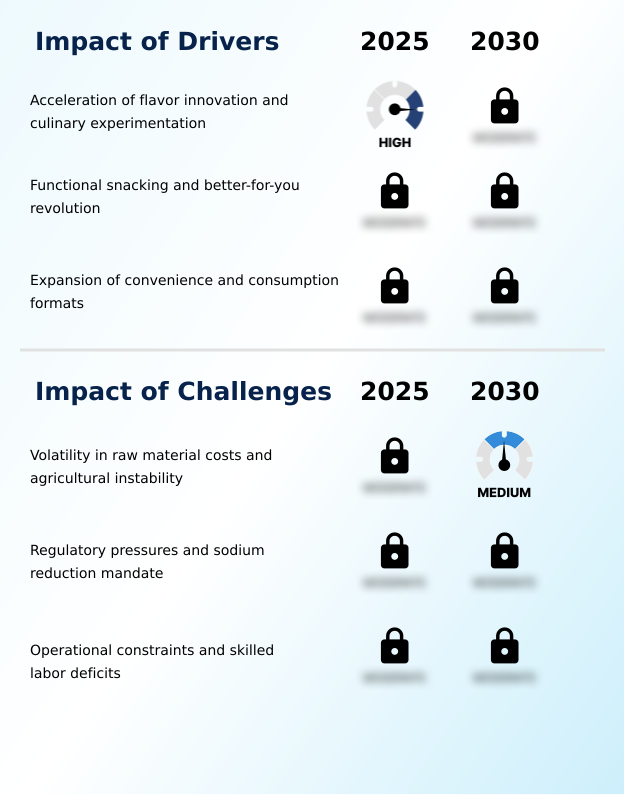
Our researchers analyzed the data with 2025 as the base year, along with the key drivers, trends, and challenges. A holistic analysis of drivers will help companies refine their marketing strategies to gain a competitive advantage.

  • The global pretzel market is navigating complex strategic imperatives, balancing consumer-facing innovation with backend operational resilience. Key pretzel flavor innovation trends are pushing manufacturers to explore sophisticated sweet and spicy pretzel seasoning combinations, moving beyond traditional salted offerings. Simultaneously, the demand for healthier options is driving gluten-free pretzel formulation innovations and the incorporation of ancient grains in pretzel products.
  • This requires significant pretzel baking extrusion advancements to maintain texture. A major industry-wide challenge is sodium reduction in savory snacks, compelling R&D investment. On the supply side, ensuring a stable soft red winter wheat supply is paramount, especially given persistent raw material cost for pretzels. Many brands are exploring regenerative agriculture for pretzel wheat as a long-term solution.
  • The role of private label in pretzel market premiumization is also intensifying competition, forcing national brands to refine their clean-label pretzel marketing strategies. For foodservice channels, developing better foodservice soft pretzel solutions, particularly for frozen soft pretzel texture improvement, is critical.
  • In retail, the demand for single-serve pretzel packaging demand reflects on-the-go consumption habits and the pretzel dipping culture snack pairing. Operationally, pretzel manufacturing automation challenges and the need for a skilled labor for pretzel production are significant hurdles.
  • For instance, firms that have automated their packaging lines report up to a 20% higher throughput compared to those relying on manual processes, a crucial advantage in a competitive market where visual appeal in pretzel marketing and the supply chain for artisanal pretzels are also key differentiators. The overall energy efficiency in pretzel baking remains a focus for cost control.

What are the key market drivers leading to the rise in the adoption of Pretzel Industry?

  • The acceleration of flavor innovation and culinary experimentation is a key driver propelling market growth.

  • Market growth is primarily propelled by aggressive flavor innovation and culinary experimentation, which have elevated the pretzel from a simple salty snack to a premium experience.
  • Brands introducing complex sweet and salty hybrid flavors are capturing new consumer segments, with limited-time offers driving impulse purchases up by over 20% during promotional periods. A second major driver is the pivot to functional snacking and better-for-you formulations.
  • The use of alternative flours has expanded the consumer base, with gluten-free formulations retaining customers who might otherwise exit the category. Finally, the evolution of convenience formats and portion control packaging caters to mobile lifestyles.
  • The adoption of single-serve formats for on-the-go consumption has proven highly effective, with sales in travel retail channels showing a significant uptick.

What are the market trends shaping the Pretzel Industry?

  • A key trend shaping the market is the integration of regenerative agriculture practices. This is coupled with enhanced supply chain transparency to meet consumer demand for sustainability.

  • Key trends are fundamentally reshaping the pretzel market’s value chain and consumer engagement models. The integration of regenerative agriculture practices is moving beyond a niche concept, with brands that provide supply chain transparency via digital traceability tools seeing a 15% uplift in consumer trust metrics.
  • Another dominant trend is the premiumization strategy of private label offerings, which are now competing directly with national brands on innovation. Retailers leveraging point-of-sale data can launch new savory seasoning profiles 30% faster than some legacy competitors. Furthermore, the rise of social commerce and visual snacking culture has collapsed the sales funnel.
  • Brands designing products with high visual appeal for digital platforms report double-digit increases in direct-to-consumer sales, leveraging the power of viral snack board pairings and creative dipping culture trends.

What challenges does the Pretzel Industry face during its growth?

  • Volatility in raw material costs and agricultural instability present a key challenge affecting the industry's growth trajectory.

  • The pretzel market faces significant headwinds that challenge margin stability and operational efficiency. The most persistent issue is raw material cost volatility, particularly for specialized wheat, which can impact production costs by as much as 15-20% during periods of agricultural instability. Compounding this are intensifying sodium reduction mandates from global health organizations.
  • Reformulating products to meet these new standards without compromising taste is a primary R&D focus, as non-compliance could restrict market access. Furthermore, a structural skilled labor deficit for maintaining automated extrusion lines and other complex machinery is constraining production capacity.
  • These operational constraints can lead to production bottlenecks, reducing potential output by up to 10% during peak demand seasons and delaying expansion plans.

Exclusive Technavio Analysis on Customer Landscape

The pretzel market forecasting report includes the adoption lifecycle of the market, covering from the innovator’s stage to the laggard’s stage. It focuses on adoption rates in different regions based on penetration. Furthermore, the pretzel market report also includes key purchase criteria and drivers of price sensitivity to help companies evaluate and develop their market growth analysis strategies.

Customer Landscape of Pretzel Industry

Competitive Landscape

Companies are implementing various strategies, such as strategic alliances, pretzel market forecast, partnerships, mergers and acquisitions, geographical expansion, and product/service launches, to enhance their presence in the industry.

Bikaji foods Ltd. - Specializing in packaged savory snacks, the vendor offers a range of pretzel products tailored for consumers seeking Western-style snack varieties.

The industry research and growth report includes detailed analyses of the competitive landscape of the market and information about key companies, including:

  • Bikaji foods Ltd.
  • Brezelbackerei Ditsch GmbH
  • Campbell Soup Co.
  • Eastern Standard Provisions
  • Hearthside Food Solutions LLC
  • Herr Foods Inc.
  • Highland Baking Co.
  • Intersnack Group GmbH and Co.
  • J and J Snack Foods Corp.
  • PepsiCo Inc.
  • Pretzel Pete Inc.
  • Pretzels Inc.
  • Pretzilla LLC
  • Rich Products Corp.
  • Stellar Snacks
  • Unique Pretzel Bakery
  • Utz Brands Inc.
  • Wetzels Pretzels LLC

Qualitative and quantitative analysis of companies has been conducted to help clients understand the wider business environment as well as the strengths and weaknesses of key industry players. Data is qualitatively analyzed to categorize companies as pure play, category-focused, industry-focused, and diversified; it is quantitatively analyzed to categorize companies as dominant, leading, strong, tentative, and weak.

Recent Development and News in Pretzel market

  • In May 2025, The World Health Organization (WHO) published its updated Global Sodium Benchmarks for Different Food Categories, introducing tighter recommended limits for savory snacks and urging member states to adopt them as mandatory standards.
  • In October 2024, Hershey Co.'s Dot's Homestyle Pretzels brand launched Buffalo Flavored Seasoned Twists, expanding its permanent lineup to capitalize on the 'swicy' flavor trend.
  • In January 2025, J and J Snack Foods refreshed its SUPERPRETZEL brand with a reformulated recipe designed to deliver a softer, Bavarian-style flavor profile, targeting at-home consumption.
  • In April 2025, Target Corp. expanded its Good and Gather brand with an Artisan Snack Series featuring stone-ground mustard pretzel knots, challenging established premium brands with its private label offerings.

Dive into Technavio’s robust research methodology, blending expert interviews, extensive data synthesis, and validated models for unparalleled Pretzel Market insights. See full methodology.

Market Scope
Page number 286
Base year 2025
Historic period 2020-2024
Forecast period 2026-2030
Growth momentum & CAGR Accelerate at a CAGR of 3.3%
Market growth 2026-2030 USD 1463.4 million
Market structure Fragmented
YoY growth 2025-2026(%) 3.2%
Key countries Germany, UK, France, Italy, Spain, The Netherlands, US, Canada, Mexico, China, Japan, India, South Korea, Australia, Indonesia, Brazil, Argentina, Chile, UAE, Saudi Arabia, South Africa, Egypt and Qatar
Competitive landscape Leading Companies, Market Positioning of Companies, Competitive Strategies, and Industry Risks

Request Free Sample

Research Analyst Overview

  • The pretzel market is defined by a strategic push toward value-added differentiation and operational resilience. The core product, a savory snack made from lye-dipped dough, is now a platform for intense innovation. Manufacturers are leveraging advanced dough formulation and baking process technologies in high-temperature tunnel ovens to create a diverse range of baked snack and salty snack options.
  • The growing demand for clean-label products and gluten-free formulations using alternative flours from an ancient grain extrusion blend is compelling a shift away from standard soft red winter wheat. For boardroom consideration, the trend of regenerative agriculture practices directly impacts procurement strategy.
  • Companies adopting these practices for wheat sourcing report a 20% more stable supply chain against climate-related disruptions compared to those on the open market. This shift necessitates investment in supply chain transparency and new flavor adhesion technology to ensure consistency in both foodservice pretzel products and retail pretzel products.
  • The use of automated extrusion lines and vertical form-fill-seal packaging is critical to manage costs for everything from frozen dough and par-baked solutions to finished goods with optimal shelf stability and low moisture content while accommodating non-gmo ingredients.

What are the Key Data Covered in this Pretzel Market Research and Growth Report?

  • What is the expected growth of the Pretzel Market between 2026 and 2030?

    • USD 1.46 billion, at a CAGR of 3.3%

  • What segmentation does the market report cover?

    • The report is segmented by Product Type (Salted, and Unsalted), Distribution Channel (Offline, and Online), Type (Hard pretzels, Soft pretzels, and Pretzel sticks) and Geography (Europe, North America, APAC, South America, Middle East and Africa)

  • Which regions are analyzed in the report?

    • Europe, North America, APAC, South America and Middle East and Africa

  • What are the key growth drivers and market challenges?

    • Acceleration of flavor innovation and culinary experimentation, Volatility in raw material costs and agricultural instability

  • Who are the major players in the Pretzel Market?

    • Bikaji foods Ltd., Brezelbackerei Ditsch GmbH, Campbell Soup Co., Eastern Standard Provisions, Hearthside Food Solutions LLC, Herr Foods Inc., Highland Baking Co., Intersnack Group GmbH and Co., J and J Snack Foods Corp., PepsiCo Inc., Pretzel Pete Inc., Pretzels Inc., Pretzilla LLC, Rich Products Corp., Stellar Snacks, Unique Pretzel Bakery, Utz Brands Inc. and Wetzels Pretzels LLC

Market Research Insights

  • The pretzel market's dynamics are shaped by a confluence of evolving consumer demands and operational pressures. The acceleration of flavor innovation and culinary experimentation is paramount, as brands leveraging novel savory seasoning profiles see up to a 25% higher rate of adoption among younger demographics compared to traditional offerings.
  • The push for better-for-you formulations has led to a rise in functional snacking, with products featuring clean labels achieving 10% greater consumer loyalty. To meet the need for on-the-go consumption, manufacturers are optimizing convenience formats and portion control packaging. This shift has improved supply chain efficiency, reducing spoilage by 5% for single-serve items.
  • These trends are occurring alongside the premiumization strategy of private label offerings and the growing influence of social commerce and visual snacking culture, which are reshaping marketing and product development.

We can help! Our analysts can customize this pretzel market research report to meet your requirements.

Get in touch

1. Executive Summary

1.1 Market overview

Executive Summary - Chart on Market Overview
Executive Summary - Data Table on Market Overview
Executive Summary - Chart on Global Market Characteristics
Executive Summary - Chart on Market by Geography
Executive Summary - Chart on Market Segmentation by Product Type
Executive Summary - Chart on Market Segmentation by Distribution Channel
Executive Summary - Chart on Market Segmentation by Type
Executive Summary - Chart on Incremental Growth
Executive Summary - Data Table on Incremental Growth
Executive Summary - Chart on Company Market Positioning

2. Technavio Analysis

2.1 Analysis of price sensitivity, lifecycle, customer purchase basket, adoption rates, and purchase criteria

2.2 Criticality of inputs and Factors of differentiation

Chart on Overview on criticality of inputs and factors of differentiation

2.3 Factors of disruption

Chart on Overview on factors of disruption

2.4 Impact of drivers and challenges

Chart on Impact of drivers and challenges in 2025 and 2030

3. Market Landscape

3.1 Market ecosystem

Chart on Parent Market
Data Table on - Parent Market

3.2 Market characteristics

Chart on Market characteristics analysis

3.3 Value chain analysis

Chart on Value chain analysis

4. Market Sizing

4.1 Market definition

Data Table on Offerings of companies included in the market definition

4.2 Market segment analysis

Market segments

4.3 Market size 2025

4.4 Market outlook: Forecast for 2025-2030

Chart on Global - Market size and forecast 2025-2030 ($ million)
Data Table on Global - Market size and forecast 2025-2030 ($ million)
Chart on Global Market: Year-over-year growth 2025-2030 (%)
Data Table on Global Market: Year-over-year growth 2025-2030 (%)

5. Historic Market Size

5.1 Global Pretzel Market 2020 - 2024

Historic Market Size - Data Table on Global Pretzel Market 2020 - 2024 ($ million)

5.2 Product Type segment analysis 2020 - 2024

Historic Market Size - Product Type Segment 2020 - 2024 ($ million)

5.3 Distribution Channel segment analysis 2020 - 2024

Historic Market Size - Distribution Channel Segment 2020 - 2024 ($ million)

5.4 Type segment analysis 2020 - 2024

Historic Market Size - Type Segment 2020 - 2024 ($ million)

5.5 Geography segment analysis 2020 - 2024

Historic Market Size - Geography Segment 2020 - 2024 ($ million)

5.6 Country segment analysis 2020 - 2024

Historic Market Size - Country Segment 2020 - 2024 ($ million)

6. Qualitative Analysis

6.1 Impact of AI on Global Pretzel Market

7. Five Forces Analysis

7.1 Five forces summary

Five forces analysis - Comparison between 2025 and 2030

7.2 Bargaining power of buyers

Bargaining power of buyers - Impact of key factors 2025 and 2030

7.3 Bargaining power of suppliers

Bargaining power of suppliers - Impact of key factors in 2025 and 2030

7.4 Threat of new entrants

Threat of new entrants - Impact of key factors in 2025 and 2030

7.5 Threat of substitutes

Threat of substitutes - Impact of key factors in 2025 and 2030

7.6 Threat of rivalry

Threat of rivalry - Impact of key factors in 2025 and 2030

7.7 Market condition

Chart on Market condition - Five forces 2025 and 2030

8. Market Segmentation by Product Type

8.1 Market segments

Chart on Product Type - Market share 2025-2030 (%)
Data Table on Product Type - Market share 2025-2030 (%)

8.2 Comparison by Product Type

Chart on Comparison by Product Type
Data Table on Comparison by Product Type

8.3 Salted - Market size and forecast 2025-2030

Chart on Salted - Market size and forecast 2025-2030 ($ million)
Data Table on Salted - Market size and forecast 2025-2030 ($ million)
Chart on Salted - Year-over-year growth 2025-2030 (%)
Data Table on Salted - Year-over-year growth 2025-2030 (%)

8.4 Unsalted - Market size and forecast 2025-2030

Chart on Unsalted - Market size and forecast 2025-2030 ($ million)
Data Table on Unsalted - Market size and forecast 2025-2030 ($ million)
Chart on Unsalted - Year-over-year growth 2025-2030 (%)
Data Table on Unsalted - Year-over-year growth 2025-2030 (%)

8.5 Market opportunity by Product Type

Market opportunity by Product Type ($ million)
Data Table on Market opportunity by Product Type ($ million)

9. Market Segmentation by Distribution Channel

9.1 Market segments

Chart on Distribution Channel - Market share 2025-2030 (%)
Data Table on Distribution Channel - Market share 2025-2030 (%)

9.2 Comparison by Distribution Channel

Chart on Comparison by Distribution Channel
Data Table on Comparison by Distribution Channel

9.3 Offline - Market size and forecast 2025-2030

Chart on Offline - Market size and forecast 2025-2030 ($ million)
Data Table on Offline - Market size and forecast 2025-2030 ($ million)
Chart on Offline - Year-over-year growth 2025-2030 (%)
Data Table on Offline - Year-over-year growth 2025-2030 (%)

9.4 Online - Market size and forecast 2025-2030

Chart on Online - Market size and forecast 2025-2030 ($ million)
Data Table on Online - Market size and forecast 2025-2030 ($ million)
Chart on Online - Year-over-year growth 2025-2030 (%)
Data Table on Online - Year-over-year growth 2025-2030 (%)

9.5 Market opportunity by Distribution Channel

Market opportunity by Distribution Channel ($ million)
Data Table on Market opportunity by Distribution Channel ($ million)

10. Market Segmentation by Type

10.1 Market segments

Chart on Type - Market share 2025-2030 (%)
Data Table on Type - Market share 2025-2030 (%)

10.2 Comparison by Type

Chart on Comparison by Type
Data Table on Comparison by Type

10.3 Hard pretzels - Market size and forecast 2025-2030

Chart on Hard pretzels - Market size and forecast 2025-2030 ($ million)
Data Table on Hard pretzels - Market size and forecast 2025-2030 ($ million)
Chart on Hard pretzels - Year-over-year growth 2025-2030 (%)
Data Table on Hard pretzels - Year-over-year growth 2025-2030 (%)

10.4 Soft pretzels - Market size and forecast 2025-2030

Chart on Soft pretzels - Market size and forecast 2025-2030 ($ million)
Data Table on Soft pretzels - Market size and forecast 2025-2030 ($ million)
Chart on Soft pretzels - Year-over-year growth 2025-2030 (%)
Data Table on Soft pretzels - Year-over-year growth 2025-2030 (%)

10.5 Pretzel sticks - Market size and forecast 2025-2030

Chart on Pretzel sticks - Market size and forecast 2025-2030 ($ million)
Data Table on Pretzel sticks - Market size and forecast 2025-2030 ($ million)
Chart on Pretzel sticks - Year-over-year growth 2025-2030 (%)
Data Table on Pretzel sticks - Year-over-year growth 2025-2030 (%)

10.6 Market opportunity by Type

Market opportunity by Type ($ million)
Data Table on Market opportunity by Type ($ million)

11. Customer Landscape

11.1 Customer landscape overview

Analysis of price sensitivity, lifecycle, customer purchase basket, adoption rates, and purchase criteria

12. Geographic Landscape

12.1 Geographic segmentation

Chart on Market share by geography 2025-2030 (%)
Data Table on Market share by geography 2025-2030 (%)

12.2 Geographic comparison

Chart on Geographic comparison
Data Table on Geographic comparison

12.3 Europe - Market size and forecast 2025-2030

Chart on Europe - Market size and forecast 2025-2030 ($ million)
Data Table on Europe - Market size and forecast 2025-2030 ($ million)
Chart on Europe - Year-over-year growth 2025-2030 (%)
Data Table on Europe - Year-over-year growth 2025-2030 (%)
Chart on Regional Comparison - Europe
Data Table on Regional Comparison - Europe

12.3.1 Germany - Market size and forecast 2025-2030

Chart on Germany - Market size and forecast 2025-2030 ($ million)
Data Table on Germany - Market size and forecast 2025-2030 ($ million)
Chart on Germany - Year-over-year growth 2025-2030 (%)
Data Table on Germany - Year-over-year growth 2025-2030 (%)

12.3.2 UK - Market size and forecast 2025-2030

Chart on UK - Market size and forecast 2025-2030 ($ million)
Data Table on UK - Market size and forecast 2025-2030 ($ million)
Chart on UK - Year-over-year growth 2025-2030 (%)
Data Table on UK - Year-over-year growth 2025-2030 (%)

12.3.3 France - Market size and forecast 2025-2030

Chart on France - Market size and forecast 2025-2030 ($ million)
Data Table on France - Market size and forecast 2025-2030 ($ million)
Chart on France - Year-over-year growth 2025-2030 (%)
Data Table on France - Year-over-year growth 2025-2030 (%)

12.3.4 Italy - Market size and forecast 2025-2030

Chart on Italy - Market size and forecast 2025-2030 ($ million)
Data Table on Italy - Market size and forecast 2025-2030 ($ million)
Chart on Italy - Year-over-year growth 2025-2030 (%)
Data Table on Italy - Year-over-year growth 2025-2030 (%)

12.3.5 Spain - Market size and forecast 2025-2030

Chart on Spain - Market size and forecast 2025-2030 ($ million)
Data Table on Spain - Market size and forecast 2025-2030 ($ million)
Chart on Spain - Year-over-year growth 2025-2030 (%)
Data Table on Spain - Year-over-year growth 2025-2030 (%)

12.3.6 The Netherlands - Market size and forecast 2025-2030

Chart on The Netherlands - Market size and forecast 2025-2030 ($ million)
Data Table on The Netherlands - Market size and forecast 2025-2030 ($ million)
Chart on The Netherlands - Year-over-year growth 2025-2030 (%)
Data Table on The Netherlands - Year-over-year growth 2025-2030 (%)

12.4 North America - Market size and forecast 2025-2030

Chart on North America - Market size and forecast 2025-2030 ($ million)
Data Table on North America - Market size and forecast 2025-2030 ($ million)
Chart on North America - Year-over-year growth 2025-2030 (%)
Data Table on North America - Year-over-year growth 2025-2030 (%)
Chart on Regional Comparison - North America
Data Table on Regional Comparison - North America

12.4.1 US - Market size and forecast 2025-2030

Chart on US - Market size and forecast 2025-2030 ($ million)
Data Table on US - Market size and forecast 2025-2030 ($ million)
Chart on US - Year-over-year growth 2025-2030 (%)
Data Table on US - Year-over-year growth 2025-2030 (%)

12.4.2 Canada - Market size and forecast 2025-2030

Chart on Canada - Market size and forecast 2025-2030 ($ million)
Data Table on Canada - Market size and forecast 2025-2030 ($ million)
Chart on Canada - Year-over-year growth 2025-2030 (%)
Data Table on Canada - Year-over-year growth 2025-2030 (%)

12.4.3 Mexico - Market size and forecast 2025-2030

Chart on Mexico - Market size and forecast 2025-2030 ($ million)
Data Table on Mexico - Market size and forecast 2025-2030 ($ million)
Chart on Mexico - Year-over-year growth 2025-2030 (%)
Data Table on Mexico - Year-over-year growth 2025-2030 (%)

12.5 APAC - Market size and forecast 2025-2030

Chart on APAC - Market size and forecast 2025-2030 ($ million)
Data Table on APAC - Market size and forecast 2025-2030 ($ million)
Chart on APAC - Year-over-year growth 2025-2030 (%)
Data Table on APAC - Year-over-year growth 2025-2030 (%)
Chart on Regional Comparison - APAC
Data Table on Regional Comparison - APAC

12.5.1 China - Market size and forecast 2025-2030

Chart on China - Market size and forecast 2025-2030 ($ million)
Data Table on China - Market size and forecast 2025-2030 ($ million)
Chart on China - Year-over-year growth 2025-2030 (%)
Data Table on China - Year-over-year growth 2025-2030 (%)

12.5.2 Japan - Market size and forecast 2025-2030

Chart on Japan - Market size and forecast 2025-2030 ($ million)
Data Table on Japan - Market size and forecast 2025-2030 ($ million)
Chart on Japan - Year-over-year growth 2025-2030 (%)
Data Table on Japan - Year-over-year growth 2025-2030 (%)

12.5.3 India - Market size and forecast 2025-2030

Chart on India - Market size and forecast 2025-2030 ($ million)
Data Table on India - Market size and forecast 2025-2030 ($ million)
Chart on India - Year-over-year growth 2025-2030 (%)
Data Table on India - Year-over-year growth 2025-2030 (%)

12.5.4 South Korea - Market size and forecast 2025-2030

Chart on South Korea - Market size and forecast 2025-2030 ($ million)
Data Table on South Korea - Market size and forecast 2025-2030 ($ million)
Chart on South Korea - Year-over-year growth 2025-2030 (%)
Data Table on South Korea - Year-over-year growth 2025-2030 (%)

12.5.5 Australia - Market size and forecast 2025-2030

Chart on Australia - Market size and forecast 2025-2030 ($ million)
Data Table on Australia - Market size and forecast 2025-2030 ($ million)
Chart on Australia - Year-over-year growth 2025-2030 (%)
Data Table on Australia - Year-over-year growth 2025-2030 (%)

12.5.6 Indonesia - Market size and forecast 2025-2030

Chart on Indonesia - Market size and forecast 2025-2030 ($ million)
Data Table on Indonesia - Market size and forecast 2025-2030 ($ million)
Chart on Indonesia - Year-over-year growth 2025-2030 (%)
Data Table on Indonesia - Year-over-year growth 2025-2030 (%)

12.6 South America - Market size and forecast 2025-2030

Chart on South America - Market size and forecast 2025-2030 ($ million)
Data Table on South America - Market size and forecast 2025-2030 ($ million)
Chart on South America - Year-over-year growth 2025-2030 (%)
Data Table on South America - Year-over-year growth 2025-2030 (%)
Chart on Regional Comparison - South America
Data Table on Regional Comparison - South America

12.6.1 Brazil - Market size and forecast 2025-2030

Chart on Brazil - Market size and forecast 2025-2030 ($ million)
Data Table on Brazil - Market size and forecast 2025-2030 ($ million)
Chart on Brazil - Year-over-year growth 2025-2030 (%)
Data Table on Brazil - Year-over-year growth 2025-2030 (%)

12.6.2 Argentina - Market size and forecast 2025-2030

Chart on Argentina - Market size and forecast 2025-2030 ($ million)
Data Table on Argentina - Market size and forecast 2025-2030 ($ million)
Chart on Argentina - Year-over-year growth 2025-2030 (%)
Data Table on Argentina - Year-over-year growth 2025-2030 (%)

12.6.3 Chile - Market size and forecast 2025-2030

Chart on Chile - Market size and forecast 2025-2030 ($ million)
Data Table on Chile - Market size and forecast 2025-2030 ($ million)
Chart on Chile - Year-over-year growth 2025-2030 (%)
Data Table on Chile - Year-over-year growth 2025-2030 (%)

12.7 Middle East and Africa - Market size and forecast 2025-2030

Chart on Middle East and Africa - Market size and forecast 2025-2030 ($ million)
Data Table on Middle East and Africa - Market size and forecast 2025-2030 ($ million)
Chart on Middle East and Africa - Year-over-year growth 2025-2030 (%)
Data Table on Middle East and Africa - Year-over-year growth 2025-2030 (%)
Chart on Regional Comparison - Middle East and Africa
Data Table on Regional Comparison - Middle East and Africa

12.7.1 UAE - Market size and forecast 2025-2030

Chart on UAE - Market size and forecast 2025-2030 ($ million)
Data Table on UAE - Market size and forecast 2025-2030 ($ million)
Chart on UAE - Year-over-year growth 2025-2030 (%)
Data Table on UAE - Year-over-year growth 2025-2030 (%)

12.7.2 Saudi Arabia - Market size and forecast 2025-2030

Chart on Saudi Arabia - Market size and forecast 2025-2030 ($ million)
Data Table on Saudi Arabia - Market size and forecast 2025-2030 ($ million)
Chart on Saudi Arabia - Year-over-year growth 2025-2030 (%)
Data Table on Saudi Arabia - Year-over-year growth 2025-2030 (%)

12.7.3 South Africa - Market size and forecast 2025-2030

Chart on South Africa - Market size and forecast 2025-2030 ($ million)
Data Table on South Africa - Market size and forecast 2025-2030 ($ million)
Chart on South Africa - Year-over-year growth 2025-2030 (%)
Data Table on South Africa - Year-over-year growth 2025-2030 (%)

12.7.4 Egypt - Market size and forecast 2025-2030

Chart on Egypt - Market size and forecast 2025-2030 ($ million)
Data Table on Egypt - Market size and forecast 2025-2030 ($ million)
Chart on Egypt - Year-over-year growth 2025-2030 (%)
Data Table on Egypt - Year-over-year growth 2025-2030 (%)

12.7.5 Qatar - Market size and forecast 2025-2030

Chart on Qatar - Market size and forecast 2025-2030 ($ million)
Data Table on Qatar - Market size and forecast 2025-2030 ($ million)
Chart on Qatar - Year-over-year growth 2025-2030 (%)
Data Table on Qatar - Year-over-year growth 2025-2030 (%)

12.8 Market opportunity by geography

Market opportunity by geography ($ million)
Data Tables on Market opportunity by geography ($ million)

13. Drivers, Challenges, and Opportunity

13.1 Market drivers

Acceleration of flavor innovation and culinary experimentation
Functional snacking and better-for-you revolution
Expansion of convenience and consumption formats

13.2 Market challenges

Volatility in raw material costs and agricultural instability
Regulatory pressures and sodium reduction mandate
Operational constraints and skilled labor deficits

13.3 Impact of drivers and challenges

Impact of drivers and challenges in 2025 and 2030

13.4 Market opportunities

Integration of regenerative agriculture and supply chain transparency
Premiumization of private label and retailer brands
Influence of social commerce and visual snacking culture

14. Competitive Landscape

14.1 Overview

14.2

Overview on criticality of inputs and factors of differentiation

14.3 Landscape disruption

Overview on factors of disruption

14.4 Industry risks

Impact of key risks on business

15. Competitive Analysis

15.1 Companies profiled

Companies covered

15.2 Company ranking index

15.3 Market positioning of companies

Matrix on companies position and classification

15.4 Bikaji foods Ltd.

Bikaji foods Ltd. - Overview
Bikaji foods Ltd. - Product / Service
Bikaji foods Ltd. - Key offerings
SWOT

15.5 Campbell Soup Co.

Campbell Soup Co. - Overview
Campbell Soup Co. - Business segments
Campbell Soup Co. - Key news
Campbell Soup Co. - Key offerings
Campbell Soup Co. - Segment focus
SWOT

15.6 Hearthside Food Solutions LLC

Hearthside Food Solutions LLC - Overview
Hearthside Food Solutions LLC - Product / Service
Hearthside Food Solutions LLC - Key offerings
SWOT

15.7 Herr Foods Inc.

Herr Foods Inc. - Overview
Herr Foods Inc. - Product / Service
Herr Foods Inc. - Key offerings
SWOT

15.8 Highland Baking Co.

Highland Baking Co. - Overview
Highland Baking Co. - Product / Service
Highland Baking Co. - Key offerings
SWOT

15.9 Intersnack Group GmbH and Co.

Intersnack Group GmbH and Co. - Overview
Intersnack Group GmbH and Co. - Product / Service
Intersnack Group GmbH and Co. - Key offerings
SWOT

15.10 J and J Snack Foods Corp.

J and J Snack Foods Corp. - Overview
J and J Snack Foods Corp. - Business segments
J and J Snack Foods Corp. - Key offerings
J and J Snack Foods Corp. - Segment focus
SWOT

15.11 PepsiCo Inc.

PepsiCo Inc. - Overview
PepsiCo Inc. - Business segments
PepsiCo Inc. - Key news
PepsiCo Inc. - Key offerings
PepsiCo Inc. - Segment focus
SWOT

15.12 Pretzels Inc.

Pretzels Inc. - Overview
Pretzels Inc. - Product / Service
Pretzels Inc. - Key offerings
SWOT

15.13 Pretzilla LLC

Pretzilla LLC - Overview
Pretzilla LLC - Product / Service
Pretzilla LLC - Key offerings
SWOT

15.14 Rich Products Corp.

Rich Products Corp. - Overview
Rich Products Corp. - Product / Service
Rich Products Corp. - Key offerings
SWOT

15.15 Stellar Snacks

Stellar Snacks - Overview
Stellar Snacks - Product / Service
Stellar Snacks - Key offerings
SWOT

15.16 Unique Pretzel Bakery

Unique Pretzel Bakery - Overview
Unique Pretzel Bakery - Product / Service
Unique Pretzel Bakery - Key offerings
SWOT

15.17 Utz Brands Inc.

Utz Brands Inc. - Overview
Utz Brands Inc. - Product / Service
Utz Brands Inc. - Key offerings
SWOT

15.18 Wetzels Pretzels LLC

Wetzels Pretzels LLC - Overview
Wetzels Pretzels LLC - Product / Service
Wetzels Pretzels LLC - Key offerings
SWOT

16. Appendix

16.1 Scope of the report

Market definition
Objectives
Notes and caveats

16.2 Inclusions and exclusions checklist

Inclusions checklist
Exclusions checklist

16.3 Currency conversion rates for US$

16.4 Research methodology

16.5 Data procurement

Information sources

16.6 Data validation

16.7 Validation techniques employed for market sizing

16.8 Data synthesis

16.9 360 degree market analysis

16.10 List of abbreviations

Research Methodology

Technavio presents a detailed picture of the market by way of study, synthesis, and summation of data from multiple sources. The analysts have presented the various facets of the market with a particular focus on identifying the key industry influencers. The data thus presented is comprehensive, reliable, and the result of extensive research, both primary and secondary.

INFORMATION SOURCES

Primary sources

  • Manufacturers and suppliers
  • Channel partners
  • Industry experts
  • Strategic decision makers

Secondary sources

  • Industry journals and periodicals
  • Government data
  • Financial reports of key industry players
  • Historical data
  • Press releases

DATA ANALYSIS

Data Synthesis

  • Collation of data
  • Estimation of key figures
  • Analysis of derived insights

Data Validation

  • Triangulation with data models
  • Reference against proprietary databases
  • Corroboration with industry experts

REPORT WRITING

Qualitative

  • Market drivers
  • Market challenges
  • Market trends
  • Five forces analysis

Quantitative

  • Market size and forecast
  • Market segmentation
  • Geographical insights
  • Competitive landscape

Interested in this report?

Get your sample now to see our research methodology and insights!

Download Now

Frequently Asked Questions

Pretzel market growth will increase by USD 1463.4 million during 2026-2030.

The Pretzel market is expected to grow at a CAGR of 3.3% during 2026-2030.

Pretzel market is segmented by Product type (Salted, Unsalted) Distribution channel (Offline, Online) Type (Hard pretzels, Soft pretzels, Pretzel sticks)

Bikaji foods Ltd., Brezelbackerei Ditsch GmbH, Campbell Soup Co., Eastern Standard Provisions, Hearthside Food Solutions LLC, Herr Foods Inc., Highland Baking Co., Intersnack Group GmbH and Co., J and J Snack Foods Corp., PepsiCo Inc., Pretzel Pete Inc., Pretzels Inc., Pretzilla LLC, Rich Products Corp., Stellar Snacks, Unique Pretzel Bakery, Utz Brands Inc., Wetzels Pretzels LLC are a few of the key vendors in the Pretzel market.

North America will register the highest growth rate of 33.1% among the other regions. Therefore, the Pretzel market in North America is expected to garner significant business opportunities for the vendors during the forecast period.

Germany, UK, France, Italy, Spain, The Netherlands, US, Canada, Mexico, China, Japan, India, South Korea, Australia, Indonesia, Brazil, Argentina, Chile, UAE, Saudi Arabia, South Africa, Egypt, Qatar

  • Acceleration of flavor innovation and culinary experimentation is the driving factor this market.

The Pretzel market vendors should focus on grabbing business opportunities from the Product type segment as it accounted for the largest market share in the base year.
RIA - Research AI Assistant
Ask RIA