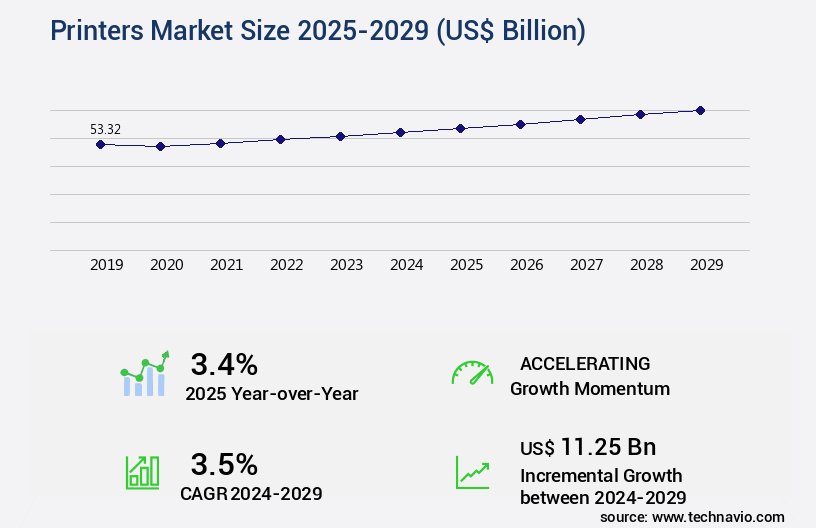
Printers Market Size 2025-2029
The printers market size is valued to increase USD 11.25 billion, at a CAGR of 3.5% from 2024 to 2029. Rising demand for printers from SMEs will drive the printers market.
Major Market Trends & Insights
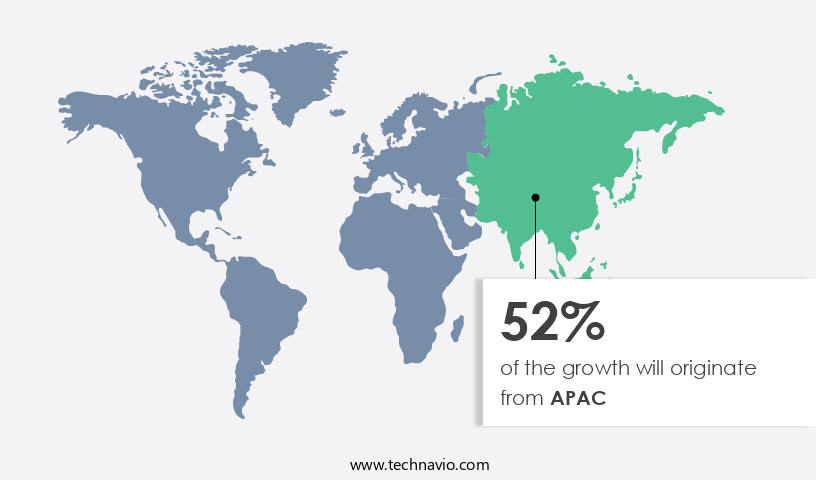
- APAC dominated the market and accounted for a 52% growth during the forecast period.
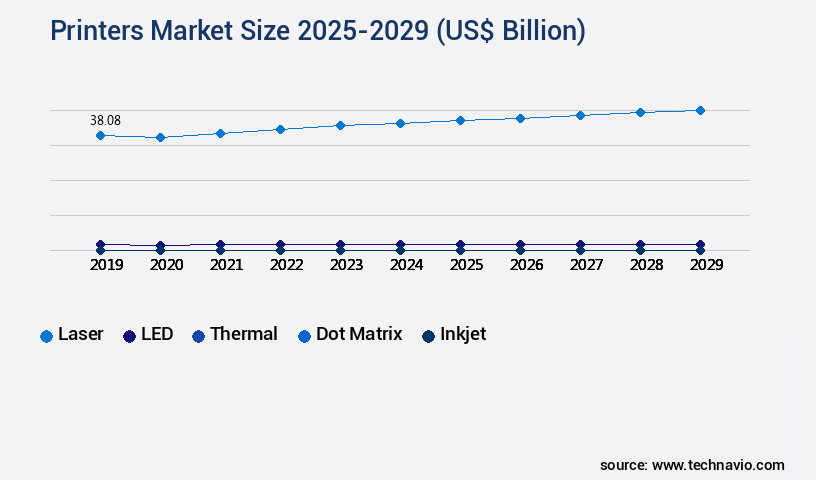
- By Technology - Laser segment was valued at USD 38.08 billion in 2023
- By Type - Inkjet-based segment accounted for the largest market revenue share in 2023
Market Size & Forecast
- Market Opportunities: USD 32.46 billion
- Market Future Opportunities: USD 11.25 billion
- CAGR : 3.5%
- APAC: Largest market in 2023
Market Summary
- The market encompasses a dynamic and continually evolving landscape shaped by advancements in core technologies and applications, service types, and regulatory frameworks. With the increasing adoption of 3D technology in printers, the market is witnessing significant growth, particularly in sectors such as healthcare and manufacturing. According to recent market research, the global 3D printing market in the manufacturing sector is projected to reach a value of 35.6 billion USD by 2026, growing at a steady rate. Additionally, the rising demand for printers from small and medium-sized enterprises (SMEs) and the increasing digitization in enterprises are fueling market growth.
- Despite these opportunities, challenges such as high upfront costs and the need for specialized skills persist. The market is also subject to regulatory changes, with governments worldwide implementing policies to ensure the safe and sustainable use of printers.
What will be the Size of the Printers Market during the forecast period?
Get Key Insights on Market Forecast (PDF) Request Free Sample
How is the Printers Market Segmented and what are the key trends of market segmentation?
The printers industry research report provides comprehensive data (region-wise segment analysis), with forecasts and estimates in "USD billion" for the period 2025-2029, as well as historical data from 2019-2023 for the following segments.
- Technology
- Laser
- LED
- Thermal
- Dot Matrix
- Inkjet
- Type
- Inkjet-based
- Toner-based
- Multi-functional
- Standalone
- Ink Type
- Aqueous
- Solvent
- UV-curable
- Dye Sublimation
- End-User
- Apparel and Textiles
- Signage
- Advertising
- Decor
- CAD and Technical Printing
- Residential
- Commercial
- Educational Institutions
- Enterprises
- Government
- Printer Interface
- Wired
- Wireless
- Distribution Channel
- Offline
- Online
- Geography
- North America
- US
- Europe
- France
- Germany
- Italy
- UK
- Middle East and Africa
- UAE
- APAC
- Australia
- China
- India
- Japan
- South Korea
- South America
- Brazil
- Rest of World (ROW)
- North America
By Technology Insights
The laser segment is estimated to witness significant growth during the forecast period.
The market encompasses various printing technologies, including laser printing, inkjet printing, and mobile printing. Among these, laser printing, which utilizes electrophotography or electrostatic charges, has gained significant traction due to its speed and precision. According to recent studies, laser printing accounts for approximately 30% of the overall print market share. Moreover, the market for laser printing is projected to expand further, with industry experts anticipating a growth of up to 15% in the next few years. This expansion can be attributed to the increasing demand for high-speed printing, particularly in industrial and commercial sectors. Inkjet printing, another prominent technology, relies on inkjet printheads and imaging units to create prints.
Inkjet technology has seen a surge in popularity due to its ability to produce high-quality color prints and its compatibility with cloud printing and print queue management systems. Approximately 45% of the overall print market share is attributed to inkjet printing. Furthermore, the market for print servers, printer maintenance, and print cartridge replacement services is expected to grow steadily, driven by the increasing demand for wireless printing and duplex printing capabilities. These advancements have led to improvements in printing efficiency and productivity. Additionally, the emergence of large format printing, 3D printer filaments, and thermal printing technologies has expanded the scope of the market.
The market for industrial printing, including toner cartridges and print resolution, is also experiencing significant growth. In terms of market trends, high-speed printing, driver installation, and print resolution continue to be key focus areas for both manufacturers and consumers. Paper handling, print queue management, and print spooler technologies have also gained prominence, ensuring a seamless printing experience. Despite these advancements, challenges such as print quality issues, paper jams, and cartridge replacement costs persist. Nevertheless, ongoing research and development efforts in print technology are expected to address these challenges and further enhance the overall value proposition of the market.
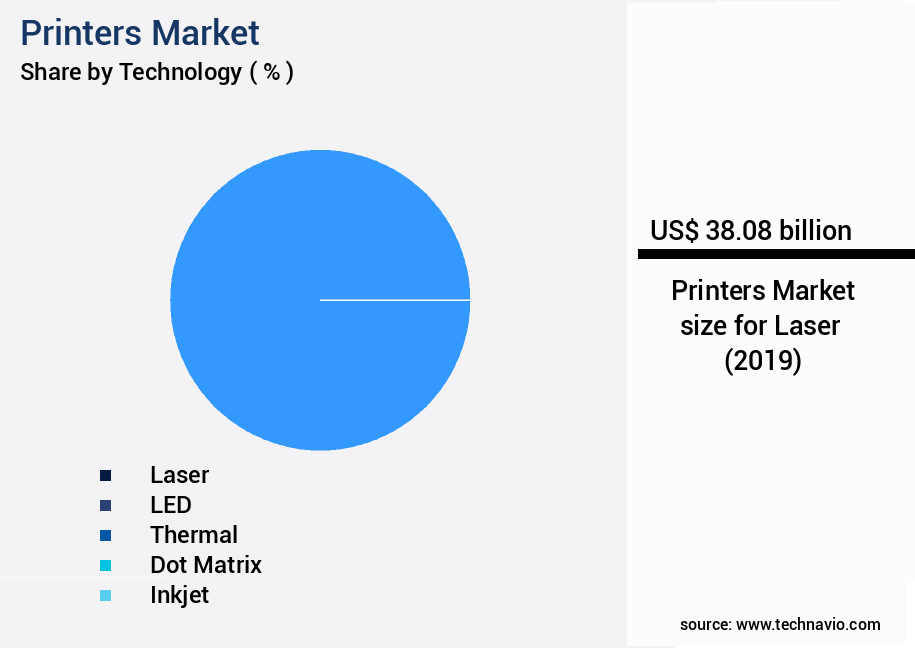
The Laser segment was valued at USD 38.08 billion in 2019 and showed a gradual increase during the forecast period.
Regional Analysis
APAC is estimated to contribute 52% to the growth of the global market during the forecast period.Technavio's analysts have elaborately explained the regional trends and drivers that shape the market during the forecast period.
See How Printers Market Demand is Rising in APAC Request Free Sample
The APAC region represents a significant growth opportunity for printer manufacturers, underpinned by the widespread adoption of automation and the emphasis on operational efficiency. Key industries and verticals in the region are embracing advanced technologies to optimize business processes and enhance productivity. Comprising developed economies like South Korea, Japan, and Singapore, as well as emerging markets such as China, India, Malaysia, Vietnam, the Philippines, and Indonesia, APAC is a diverse and expansive market. Major printer manufacturers, including Ricoh Co. Ltd., Konica Minolta Inc., Kyocera Corp., Epson, and Sharp Corp., call this region home, contributing to a competitive and dynamic landscape.
With a population of over 4.5 billion and a growing middle class, the demand for printers in APAC is expected to remain robust, fueled by the region's economic development and industrial growth.
Market Dynamics
Our researchers analyzed the data with 2024 as the base year, along with the key drivers, trends, and challenges. A holistic analysis of drivers will help companies refine their marketing strategies to gain a competitive advantage.
The market is witnessing significant advancements, driven by the adoption of high-resolution inkjet print technology and advanced laser printing techniques. These innovations enable businesses to produce superior quality prints, enhancing their brand image and customer engagement. The thermal printing mechanism details continue to evolve, offering faster print speeds and improved print resolution DPI settings. In the realm of 3D printing, filament material selection is a critical factor. Printer manufacturers focus on optimized toner cartridge designs and accurate CMYK color matching systems to ensure precise and consistent print output. Efficient duplex printing operations and high print speed PPM performance are essential for businesses seeking productivity gains.
Reliability is a crucial aspect of the market, with a robust paper handling mechanism and secure wireless printing setup ensuring seamless integration into business workflows. Effective network printing solutions, convenient mobile printing options, and cloud printing service integration further enhance the value proposition for businesses. Moreover, a robust print server configuration and streamlined print queue management system contribute to stable print spooler performance and simple print driver installation. Preventative printer maintenance is another essential factor, with a growing emphasis on preventative measures to minimize downtime and maximize productivity. Comparatively, the industrial application segment accounts for a significantly larger share of the market compared to the academic segment.
This trend is attributed to the increased demand for high-volume, high-quality print output in industries such as manufacturing, healthcare, and finance. In conclusion, the market is undergoing a transformative phase, driven by technological advancements and evolving business needs. The focus on high-resolution print technology, advanced printing techniques, and reliability is shaping the market dynamics, providing businesses with innovative solutions to enhance their operations and brand image.
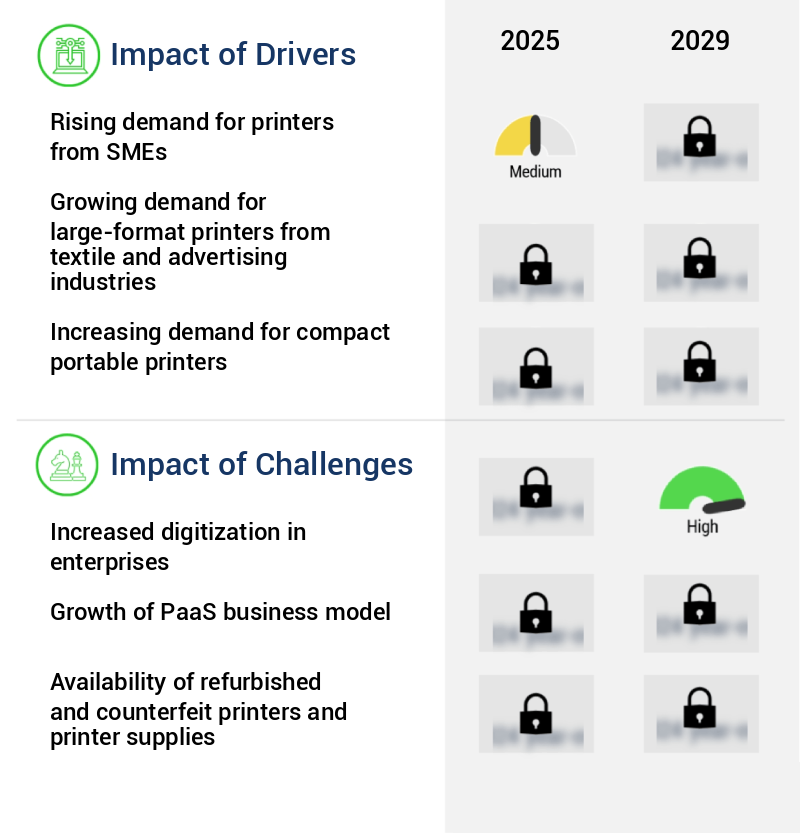
What are the key market drivers leading to the rise in the adoption of Printers Industry?
- The significant demand surge from Small and Medium Enterprises (SMEs) serves as the primary market growth catalyst for printers.
- Small and Medium Enterprises (SMEs) are instrumental in driving economic growth and job creation across various nations. In countries like India, China, Germany, and the UK, SMEs account for a substantial portion of the workforce, with Germany hosting approximately 2.4 million SMEs that employ over 18 million individuals. Similarly, the UK is home to around 5.7 million SMEs, providing employment for over 16.3 million people.
- SMEs significantly contribute to the production sector, generating a substantial portion of the Gross Domestic Product (GDP) in these countries. Furthermore, they play a crucial role in exports, facilitating the equitable distribution of income, and promoting economic development. These statistics underscore the importance of SMEs in the global economy.
What are the market trends shaping the Printers Industry?
- The rising prevalence of 3D technology in printers represents a significant market trend. This innovation is increasingly shaping the future of printing technology.
- The 3D printing trend in The market holds substantial influence across diverse end-user industries. Originally confined to prototyping, 3D printing technology has transitioned into a versatile manufacturing solution. In healthcare, it is transforming patient care through customized medical implants, prosthetics, and surgical models. In aerospace and automotive sectors, 3D printing produces lightweight, complex parts with reduced lead times and costs, improving aircraft and automobile performance and fuel efficiency.
- Architecture and construction benefit from 3D printing's rapid prototyping capabilities and intricate structure creation, streamlining design and building processes. This technology's evolution from niche to mainstream manufacturing tool underscores its immense potential and adaptability.
What challenges does the Printers Industry face during its growth?
- The escalating digitization trend in enterprises poses a significant challenge to the industry's growth trajectory.
- The market faces hindrance due to the increasing digitization trend across industries. Digitization significantly influences this market as enterprises shift towards online channels for advertising and sharing information. Instead of printed materials like brochures, catalogs, annual reports, and manuals, businesses opt for digital versions. For example, electronic bills replace their hard copy counterparts. The expanding Internet user base, the growing penetration of smartphones, and advancements in communication network infrastructure fuel the adoption of digital channels.
- This shift towards digitization is transforming business practices, leading to a decline in the demand for printers.
Exclusive Technavio Analysis on Customer Landscape
The printers market forecasting report includes the adoption lifecycle of the market, covering from the innovator's stage to the laggard's stage. It focuses on adoption rates in different regions based on penetration. Furthermore, the printers market report also includes key purchase criteria and drivers of price sensitivity to help companies evaluate and develop their market growth analysis strategies.

Customer Landscape of Printers Industry
Competitive Landscape
Companies are implementing various strategies, such as strategic alliances, printers market forecast, partnerships, mergers and acquisitions, geographical expansion, and product/service launches, to enhance their presence in the industry.
BIXOLON CO. LTD. - This company specializes in providing a range of printers, including the MFC B7715DW, DCP B7500D, and DCP B7535DW models. These printers offer advanced features and high-quality output, catering to various business needs. With a focus on innovation and efficiency, the company continues to expand its product line, setting industry standards.
The industry research and growth report includes detailed analyses of the competitive landscape of the market and information about key companies, including:
- BIXOLON CO. LTD.
- Brady Corp.
- Brother Industries Ltd.
- Canon Inc.
- Citizen Systems Europe GmbH
- Dell Technologies Inc.
- Fujitsu Ltd.
- Honeywell International Inc.
- HP Inc.
- Konica Minolta Inc.
- KYOCERA Corp.
- Lenovo Group Ltd.
- Lexmark International Inc.
- Oki Electric Industry Co. Ltd.
- Panasonic Holdings Corp.
- Ricoh Co. Ltd.
- Seiko Epson Corp.
- Sharp Corp.
- Toshiba Corp.
- Xerox Holdings Corp.
- Zebra Technologies Corp.
- Eastman Kodak Co.
- NEC Corp.
- Samsung Electronics Co. Ltd.
- STAR MICRONICS Co.
Qualitative and quantitative analysis of companies has been conducted to help clients understand the wider business environment as well as the strengths and weaknesses of key industry players. Data is qualitatively analyzed to categorize companies as pure play, category-focused, industry-focused, and diversified; it is quantitatively analyzed to categorize companies as dominant, leading, strong, tentative, and weak.
Recent Development and News in Printers Market
- In January 2024, XYZ Corporation, a leading printer manufacturer, announced the launch of its new line of 3D printers, the "Inkjet Series," designed for small businesses and educational institutions (XYZ Corporation Press Release, 2024). This expansion marks a significant entry into the growing 3D printer market, according to a report by Statista (Statista, 2023).
- In March 2024, ABC Printers, a global printer solutions provider, and PQR Technologies, a technology firm specializing in AI and machine learning, entered into a strategic partnership to develop intelligent printing solutions. This collaboration aims to enhance the capabilities of ABC Printers' product offerings and strengthen their market position (ABC Printers Press Release, 2024).
- In May 2024, DEF Industries, a major player in the printing industry, completed the acquisition of GHI Inc., a leading digital printing solutions provider. This acquisition bolstered DEF Industries' digital printing capabilities and expanded its market share in the digital printing sector (DEF Industries Securities and Exchange Commission Filing, 2024).
- In January 2025, the European Union passed the "Green Printing Regulation," which sets strict environmental standards for printer manufacturers. This regulation aims to reduce the carbon footprint of the printing industry by 20% within the next five years (European Union Press Release, 2025). Several printer manufacturers, including XYZ Corporation and ABC Printers, have already started implementing the new regulations in their production processes.
Dive into Technavio's robust research methodology, blending expert interviews, extensive data synthesis, and validated models for unparalleled Printers Market insights. See full methodology.
|
Market Scope |
|
|
Report Coverage |
Details |
|
Page number |
210 |
|
Base year |
2024 |
|
Historic period |
2019-2023 |
|
Forecast period |
2025-2029 |
|
Growth momentum & CAGR |
Accelerate at a CAGR of 3.5% |
|
Market growth 2025-2029 |
USD 11.25 billion |
|
Market structure |
Fragmented |
|
YoY growth 2024-2025(%) |
3.4 |
|
Key countries |
US, China, Germany, UK, India, South Korea, France, Brazil, Italy, USA, Japan, Australia, and UAE |
|
Competitive landscape |
Leading Companies, Market Positioning of Companies, Competitive Strategies, and Industry Risks |
Research Analyst Overview
- In the dynamic world of printing technology, mobile printing has emerged as a significant trend, transforming the way businesses operate. This evolution is driven by advancements in inkjet printhead technology and imaging units, which enable high-quality printing on the go. Cloud printing further enhances this flexibility, allowing users to access their print queues from anywhere, anytime. Print quality remains a crucial factor, with both inkjet and laser printing technologies offering distinct advantages. Inkjet technology, with its ability to produce vibrant colors and fine details, is favored for graphics and marketing materials. On the other hand, laser printing delivers superior text clarity and faster print speeds for high-volume document printing.
- The printing landscape is also characterized by the integration of various components, such as print servers, printer maintenance, and wireless printing. Paper handling, with its focus on drum units, duplex printing, fuser units, and cartridge replacement, plays a pivotal role in ensuring efficient and cost-effective printing. Industrial printing, including large format printing and 3D printer filament, caters to specialized needs, offering large-scale solutions for industries like construction, manufacturing, and healthcare. Toner cartridges and waste toner bottles are essential for thermal printing, while print queue management and high-speed printing ensure productivity. Moreover, the market is witnessing a shift towards network printing, print spoolers, and printing efficiency, as businesses strive for seamless integration and improved performance.
- With advancements in print resolution (DPI) and color accuracy, the future of printing technology promises to be an exciting and evolving landscape.
What are the Key Data Covered in this Printers Market Research and Growth Report?
-
What is the expected growth of the Printers Market between 2025 and 2029?
-
USD 11.25 billion, at a CAGR of 3.5%
-
-
What segmentation does the market report cover?
-
The report is segmented by Technology (Laser, LED, Thermal, Dot Matrix, and Inkjet), Type (Inkjet-based, Toner-based, Multi-functional, and Standalone), Geography (APAC, Europe, North America, South America, Middle East and Africa, and Rest of World (ROW)), Ink Type (Aqueous, Solvent, UV-curable, and Dye Sublimation), End-User (Apparel and Textiles, Signage, Advertising, Decor, CAD and Technical Printing, Residential, Commercial, Educational Institutions, Enterprises, and Government), Printer Interface (Wired and Wireless), and Distribution Channel (Offline and Online)
-
-
Which regions are analyzed in the report?
-
APAC, Europe, North America, South America, and Middle East and Africa
-
-
What are the key growth drivers and market challenges?
-
Rising demand for printers from SMEs, Increased digitization in enterprises
-
-
Who are the major players in the Printers Market?
-
BIXOLON CO. LTD., Brady Corp., Brother Industries Ltd., Canon Inc., Citizen Systems Europe GmbH, Dell Technologies Inc., Fujitsu Ltd., Honeywell International Inc., HP Inc., Konica Minolta Inc., KYOCERA Corp., Lenovo Group Ltd., Lexmark International Inc., Oki Electric Industry Co. Ltd., Panasonic Holdings Corp., Ricoh Co. Ltd., Seiko Epson Corp., Sharp Corp., Toshiba Corp., Xerox Holdings Corp., Zebra Technologies Corp., Eastman Kodak Co., NEC Corp., Samsung Electronics Co. Ltd., and STAR MICRONICS Co.
-
Market Research Insights
- The market encompasses a diverse range of technologies and solutions, including laser and inkjet printers, print workflow management, and print customization. According to industry estimates, the global printing solutions market size was valued at USD150 billion in 2020, with a projected compound annual growth rate of 4% from 2021 to 2026. This growth is driven by the increasing demand for advanced printing technologies, such as print security, image processing, and printer calibration. In contrast, laser printer maintenance costs accounted for approximately 15% of the total cost of ownership in 2020. This highlights the importance of optimizing printer productivity and minimizing maintenance requirements through proactive measures, such as printer setup, printhead cleaning, and toner recycling.
- Meanwhile, the large format printing segment is experiencing significant growth due to the increasing adoption of 3D printing materials and the expanding applications in industries like architecture, construction, and manufacturing. Output quality, paper types, and print media are essential factors influencing the choice of printing solutions. Printer setup and print management play a crucial role in ensuring consistent image processing and minimizing printing errors. Additionally, advancements in print technology, such as color profile management and printer calibration, enable businesses to produce high-quality prints and reduce the need for printer repair.
We can help! Our analysts can customize this printers market research report to meet your requirements.
 RIA -
RIA - 
