Product-based Sales Training Market Analysis, Size, and Forecast 2026-2030: APAC (China, India, and Japan), North America (US, Canada, and Mexico), Europe (Germany, UK, and France), South America (Brazil and Argentina), Middle East and Africa (Saudi Arabia, UAE, and South Africa), and Rest of World (ROW)

Product-based Sales Training Market Analysis, Size, and Forecast 2026-2030:
APAC (China, India, and Japan), North America (US, Canada, and Mexico), Europe (Germany, UK, and France), South America (Brazil and Argentina), Middle East and Africa (Saudi Arabia, UAE, and South Africa), and Rest of World (ROW)

Published: May 2026 288 Pages SKU: IRTNTR40439

Market Overview at a Glance

$2.97 B
Market Opportunity
7.3%
CAGR 2025 - 2030
35.6%
APAC Growth
$2.11 B
Consumer goods segment 2024

Product-based Sales Training Market Size 2026-2030

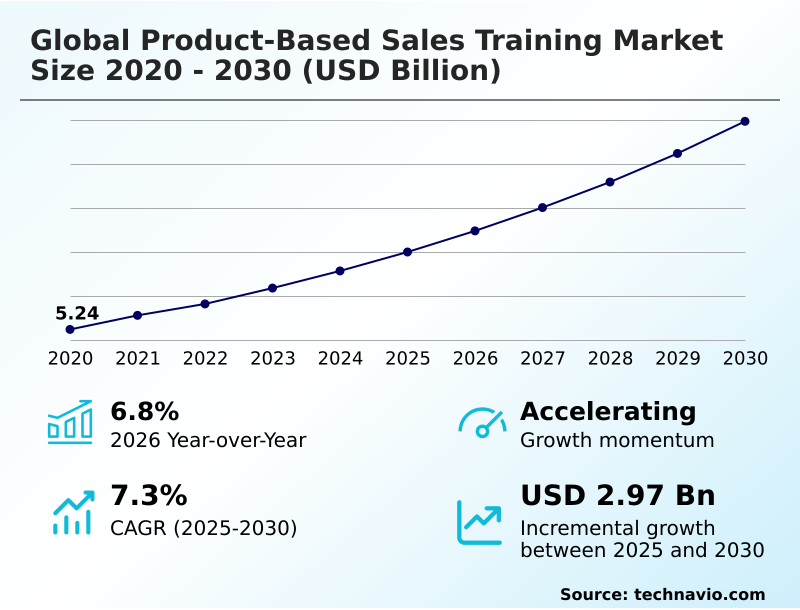
The Product-based Sales Training Market size was valued at USD 7.00 billion in 2025, growing at a CAGR of 7.3% during the forecast period 2026-2030.

Major Market Trends & Insights

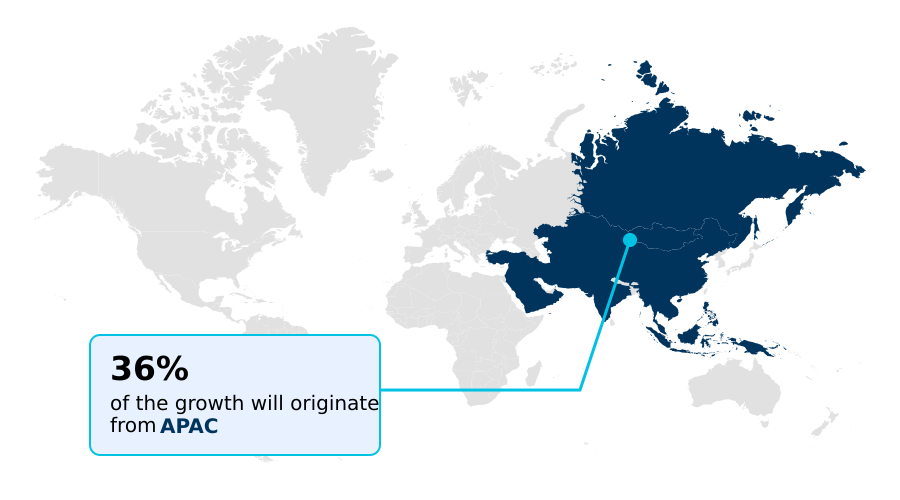
  • APAC dominated the market and accounted for a 35.6% growth during the forecast period.
  • By End-user - Consumer goods segment was valued at USD 2.11 billion in 2024
  • By Learning Method - Blended training segment accounted for the largest market revenue share in 2024

Market Size & Forecast

  • Historic Market Opportunities 2020-2024: USD 4.73 billion
  • Market Future Opportunities 2025-2030: USD 2.97 billion
  • CAGR from 2025 to 2030 : 7.3%

Market Summary

  • The product-based sales training market is defined by a shift toward data-driven, personalized learning modules, with organizations using analytics seeing a 15% improvement in identifying skill gaps. Another 25% increase in knowledge retention is observed when microlearning is applied.
  • For instance, a SaaS company launching a new software feature utilizes a blended learning approach, combining short video tutorials with AI-powered role-play simulations. This strategy is driven by the need for just-in-time learning to equip a global sales team quickly.
  • However, the market faces the challenge of lower retention rates, where nearly half of the training information is forgotten without continuous reinforcement. To counter this, firms are integrating on-demand training resources into their sales readiness platforms, aligning training with go-to-market strategy and ensuring sales teams can effectively communicate complex value propositions, directly impacting win rate optimization and customer success alignment.

What will be the Size of the Product-based Sales Training Market during the forecast period?

Get Key Insights on Market Forecast (PDF) Request Free Sample

How is the Product-based Sales Training Market Segmented?

The product-based sales training industry research report provides comprehensive data (region-wise segment analysis), with forecasts and analysis for the period 2026-2030, as well as historical data from 2020-2024 for the following segments.
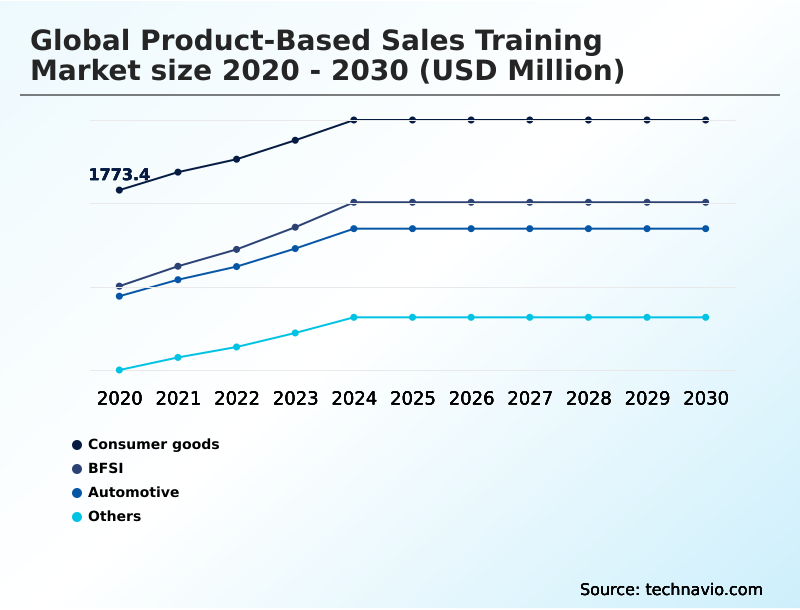
  • End-user
    • Consumer goods
    • BFSI
    • Automotive
    • Others
  • Learning method
    • Blended training
    • Online training
    • ILT
  • Sector
    • Large enterprises
    • SMEs
  • Geography
    • APAC
      • China
      • India
      • Japan
    • North America
      • US
      • Canada
      • Mexico
    • Europe
      • Germany
      • UK
      • France
    • South America
      • Brazil
      • Argentina
    • Middle East and Africa
      • Saudi Arabia
      • UAE
      • South Africa
    • Rest of World (ROW)

How is the Product-based Sales Training Market Segmented by End-user?

The consumer goods segment is estimated to witness significant growth during the forecast period.

The consumer goods segment's demand for product-based sales training is driven by rapid product cycles, with firms seeing a 20% improvement in deal velocity improvement by using targeted role-play simulation.

This sector accounts for a significant market share, with training focusing on value proposition messaging for a high volume of SKUs.

To enhance inside sales productivity, companies are implementing gamification in sales training, which has been shown to increase engagement by over 30%.

A structured mastery learning path, including rigorous objection handling practice and frequent product knowledge assessment, is critical for consistent sales playbook execution.

Effective training in this segment directly impacts customer success alignment by ensuring representatives can articulate unique product benefits in a competitive retail environment.

Request Free Sample

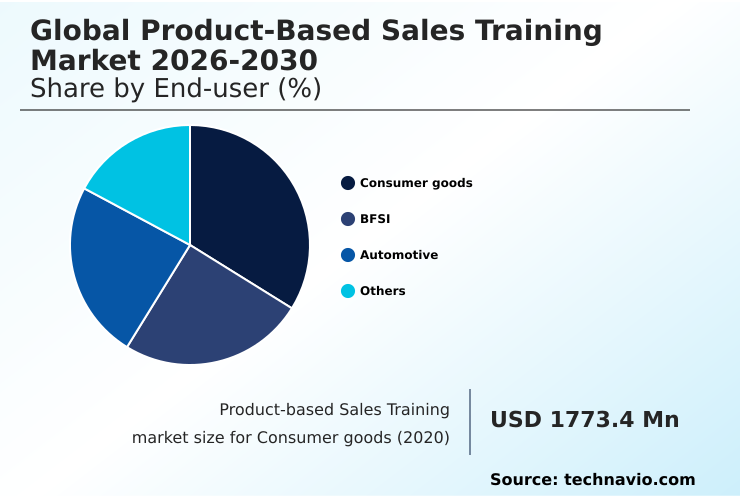
The Consumer goods segment was valued at USD 2.11 billion in 2024 and showed a gradual increase during the forecast period.

Request Free Sample

How demand for the Product-based Sales Training market is rising in the leading region?

APAC is estimated to contribute 35.6% to the growth of the global market during the forecast period.Technavio’s analysts have elaborately explained the regional trends and drivers that shape the market during the forecast period.

See How Product-based Sales Training Market demand is rising in APAC Request Free Sample

The geographic landscape shows significant regional disparities, with APAC projected to account for 35.6% of the market's incremental growth, outpacing North America's 29.1%.

This growth in APAC is driven by rapid digitalization, where localized scenario-based learning modules are improving deal velocity improvement by 15%.

In North America, the focus is on sophisticated revenue enablement strategies and integrating a consultative selling framework, with a 20% higher adoption of advanced sales methodology integration tools.

Go-to-market strategy alignment differs; APAC prioritizes mobile-first channel partner enablement, whereas North America emphasizes deep buyer journey mapping for enterprise clients.

Consequently, competitive positioning training in APAC focuses on volume, while North America targets high-value, complex sales, impacting overall field sales effectiveness.

What are the key Drivers, Trends, and Challenges in the Product-based Sales Training Market?

Our researchers analyzed the data with 2025 as the base year, along with the key drivers, trends, and challenges. A holistic analysis of drivers will help companies refine their marketing strategies to gain a competitive advantage.

  • Organizations are increasingly seeking specialized strategies for product sales training for complex B2B solutions, moving beyond generic sales coaching to focus on deep technical fluency. The central question for many is how to improve product knowledge retention for sales teams, as studies show that without reinforcement, sales reps forget up to 50% of training content within weeks.
  • To address this, leading companies are implementing a blended learning approach, combining self-paced digital modules with interactive workshops. A key component of this modern strategy involves understanding the best practices for virtual product launch training, ensuring that globally dispersed teams receive consistent and timely information.
  • A critical metric for success is measuring ROI of product-based sales training; firms that effectively link training activities to performance outcomes like improved deal velocity or higher win rates justify continued investment.
  • For instance, companies are now using AI role-playing for enterprise sales training, which provides a safe environment for reps to practice objection handling and refine their messaging, leading to a 15% increase in confidence and a 10% reduction in sales cycle length.
  • When considering product-based sales training for the automotive industry, for example, the focus is on equipping teams to explain complex EV technology and software features, a stark contrast to traditional vehicle sales.

What are the key market drivers leading to the rise in the adoption of Product-based Sales Training Industry?

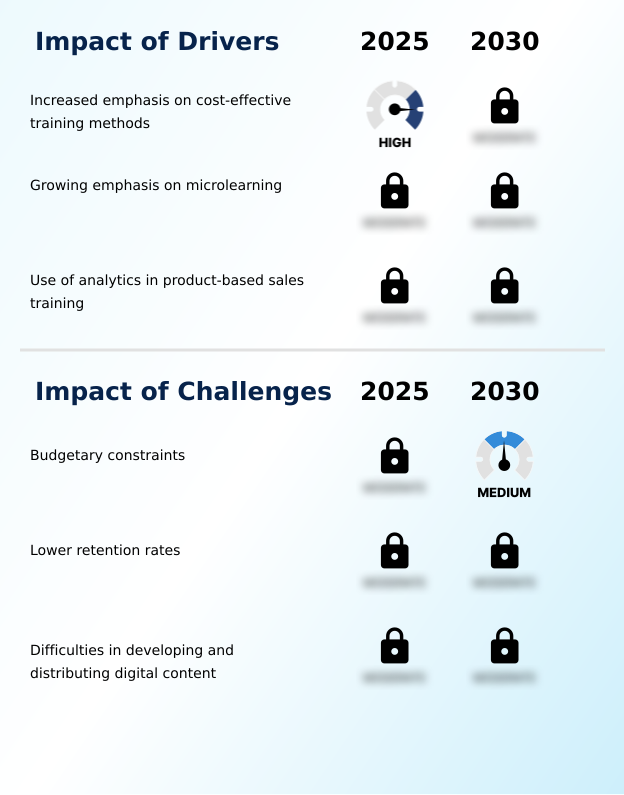
  • The increased emphasis on cost-effective training methods is a key driver of the market, prompting organizations to adopt more efficient and scalable learning solutions.

  • Increased emphasis on cost-effective training methods is a key driver, with organizations adopting a blended learning approach to reduce travel-related training costs by over 40%.
  • The growing emphasis on microlearning, delivered through a sales readiness platform, facilitates just-in-time learning and boosts knowledge retention by 25%. This approach supports a continuous learning culture and better quota attainment tracking.
  • Furthermore, the use of analytics in product-based sales training allows for improved sales manager coaching and targeted interventions. Analyzing data from the sales onboarding curriculum helps in win rate optimization by identifying and closing specific knowledge gaps early.

What are the market trends shaping the Product-based Sales Training Industry?

  • The growing use of artificial intelligence in product-based sales training is a significant trend. It is reshaping how organizations deliver and personalize learning experiences for sales teams.

  • The growing popularity of learning analytics is a primary trend, where organizations are seeing a 15% improvement in training ROI measurement through the use of a learning analytics dashboard. The emergence of VR as a training tool enables virtual reality sales simulation, reducing onboarding time by up to 20% compared to traditional methods.
  • Another key trend is the use of AI, particularly AI-driven sales coaching and customer conversation intelligence tools, to create an adaptive learning path. This content personalization engine analyzes performance data to customize modules, enhancing the customer engagement model. This shift toward data-driven, immersive training provides mobile learning accessibility and significantly boosts sales effectiveness and deal intelligence.

What challenges does the Product-based Sales Training Industry face during its growth?

  • Budgetary constraints represent a key challenge affecting industry growth, as they limit organizations' ability to invest in comprehensive training programs.

  • Budgetary constraints are a major challenge, often limiting investment in necessary on-demand training resources and advanced digital asset management systems. This leads to difficulties in developing and distributing digital content, causing a 30% lag in updating sales teams on new product features.
  • Lower retention rates compound this issue; without effective behavioral change reinforcement and strong coaching effectiveness, as much as 50% of training content is forgotten within a month. A lack of proper skills gap analysis and competency modeling means that training is not targeted, impacting customer success alignment. Inadequate content governance further complicates the delivery of consistent and accurate information.

Exclusive Technavio Analysis on Customer Landscape

The product-based sales training market forecasting report includes the adoption lifecycle of the market, covering from the innovator’s stage to the laggard’s stage. It focuses on adoption rates in different regions based on penetration. Furthermore, the product-based sales training market report also includes key purchase criteria and drivers of price sensitivity to help companies evaluate and develop their market growth analysis strategies.

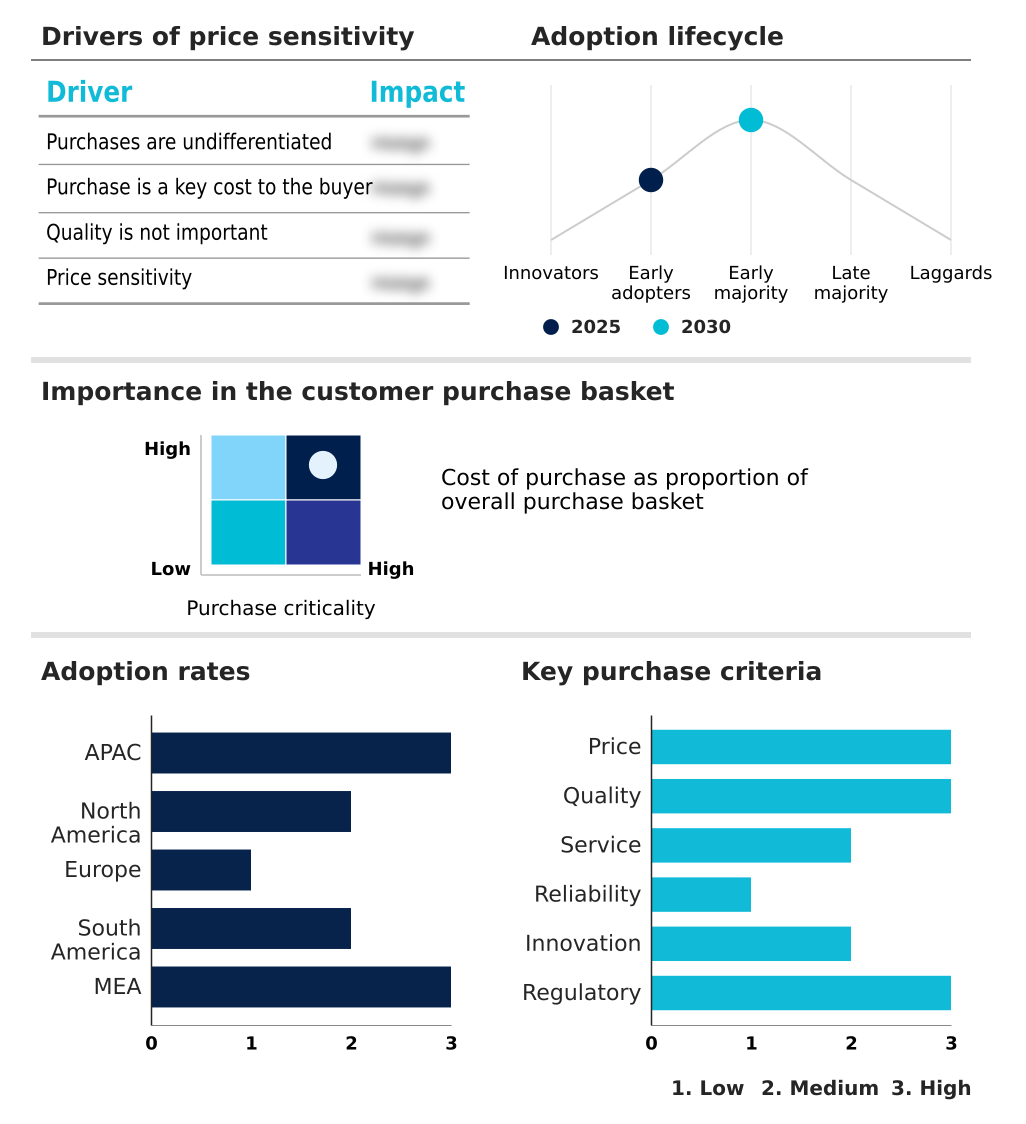
Customer Landscape of Product-based Sales Training Industry

Competitive Landscape

Companies are implementing various strategies, such as strategic alliances, product-based sales training market forecast, partnerships, mergers and acquisitions, geographical expansion, and product/service launches, to enhance their presence in the industry.

7th Level Inc. - Key offerings include customized, technology-driven sales training solutions, such as AI-powered simulations, scenario-based learning, and microlearning modules designed to enhance product knowledge and sales readiness.

The industry research and growth report includes detailed analyses of the competitive landscape of the market and information about key companies, including:

  • 7th Level Inc.
  • Allen Communication Learning
  • ASLAN Training and Development
  • Bigtincan Holdings Ltd.
  • CommLab India LLP
  • Corporate Visions Inc.
  • Denave India Pvt. Ltd.
  • GMetri Inc.
  • GP Strategies Corp.
  • Korn Ferry
  • RAIN Group
  • Richardson Sales Performance
  • SalesHood Inc.
  • Sandler Systems Inc.
  • Seismic Software Inc.
  • TACK TMI
  • ValueSelling Associates Inc.
  • VirtualSpeech Ltd.
  • Wilson Learning Worldwide Inc.
  • Winning By Design LLC

Qualitative and quantitative analysis of companies has been conducted to help clients understand the wider business environment as well as the strengths and weaknesses of key industry players. Data is qualitatively analyzed to categorize companies as pure play, category-focused, industry-focused, and diversified; it is quantitatively analyzed to categorize companies as dominant, leading, strong, tentative, and weak.

Market Intelligence Radar: High-Impact Developments & Growth Signals

  • In the Education Services industry, the widespread adoption of cloud-based learning management systems (LMS) and digital content delivery models has directly impacted the global product-based sales training market 2026-2030 by creating a foundation for scalable online and blended learning approaches. This shift enables the deployment of adaptive learning path modules and enhances mobile learning accessibility for globally dispersed sales teams.
  • In the Education Services industry, the integration of AI and analytics to personalize learning experiences has set a new standard. This development drives demand in the global product-based sales training market 2026-2030 for solutions with AI-driven sales coaching and predictive analytics, which offer data-backed insights into skills gaps and training effectiveness, improving the customer engagement model.
  • In the Education Services industry, a major shift toward microlearning and continuous professional development to support lifelong learning has influenced corporate training strategies. This directly fuels the global product-based sales training market 2026-2030, increasing demand for on-demand training resources and just-in-time learning modules that align with a continuous learning culture.
  • In the Education Services industry, the growing importance of verifiable digital credentials and certifications has created a need for competency modeling frameworks. For the global product-based sales training market 2026-2030, this translates to a greater emphasis on programs that offer formal certification and mastery learning path assessments, validating sales professionals' expertise in specific products.

Dive into Technavio’s robust research methodology, blending expert interviews, extensive data synthesis, and validated models for unparalleled Product-based Sales Training Market insights. See full methodology.

Market Scope
Page number 288
Base year 2025
Historic period 2020-2024
Forecast period 2026-2030
Growth momentum & CAGR Accelerate at a CAGR of 7.3%
Market growth 2026-2030 USD 2966.8 million
Market structure Fragmented
YoY growth 2025-2026(%) 6.8%
Key countries China, India, Japan, Australia, South Korea, Indonesia, US, Canada, Mexico, Germany, UK, France, Italy, Spain, The Netherlands, Brazil, Argentina, Chile, Saudi Arabia, UAE, South Africa, Egypt and Nigeria
Competitive landscape Leading Companies, Market Positioning of Companies, Competitive Strategies, and Industry Risks

Request Free Sample

Research Analyst Overview

  • The product-based sales training market ecosystem is a complex network where technology providers and content creators are central, with learning management system (LMS) providers seeing a 10% increase in integration requests for specialized analytics. These core players supply sales enablement platforms and custom courseware to end-user organizations across sectors like BFSI and automotive.
  • Distribution is increasingly digital, leveraging cloud-based platforms that enable on-demand training resources and microlearning content delivery, reducing deployment costs by over 30%. Sales consultants and methodology firms act as key enablers, providing the consultative selling framework and sales methodology integration that shape training content.
  • The entire ecosystem is driven by the end-user demand for improved sales effectiveness, with a focus on measurable outcomes like win rate optimization and faster sales cycle acceleration.

What are the Key Data Covered in this Product-based Sales Training Market Research and Growth Report?

  • What is the expected growth of the Product-based Sales Training Market between 2026 and 2030?

    • The Product-based Sales Training Market is expected to grow by USD 2.97 billion during 2026-2030, registering a CAGR of 7.3%. Year-over-year growth in 2026 is estimated at 6.8%%. This acceleration is shaped by increased emphasis on cost-effective training methods, which is intensifying demand across multiple end-use verticals covered in the report.

  • What segmentation does the market report cover?

    • The report is segmented by End-user (Consumer goods, BFSI, Automotive, and Others), Learning Method (Blended training, Online training, and ILT), Sector (Large enterprises, and SMEs) and Geography (APAC, North America, Europe, South America, Middle East and Africa). Among these, the Consumer goods segment is estimated to witness significant growth during the forecast period, driven by rising adoption across key application areas. Each segment includes detailed qualitative and quantitative analysis, along with historical data from 2020-2024 and forecasts through 2030 with year-over-year growth rates.

  • Which regions are analyzed in the report?

    • The report covers APAC, North America, Europe, South America and Middle East and Africa. APAC is estimated to contribute 35.6% to market growth during the forecast period. Country-level analysis includes China, India, Japan, Australia, South Korea, Indonesia, US, Canada, Mexico, Germany, UK, France, Italy, Spain, The Netherlands, Brazil, Argentina, Chile, Saudi Arabia, UAE, South Africa, Egypt and Nigeria, with dedicated market size tables and year-over-year growth for each.

  • What are the key growth drivers and market challenges?

    • The primary driver is increased emphasis on cost-effective training methods, which is accelerating investment and industry demand. The main challenge is budgetary constraints, creating operational barriers for key market participants. The report quantifies the impact of each driver and challenge across 2026 and 2030 with comparative analysis.

  • Who are the major players in the Product-based Sales Training Market?

    • Key vendors include 7th Level Inc., Allen Communication Learning, ASLAN Training and Development, Bigtincan Holdings Ltd., CommLab India LLP, Corporate Visions Inc., Denave India Pvt. Ltd., GMetri Inc., GP Strategies Corp., Korn Ferry, RAIN Group, Richardson Sales Performance, SalesHood Inc., Sandler Systems Inc., Seismic Software Inc., TACK TMI, ValueSelling Associates Inc., VirtualSpeech Ltd., Wilson Learning Worldwide Inc. and Winning By Design LLC. The report provides qualitative and quantitative analysis categorizing companies as dominant, leading, strong, tentative, and weak based on their market positioning. Company profiles include business segment analysis, SWOT assessment, key offerings, and recent strategic developments.

Market Research Insights

  • The competitive landscape for product-based sales training shows that vendors leveraging AI can improve training ROI measurement by over 15%. This space is dominated by a mix of specialized consultancies and technology platform providers actively innovating to meet enterprise demand.
  • For instance, key players like Richardson Sales Performance are integrating generative AI to create more realistic role-play simulations, which can accelerate a new hire's time-to-productivity by 20%. Concurrently, sales enablement platforms such as Seismic Software Inc. are enhancing their solutions to provide just-in-time learning and better content governance, directly aligning training content with active sales cycles.
  • This focus on technology integration addresses the core market challenge of delivering scalable and effective training for increasingly complex product portfolios amid pressures to improve sales manager coaching and overall deal velocity.

We can help! Our analysts can customize this product-based sales training market research report to meet your requirements.

Get in touch

1. Executive Summary

1.1 Market overview

Executive Summary - Chart on Market Overview
Executive Summary - Data Table on Market Overview
Executive Summary - Chart on Global Market Characteristics
Executive Summary - Chart on Market by Geography
Executive Summary - Chart on Market Segmentation by End-user
Executive Summary - Chart on Market Segmentation by Learning Method
Executive Summary - Chart on Market Segmentation by Sector
Executive Summary - Chart on Incremental Growth
Executive Summary - Data Table on Incremental Growth
Executive Summary - Chart on Company Market Positioning

2. Technavio Analysis

2.1 Analysis of price sensitivity, lifecycle, customer purchase basket, adoption rates, and purchase criteria

2.2 Criticality of inputs and Factors of differentiation

Chart on Overview on criticality of inputs and factors of differentiation

2.3 Factors of disruption

Chart on Overview on factors of disruption

2.4 Impact of drivers and challenges

Chart on Impact of drivers and challenges in 2025 and 2030

3. Market Landscape

3.1 Market ecosystem

Chart on Parent Market
Data Table on - Parent Market

3.2 Market characteristics

Chart on Market characteristics analysis

3.3 Value chain analysis

Chart on Value chain analysis

4. Market Sizing

4.1 Market definition

Data Table on Offerings of companies included in the market definition

4.2 Market segment analysis

Market segments

4.3 Market size 2025

4.4 Market outlook: Forecast for 2025-2030

Chart on Global - Market size and forecast 2025-2030 ($ million)
Data Table on Global - Market size and forecast 2025-2030 ($ million)
Chart on Global Market: Year-over-year growth 2025-2030 (%)
Data Table on Global Market: Year-over-year growth 2025-2030 (%)

5. Historic Market Size

5.1 Global Product-Based Sales Training Market 2020 - 2024

Historic Market Size - Data Table on Global Product-Based Sales Training Market 2020 - 2024 ($ million)

5.2 End-user segment analysis 2020 - 2024

Historic Market Size - End-user Segment 2020 - 2024 ($ million)

5.3 Learning Method segment analysis 2020 - 2024

Historic Market Size - Learning Method Segment 2020 - 2024 ($ million)

5.4 Sector segment analysis 2020 - 2024

Historic Market Size - Sector Segment 2020 - 2024 ($ million)

5.5 Geography segment analysis 2020 - 2024

Historic Market Size - Geography Segment 2020 - 2024 ($ million)

5.6 Country segment analysis 2020 - 2024

Historic Market Size - Country Segment 2020 - 2024 ($ million)

6. Qualitative Analysis

6.1 The impact of AI on Global Product-based Sales Training Market

7. Five Forces Analysis

7.1 Five forces summary

Five forces analysis - Comparison between 2025 and 2030

7.2 Bargaining power of buyers

Bargaining power of buyers - Impact of key factors 2025 and 2030

7.3 Bargaining power of suppliers

Bargaining power of suppliers - Impact of key factors in 2025 and 2030

7.4 Threat of new entrants

Threat of new entrants - Impact of key factors in 2025 and 2030

7.5 Threat of substitutes

Threat of substitutes - Impact of key factors in 2025 and 2030

7.6 Threat of rivalry

Threat of rivalry - Impact of key factors in 2025 and 2030

7.7 Market condition

Chart on Market condition - Five forces 2025 and 2030

8. Market Segmentation by End-user

8.1 Market segments

Chart on End-user - Market share 2025-2030 (%)
Data Table on End-user - Market share 2025-2030 (%)

8.2 Comparison by End-user

Chart on Comparison by End-user
Data Table on Comparison by End-user

8.3 Consumer goods - Market size and forecast 2025-2030

Chart on Consumer goods - Market size and forecast 2025-2030 ($ million)
Data Table on Consumer goods - Market size and forecast 2025-2030 ($ million)
Chart on Consumer goods - Year-over-year growth 2025-2030 (%)
Data Table on Consumer goods - Year-over-year growth 2025-2030 (%)

8.4 BFSI - Market size and forecast 2025-2030

Chart on BFSI - Market size and forecast 2025-2030 ($ million)
Data Table on BFSI - Market size and forecast 2025-2030 ($ million)
Chart on BFSI - Year-over-year growth 2025-2030 (%)
Data Table on BFSI - Year-over-year growth 2025-2030 (%)

8.5 Automotive - Market size and forecast 2025-2030

Chart on Automotive - Market size and forecast 2025-2030 ($ million)
Data Table on Automotive - Market size and forecast 2025-2030 ($ million)
Chart on Automotive - Year-over-year growth 2025-2030 (%)
Data Table on Automotive - Year-over-year growth 2025-2030 (%)

8.6 Others - Market size and forecast 2025-2030

Chart on Others - Market size and forecast 2025-2030 ($ million)
Data Table on Others - Market size and forecast 2025-2030 ($ million)
Chart on Others - Year-over-year growth 2025-2030 (%)
Data Table on Others - Year-over-year growth 2025-2030 (%)

8.7 Market opportunity by End-user

Market opportunity by End-user ($ million)
Data Table on Market opportunity by End-user ($ million)

9. Market Segmentation by Learning Method

9.1 Market segments

Chart on Learning Method - Market share 2025-2030 (%)
Data Table on Learning Method - Market share 2025-2030 (%)

9.2 Comparison by Learning Method

Chart on Comparison by Learning Method
Data Table on Comparison by Learning Method

9.3 Blended training - Market size and forecast 2025-2030

Chart on Blended training - Market size and forecast 2025-2030 ($ million)
Data Table on Blended training - Market size and forecast 2025-2030 ($ million)
Chart on Blended training - Year-over-year growth 2025-2030 (%)
Data Table on Blended training - Year-over-year growth 2025-2030 (%)

9.4 Online training - Market size and forecast 2025-2030

Chart on Online training - Market size and forecast 2025-2030 ($ million)
Data Table on Online training - Market size and forecast 2025-2030 ($ million)
Chart on Online training - Year-over-year growth 2025-2030 (%)
Data Table on Online training - Year-over-year growth 2025-2030 (%)

9.5 ILT - Market size and forecast 2025-2030

Chart on ILT - Market size and forecast 2025-2030 ($ million)
Data Table on ILT - Market size and forecast 2025-2030 ($ million)
Chart on ILT - Year-over-year growth 2025-2030 (%)
Data Table on ILT - Year-over-year growth 2025-2030 (%)

9.6 Market opportunity by Learning Method

Market opportunity by Learning Method ($ million)
Data Table on Market opportunity by Learning Method ($ million)

10. Market Segmentation by Sector

10.1 Market segments

Chart on Sector - Market share 2025-2030 (%)
Data Table on Sector - Market share 2025-2030 (%)

10.2 Comparison by Sector

Chart on Comparison by Sector
Data Table on Comparison by Sector

10.3 Large enterprises - Market size and forecast 2025-2030

Chart on Large enterprises - Market size and forecast 2025-2030 ($ million)
Data Table on Large enterprises - Market size and forecast 2025-2030 ($ million)
Chart on Large enterprises - Year-over-year growth 2025-2030 (%)
Data Table on Large enterprises - Year-over-year growth 2025-2030 (%)

10.4 SMEs - Market size and forecast 2025-2030

Chart on SMEs - Market size and forecast 2025-2030 ($ million)
Data Table on SMEs - Market size and forecast 2025-2030 ($ million)
Chart on SMEs - Year-over-year growth 2025-2030 (%)
Data Table on SMEs - Year-over-year growth 2025-2030 (%)

10.5 Market opportunity by Sector

Market opportunity by Sector ($ million)
Data Table on Market opportunity by Sector ($ million)

11. Customer Landscape

11.1 Customer landscape overview

Analysis of price sensitivity, lifecycle, customer purchase basket, adoption rates, and purchase criteria

12. Geographic Landscape

12.1 Geographic segmentation

Chart on Market share by geography 2025-2030 (%)
Data Table on Market share by geography 2025-2030 (%)

12.2 Geographic comparison

Chart on Geographic comparison
Data Table on Geographic comparison

12.3 APAC - Market size and forecast 2025-2030

Chart on APAC - Market size and forecast 2025-2030 ($ million)
Data Table on APAC - Market size and forecast 2025-2030 ($ million)
Chart on APAC - Year-over-year growth 2025-2030 (%)
Data Table on APAC - Year-over-year growth 2025-2030 (%)
Chart on Regional Comparison - APAC
Data Table on Regional Comparison - APAC

12.3.1 China - Market size and forecast 2025-2030

Chart on China - Market size and forecast 2025-2030 ($ million)
Data Table on China - Market size and forecast 2025-2030 ($ million)
Chart on China - Year-over-year growth 2025-2030 (%)
Data Table on China - Year-over-year growth 2025-2030 (%)

12.3.2 India - Market size and forecast 2025-2030

Chart on India - Market size and forecast 2025-2030 ($ million)
Data Table on India - Market size and forecast 2025-2030 ($ million)
Chart on India - Year-over-year growth 2025-2030 (%)
Data Table on India - Year-over-year growth 2025-2030 (%)

12.3.3 Japan - Market size and forecast 2025-2030

Chart on Japan - Market size and forecast 2025-2030 ($ million)
Data Table on Japan - Market size and forecast 2025-2030 ($ million)
Chart on Japan - Year-over-year growth 2025-2030 (%)
Data Table on Japan - Year-over-year growth 2025-2030 (%)

12.3.4 Australia - Market size and forecast 2025-2030

Chart on Australia - Market size and forecast 2025-2030 ($ million)
Data Table on Australia - Market size and forecast 2025-2030 ($ million)
Chart on Australia - Year-over-year growth 2025-2030 (%)
Data Table on Australia - Year-over-year growth 2025-2030 (%)

12.3.5 South Korea - Market size and forecast 2025-2030

Chart on South Korea - Market size and forecast 2025-2030 ($ million)
Data Table on South Korea - Market size and forecast 2025-2030 ($ million)
Chart on South Korea - Year-over-year growth 2025-2030 (%)
Data Table on South Korea - Year-over-year growth 2025-2030 (%)

12.3.6 Indonesia - Market size and forecast 2025-2030

Chart on Indonesia - Market size and forecast 2025-2030 ($ million)
Data Table on Indonesia - Market size and forecast 2025-2030 ($ million)
Chart on Indonesia - Year-over-year growth 2025-2030 (%)
Data Table on Indonesia - Year-over-year growth 2025-2030 (%)

12.4 North America - Market size and forecast 2025-2030

Chart on North America - Market size and forecast 2025-2030 ($ million)
Data Table on North America - Market size and forecast 2025-2030 ($ million)
Chart on North America - Year-over-year growth 2025-2030 (%)
Data Table on North America - Year-over-year growth 2025-2030 (%)
Chart on Regional Comparison - North America
Data Table on Regional Comparison - North America

12.4.1 US - Market size and forecast 2025-2030

Chart on US - Market size and forecast 2025-2030 ($ million)
Data Table on US - Market size and forecast 2025-2030 ($ million)
Chart on US - Year-over-year growth 2025-2030 (%)
Data Table on US - Year-over-year growth 2025-2030 (%)

12.4.2 Canada - Market size and forecast 2025-2030

Chart on Canada - Market size and forecast 2025-2030 ($ million)
Data Table on Canada - Market size and forecast 2025-2030 ($ million)
Chart on Canada - Year-over-year growth 2025-2030 (%)
Data Table on Canada - Year-over-year growth 2025-2030 (%)

12.4.3 Mexico - Market size and forecast 2025-2030

Chart on Mexico - Market size and forecast 2025-2030 ($ million)
Data Table on Mexico - Market size and forecast 2025-2030 ($ million)
Chart on Mexico - Year-over-year growth 2025-2030 (%)
Data Table on Mexico - Year-over-year growth 2025-2030 (%)

12.5 Europe - Market size and forecast 2025-2030

Chart on Europe - Market size and forecast 2025-2030 ($ million)
Data Table on Europe - Market size and forecast 2025-2030 ($ million)
Chart on Europe - Year-over-year growth 2025-2030 (%)
Data Table on Europe - Year-over-year growth 2025-2030 (%)
Chart on Regional Comparison - Europe
Data Table on Regional Comparison - Europe

12.5.1 Germany - Market size and forecast 2025-2030

Chart on Germany - Market size and forecast 2025-2030 ($ million)
Data Table on Germany - Market size and forecast 2025-2030 ($ million)
Chart on Germany - Year-over-year growth 2025-2030 (%)
Data Table on Germany - Year-over-year growth 2025-2030 (%)

12.5.2 UK - Market size and forecast 2025-2030

Chart on UK - Market size and forecast 2025-2030 ($ million)
Data Table on UK - Market size and forecast 2025-2030 ($ million)
Chart on UK - Year-over-year growth 2025-2030 (%)
Data Table on UK - Year-over-year growth 2025-2030 (%)

12.5.3 France - Market size and forecast 2025-2030

Chart on France - Market size and forecast 2025-2030 ($ million)
Data Table on France - Market size and forecast 2025-2030 ($ million)
Chart on France - Year-over-year growth 2025-2030 (%)
Data Table on France - Year-over-year growth 2025-2030 (%)

12.5.4 Italy - Market size and forecast 2025-2030

Chart on Italy - Market size and forecast 2025-2030 ($ million)
Data Table on Italy - Market size and forecast 2025-2030 ($ million)
Chart on Italy - Year-over-year growth 2025-2030 (%)
Data Table on Italy - Year-over-year growth 2025-2030 (%)

12.5.5 Spain - Market size and forecast 2025-2030

Chart on Spain - Market size and forecast 2025-2030 ($ million)
Data Table on Spain - Market size and forecast 2025-2030 ($ million)
Chart on Spain - Year-over-year growth 2025-2030 (%)
Data Table on Spain - Year-over-year growth 2025-2030 (%)

12.5.6 The Netherlands - Market size and forecast 2025-2030

Chart on The Netherlands - Market size and forecast 2025-2030 ($ million)
Data Table on The Netherlands - Market size and forecast 2025-2030 ($ million)
Chart on The Netherlands - Year-over-year growth 2025-2030 (%)
Data Table on The Netherlands - Year-over-year growth 2025-2030 (%)

12.6 South America - Market size and forecast 2025-2030

Chart on South America - Market size and forecast 2025-2030 ($ million)
Data Table on South America - Market size and forecast 2025-2030 ($ million)
Chart on South America - Year-over-year growth 2025-2030 (%)
Data Table on South America - Year-over-year growth 2025-2030 (%)
Chart on Regional Comparison - South America
Data Table on Regional Comparison - South America

12.6.1 Brazil - Market size and forecast 2025-2030

Chart on Brazil - Market size and forecast 2025-2030 ($ million)
Data Table on Brazil - Market size and forecast 2025-2030 ($ million)
Chart on Brazil - Year-over-year growth 2025-2030 (%)
Data Table on Brazil - Year-over-year growth 2025-2030 (%)

12.6.2 Argentina - Market size and forecast 2025-2030

Chart on Argentina - Market size and forecast 2025-2030 ($ million)
Data Table on Argentina - Market size and forecast 2025-2030 ($ million)
Chart on Argentina - Year-over-year growth 2025-2030 (%)
Data Table on Argentina - Year-over-year growth 2025-2030 (%)

12.6.3 Chile - Market size and forecast 2025-2030

Chart on Chile - Market size and forecast 2025-2030 ($ million)
Data Table on Chile - Market size and forecast 2025-2030 ($ million)
Chart on Chile - Year-over-year growth 2025-2030 (%)
Data Table on Chile - Year-over-year growth 2025-2030 (%)

12.7 Middle East and Africa - Market size and forecast 2025-2030

Chart on Middle East and Africa - Market size and forecast 2025-2030 ($ million)
Data Table on Middle East and Africa - Market size and forecast 2025-2030 ($ million)
Chart on Middle East and Africa - Year-over-year growth 2025-2030 (%)
Data Table on Middle East and Africa - Year-over-year growth 2025-2030 (%)
Chart on Regional Comparison - Middle East and Africa
Data Table on Regional Comparison - Middle East and Africa

12.7.1 Saudi Arabia - Market size and forecast 2025-2030

Chart on Saudi Arabia - Market size and forecast 2025-2030 ($ million)
Data Table on Saudi Arabia - Market size and forecast 2025-2030 ($ million)
Chart on Saudi Arabia - Year-over-year growth 2025-2030 (%)
Data Table on Saudi Arabia - Year-over-year growth 2025-2030 (%)

12.7.2 UAE - Market size and forecast 2025-2030

Chart on UAE - Market size and forecast 2025-2030 ($ million)
Data Table on UAE - Market size and forecast 2025-2030 ($ million)
Chart on UAE - Year-over-year growth 2025-2030 (%)
Data Table on UAE - Year-over-year growth 2025-2030 (%)

12.7.3 South Africa - Market size and forecast 2025-2030

Chart on South Africa - Market size and forecast 2025-2030 ($ million)
Data Table on South Africa - Market size and forecast 2025-2030 ($ million)
Chart on South Africa - Year-over-year growth 2025-2030 (%)
Data Table on South Africa - Year-over-year growth 2025-2030 (%)

12.7.4 Egypt - Market size and forecast 2025-2030

Chart on Egypt - Market size and forecast 2025-2030 ($ million)
Data Table on Egypt - Market size and forecast 2025-2030 ($ million)
Chart on Egypt - Year-over-year growth 2025-2030 (%)
Data Table on Egypt - Year-over-year growth 2025-2030 (%)

12.7.5 Nigeria - Market size and forecast 2025-2030

Chart on Nigeria - Market size and forecast 2025-2030 ($ million)
Data Table on Nigeria - Market size and forecast 2025-2030 ($ million)
Chart on Nigeria - Year-over-year growth 2025-2030 (%)
Data Table on Nigeria - Year-over-year growth 2025-2030 (%)

12.8 Market opportunity by geography

Market opportunity by geography ($ million)
Data Tables on Market opportunity by geography ($ million)

13. Drivers, Challenges, and Opportunity

13.1 Market drivers

Increased emphasis on cost-effective training methods
Growing emphasis on microlearning
Use of analytics in product-based sales training

13.2 Market challenges

Budgetary constraints
Lower retention rates
Difficulties in developing and distributing digital content

13.3 Impact of drivers and challenges

Impact of drivers and challenges in 2025 and 2030

13.4 Market opportunities

Growing use of artificial intelligence in training
Emergence of VR as training tool
Growing popularity of learning analytic

14. Competitive Landscape

14.1 Overview

14.2

Overview on criticality of inputs and factors of differentiation

14.3 Landscape disruption

Overview on factors of disruption

14.4 Industry risks

Impact of key risks on business

15. Competitive Analysis

15.1 Companies profiled

Companies covered

15.2 Company ranking index

15.3 Market positioning of companies

Matrix on companies position and classification

15.4 Allen Communication Learning

Allen Communication Learning - Overview
Allen Communication Learning - Product / Service
Allen Communication Learning - Key offerings
SWOT

15.5 Bigtincan Holdings Ltd.

Bigtincan Holdings Ltd. - Overview
Bigtincan Holdings Ltd. - Product / Service
Bigtincan Holdings Ltd. - Key offerings
SWOT

15.6 Corporate Visions Inc.

Corporate Visions Inc. - Overview
Corporate Visions Inc. - Product / Service
Corporate Visions Inc. - Key offerings
SWOT

15.7 Denave India Pvt. Ltd.

Denave India Pvt. Ltd. - Overview
Denave India Pvt. Ltd. - Product / Service
Denave India Pvt. Ltd. - Key offerings
SWOT

15.8 GP Strategies Corp.

GP Strategies Corp. - Overview
GP Strategies Corp. - Product / Service
GP Strategies Corp. - Key offerings
SWOT

15.9 Korn Ferry

Korn Ferry - Overview
Korn Ferry - Business segments
Korn Ferry - Key news
Korn Ferry - Key offerings
Korn Ferry - Segment focus
SWOT

15.10 RAIN Group

RAIN Group - Overview
RAIN Group - Product / Service
RAIN Group - Key offerings
SWOT

15.11 Richardson Sales Performance

Richardson Sales Performance - Overview
Richardson Sales Performance - Product / Service
Richardson Sales Performance - Key offerings
SWOT

15.12 SalesHood Inc.

SalesHood Inc. - Overview
SalesHood Inc. - Product / Service
SalesHood Inc. - Key offerings
SWOT

15.13 Sandler Systems Inc.

Sandler Systems Inc. - Overview
Sandler Systems Inc. - Product / Service
Sandler Systems Inc. - Key offerings
SWOT

15.14 Seismic Software Inc.

Seismic Software Inc. - Overview
Seismic Software Inc. - Product / Service
Seismic Software Inc. - Key offerings
SWOT

15.15 TACK TMI

TACK TMI - Overview
TACK TMI - Product / Service
TACK TMI - Key offerings
SWOT

15.16 VirtualSpeech Ltd.

VirtualSpeech Ltd. - Overview
VirtualSpeech Ltd. - Product / Service
VirtualSpeech Ltd. - Key offerings
SWOT

15.17 Wilson Learning Worldwide Inc.

Wilson Learning Worldwide Inc. - Overview
Wilson Learning Worldwide Inc. - Product / Service
Wilson Learning Worldwide Inc. - Key offerings
SWOT

15.18 Winning By Design LLC

Winning By Design LLC - Overview
Winning By Design LLC - Product / Service
Winning By Design LLC - Key offerings
SWOT

16. Appendix

16.1 Scope of the report

Market definition
Objectives
Notes and caveats

16.2 Inclusions and exclusions checklist

Inclusions checklist
Exclusions checklist

16.3 Currency conversion rates for US$

16.4 Research methodology

16.5 Data procurement

Information sources

16.6 Data validation

16.7 Validation techniques employed for market sizing

16.8 Data synthesis

16.9 360 degree market analysis

16.10 List of abbreviations

Research Methodology

Technavio presents a detailed picture of the market by way of study, synthesis, and summation of data from multiple sources. The analysts have presented the various facets of the market with a particular focus on identifying the key industry influencers. The data thus presented is comprehensive, reliable, and the result of extensive research, both primary and secondary.

INFORMATION SOURCES

Primary sources

  • Manufacturers and suppliers
  • Channel partners
  • Industry experts
  • Strategic decision makers

Secondary sources

  • Industry journals and periodicals
  • Government data
  • Financial reports of key industry players
  • Historical data
  • Press releases

DATA ANALYSIS

Data Synthesis

  • Collation of data
  • Estimation of key figures
  • Analysis of derived insights

Data Validation

  • Triangulation with data models
  • Reference against proprietary databases
  • Corroboration with industry experts

REPORT WRITING

Qualitative

  • Market drivers
  • Market challenges
  • Market trends
  • Five forces analysis

Quantitative

  • Market size and forecast
  • Market segmentation
  • Geographical insights
  • Competitive landscape

Interested in this report?

Get your sample now to see our research methodology and insights!

Download Now

Frequently Asked Questions

Product-based Sales Training market growth will increase by USD 2966.8 million during 2026-2030.

The Product-based Sales Training market is expected to grow at a CAGR of 7.3% during 2026-2030.

Product-based Sales Training market is segmented by End-user (Consumer goods, BFSI, Automotive, Others) Learning method (Blended training, Online training, ILT) Sector (Large enterprises, SMEs)

7th Level Inc., Allen Communication Learning, ASLAN Training and Development, Bigtincan Holdings Ltd., CommLab India LLP, Corporate Visions Inc., Denave India Pvt. Ltd., GMetri Inc., GP Strategies Corp., Korn Ferry, RAIN Group, Richardson Sales Performance, SalesHood Inc., Sandler Systems Inc., Seismic Software Inc., TACK TMI, ValueSelling Associates Inc., VirtualSpeech Ltd., Wilson Learning Worldwide Inc., Winning By Design LLC are a few of the key vendors in the Product-based Sales Training market.

APAC will register the highest growth rate of 35.6% among the other regions. Therefore, the Product-based Sales Training market in APAC is expected to garner significant business opportunities for the vendors during the forecast period.

China, India, Japan, Australia, South Korea, Indonesia, US, Canada, Mexico, Germany, UK, France, Italy, Spain, The Netherlands, Brazil, Argentina, Chile, Saudi Arabia, UAE, South Africa, Egypt, Nigeria

  • Increased emphasis on cost-effective training methods is the driving factor this market.

The Product-based Sales Training market vendors should focus on grabbing business opportunities from the End-user segment as it accounted for the largest market share in the base year.
RIA - Research AI Assistant
Ask RIA