
Protective Relay Market Size 2026-2030
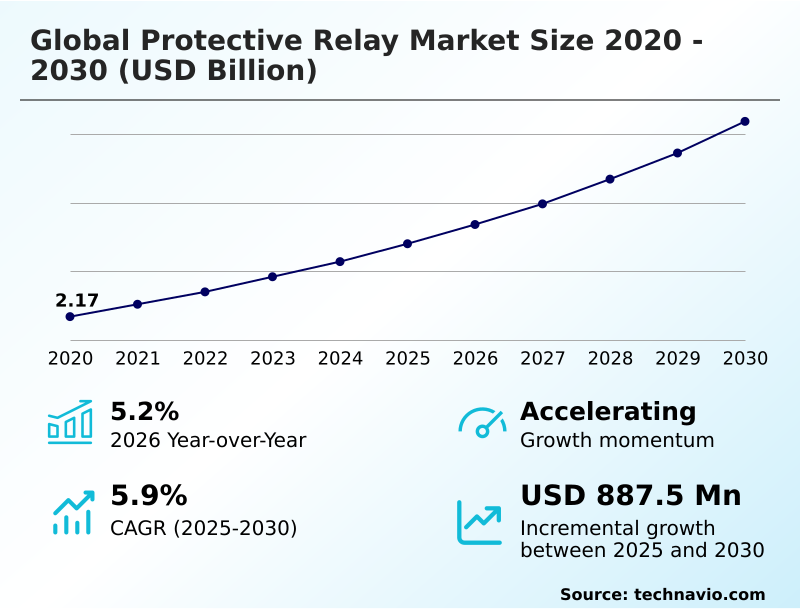
The protective relay market size is valued to increase by USD 887.5 million, at a CAGR of 5.9% from 2025 to 2030. Global transition toward smart grid infrastructure will drive the protective relay market.
Major Market Trends & Insights
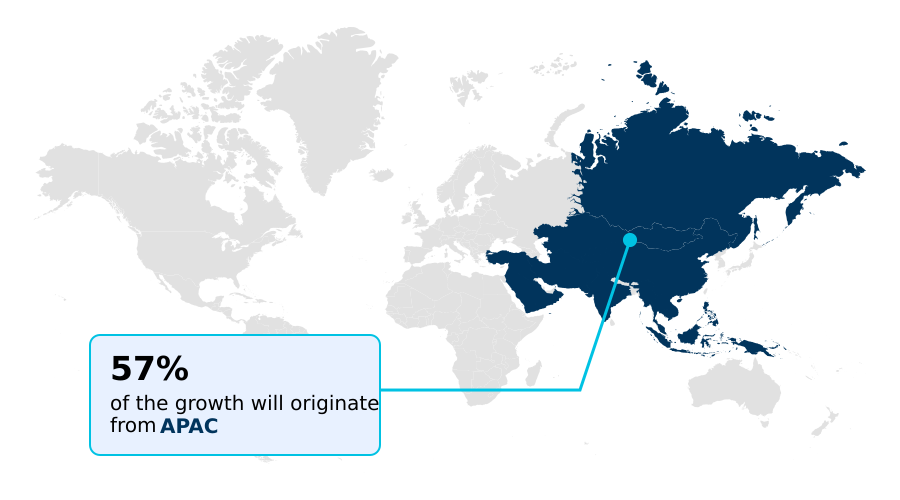
- APAC dominated the market and accounted for a 57% growth during the forecast period.
- By Type - Digital and numeric relay segment was valued at USD 2.34 billion in 2024
- By Application - Feeder segment accounted for the largest market revenue share in 2024
Market Size & Forecast
- Market Opportunities: USD 1.41 billion
- Market Future Opportunities: USD 887.5 million
- CAGR from 2025 to 2030 : 5.9%
Market Summary
- The protective relay market is undergoing a significant transformation, driven by the aggressive modernization of electrical grids and the global shift towards decentralized energy resources. The core of this evolution is the replacement of legacy electromechanical relays with sophisticated microprocessor-based relay systems, which function as intelligent electronic devices.
- These modern units are essential for managing the complexities introduced by renewable energy integration, such as bidirectional power flows and harmonics from inverter-based resources. A primary driver is the need for enhanced grid resilience and the development of self-healing grid capabilities.
- For instance, a utility managing a dense urban network can utilize a numeric relay with advanced digital signal processing to not only provide overcurrent protection but also perform predictive diagnostics on a critical transformer, analyzing real-time data to schedule maintenance before a fault occurs. This capability prevents costly downtime and improves overall system stability.
- However, the integration of these devices is not without challenges, as interoperability issues between equipment from different manufacturers and the need for robust cybersecurity for power grids remain significant concerns for operators.
What will be the Size of the Protective Relay Market during the forecast period?
Get Key Insights on Market Forecast (PDF) Get Free Sample
How is the Protective Relay Market Segmented?
The protective relay industry research report provides comprehensive data (region-wise segment analysis), with forecasts and estimates in "USD million" for the period 2026-2030, as well as historical data from 2020-2024 for the following segments.
- Type
- Digital and numeric relay
- Electromechanical and static relay
- Application
- Feeder
- Transmission line
- Generator
- Motor
- Others
- Variant
- Low voltage
- Medium voltage
- High voltage
- End-user
- Utilities
- Industrial
- Commercial
- Geography
- APAC
- China
- India
- Japan
- North America
- US
- Canada
- Mexico
- Europe
- Germany
- UK
- France
- Middle East and Africa
- Saudi Arabia
- UAE
- South Africa
- South America
- Brazil
- Argentina
- Rest of World (ROW)
- APAC
By Type Insights
The digital and numeric relay segment is estimated to witness significant growth during the forecast period.
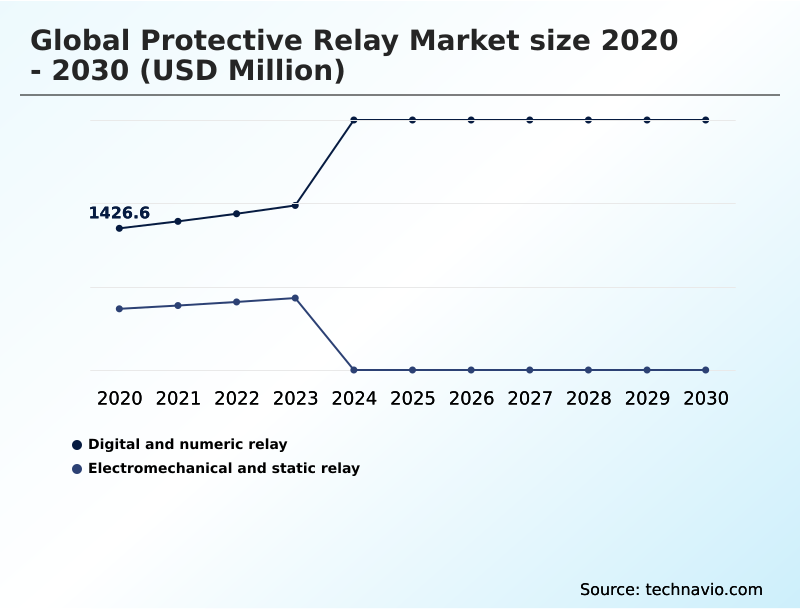
The global protective relay market 2026-2030 is increasingly defined by the transition from electromechanical and static relay systems to digital and numeric relay technology.
This shift is driven by the need for advanced functionalities in substation automation and power distribution architecture.
Digital and numeric relays, leveraging high-speed microprocessors, offer multifunctional capabilities, consolidating overcurrent protection, distance protection, and differential protection into a single intelligent electronic device.
This integration significantly improves secondary system engineering, with some deployments reducing fault analysis time by over 30%.
The adoption of these devices is crucial for managing the complexities of modern electrical grid protection, including the integration of inverter-based resources from renewable energy, which demands precise and rapid fault detection.
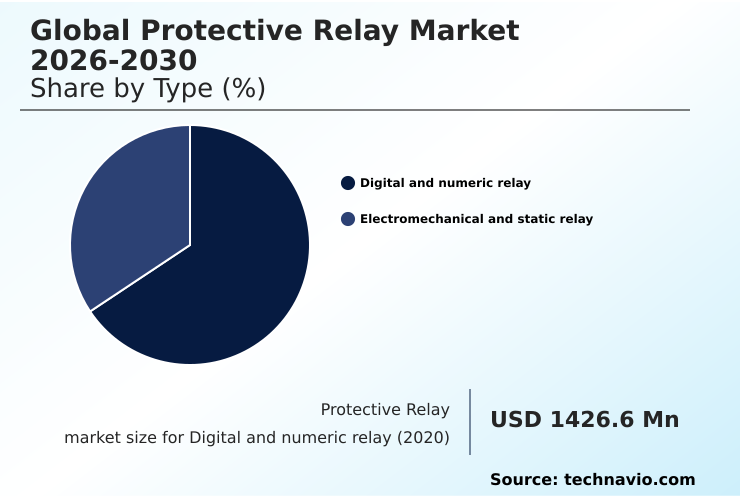
The Digital and numeric relay segment was valued at USD 2.34 billion in 2024 and showed a gradual increase during the forecast period.
Regional Analysis
APAC is estimated to contribute 57% to the growth of the global market during the forecast period.Technavio’s analysts have elaborately explained the regional trends and drivers that shape the market during the forecast period.
See How Protective Relay Market Demand is Rising in APAC Get Free Sample
The geographic landscape of the global protective relay market 2026-2030 is characterized by distinct regional drivers.
In APAC, rapid industrialization and urbanization fuel demand, with countries like China and India focusing on expanding and upgrading their power distribution architecture to support economic growth, contributing to over 57% of the market's incremental growth.
North America and Europe are driven by grid modernization, replacing aging infrastructure and enhancing grid stability management to accommodate renewable energy integration. These mature markets prioritize cybersecurity for power grids and the implementation of advanced fault detection.
The Middle East focuses on protecting critical energy infrastructure and industrial assets, while South America is concentrating on improving electrical system reliability.
Across all regions, the push for a smarter, more resilient grid is universal, with investments in technologies that improve fault isolation efficiency by up to 20%.
Market Dynamics
Our researchers analyzed the data with 2025 as the base year, along with the key drivers, trends, and challenges. A holistic analysis of drivers will help companies refine their marketing strategies to gain a competitive advantage.
- The global protective relay market 2026-2030 is advancing to address complex operational challenges. The demand for a specialized protective relay for solar power generation and a protective relay for wind turbine generators is rising with the clean energy transition.
- In high-voltage applications, the focus is on the digital relay for high voltage substation, which must offer precise distance protection relay for transmission lines. For industrial end-users, the motor protection relay for industrial automation is crucial for process continuity, while arc flash mitigation with protective relays enhances personnel safety.
- Utilities are focused on transformer differential protection relay settings and generator protection against out-of-step conditions to safeguard high-value assets. A key industry effort is improving grid resilience with self-healing relays. The adoption of predictive maintenance using AI in relays is also a significant trend, with some systems offering more than double the diagnostic accuracy of traditional methods.
- However, integrating numeric relays with legacy systems and the challenges in retrofitting electromechanical relays persist. Success requires mastering protective relay testing and commissioning procedures and ensuring effective protective relay coordination in distribution networks.
- Furthermore, the implementation of virtualized protection and control systems, the use of wide-area monitoring using phasor measurement units, and the development of high-impedance fault detection algorithms are becoming standard practice. As deployments grow, so does the importance of cybersecurity standards for IEC 61850 relays and feeder management relay for smart grids, along with robust protection schemes for battery energy storage.
What are the key market drivers leading to the rise in the adoption of Protective Relay Industry?
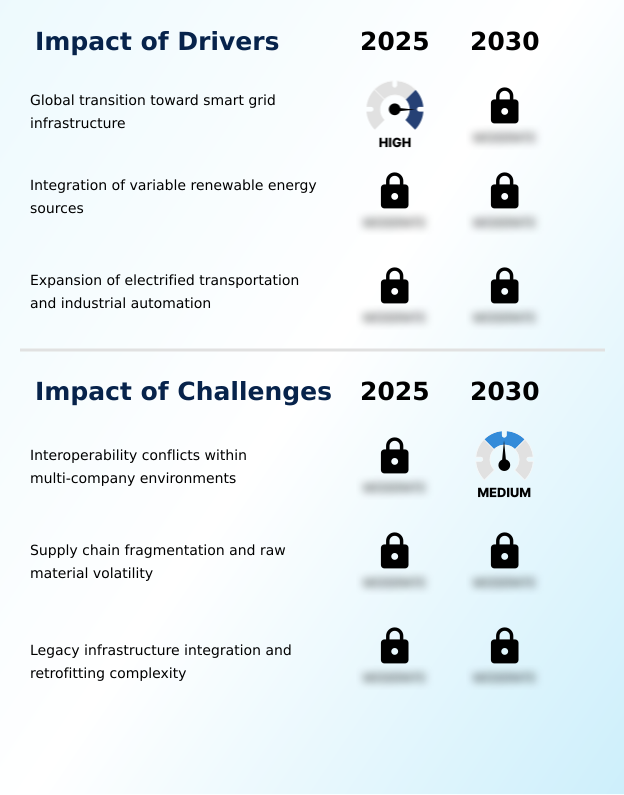
- The global transition toward smart grid infrastructure, aimed at enhancing grid reliability and integrating renewable energy, is a key driver for the protective relay market.
- The primary driver for the global protective relay market 2026-2030 is the global transition toward smart grid infrastructure. This modernization is essential for integrating renewable energy and managing the complexities of a decentralized grid.
- The rise of inverter-based resources necessitates relays that can handle bidirectional power flow and maintain grid stability, a factor driving a nearly 10% annual increase in demand for adaptive protection devices in some regions.
- Concurrently, the expansion of industrial automation and electrified transport creates new demand for high-reliability power.
- Protecting sensitive equipment in smart factories has led to a 15% rise in the adoption of advanced motor protection relays that can mitigate even minor power quality issues, safeguarding productivity and preventing costly downtime.
What are the market trends shaping the Protective Relay Industry?
- A key market trend is the adoption of virtualized protection and control systems, where logic traditionally housed in physical relays is migrated to centralized substation servers for enhanced flexibility.
- Key trends are reshaping the global protective relay market 2026-2030, led by the adoption of virtualized protection and the integration of artificial intelligence for predictive diagnostics. The move toward a centralized protection system allows utilities to consolidate functions, reducing physical footprints in control house layouts and cutting hardware costs by up to 20%.
- AI-driven asset health monitoring enables a shift to condition-based maintenance, with some systems accurately predicting equipment failure precursors 75% more effectively than time-based schedules. Furthermore, the development of robust cybersecurity standards is critical as operational technology security becomes a primary concern.
- Implementing advanced electrical safety systems and security protocols is now a key differentiator, ensuring the integrity of power generation control against emerging threats and enhancing overall power system stability.
What challenges does the Protective Relay Industry face during its growth?
- Interoperability conflicts within multi-vendor environments, stemming from proprietary protocols and varied standards implementation, present a key challenge to seamless grid modernization.
- A significant challenge facing the global protective relay market 2026-2030 is achieving seamless interoperability in multi-vendor environments. Integrating modern intelligent electronic devices with legacy systems often results in conflicts, with engineering teams spending up to 30% of project time on custom configuration and testing.
- The persistence of older communication protocols alongside IEC 61850 creates integration friction, particularly when executing complex Goose messaging or managing sampled values. This issue is compounded by a shortage of specialized engineers, which can delay project timelines by an average of 15%.
- Supply chain volatility for critical components like semiconductors and microprocessors further complicates matters, creating pricing pressures and extending lead times for essential grid modernization efforts.
Exclusive Technavio Analysis on Customer Landscape
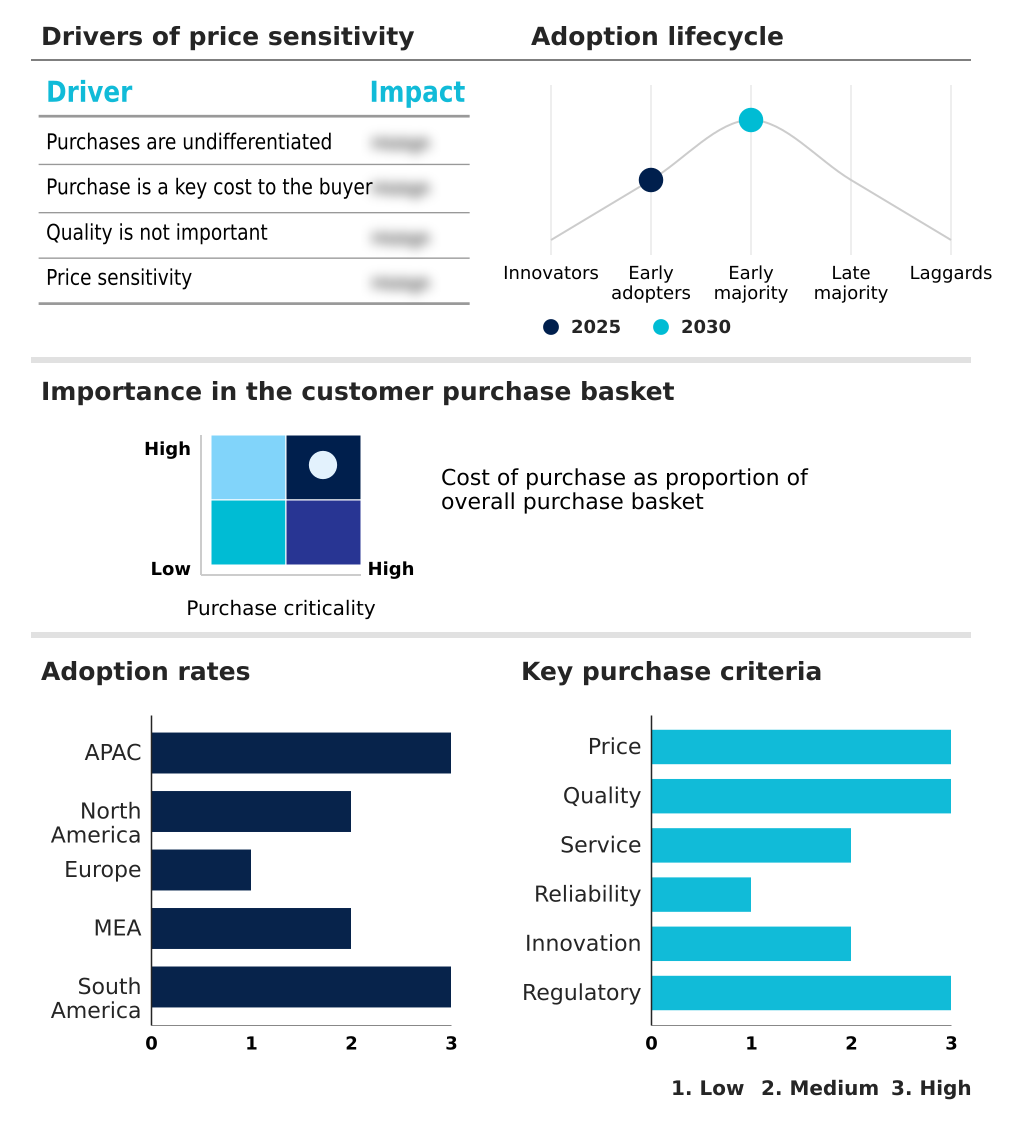
The protective relay market forecasting report includes the adoption lifecycle of the market, covering from the innovator’s stage to the laggard’s stage. It focuses on adoption rates in different regions based on penetration. Furthermore, the protective relay market report also includes key purchase criteria and drivers of price sensitivity to help companies evaluate and develop their market growth analysis strategies.
Customer Landscape of Protective Relay Industry
Competitive Landscape
Companies are implementing various strategies, such as strategic alliances, protective relay market forecast, partnerships, mergers and acquisitions, geographical expansion, and product/service launches, to enhance their presence in the industry.
ABB Ltd. - Offers advanced protective relays for critical feeder, transformer, and motor protection applications, focusing on enhanced system reliability and operational safety.
The industry research and growth report includes detailed analyses of the competitive landscape of the market and information about key companies, including:
- ABB Ltd.
- Eaton Corp. Plc
- Fanox Electronic SL
- Fuji Electric Co. Ltd.
- GE Vernova Inc.
- Hitachi Energy Ltd.
- Hubbell Inc.
- Littelfuse Inc.
- Microelettrica Scientifica SpA
- Mitsubishi Electric Corp.
- Orion Italia Srl
- P and B Weir Electrical Ltd
- Rockwell Automation Inc.
- Schneider Electric SE
- Schweitzer Engineering
- Siemens AG
- TE Connectivity plc
- Toshiba Corp.
- Woodward Inc.
- ZIV Automation
Qualitative and quantitative analysis of companies has been conducted to help clients understand the wider business environment as well as the strengths and weaknesses of key industry players. Data is qualitatively analyzed to categorize companies as pure play, category-focused, industry-focused, and diversified; it is quantitatively analyzed to categorize companies as dominant, leading, strong, tentative, and weak.
Recent Development and News in Protective relay market
- In January 2025, ABB Ltd. initiated a transition in its power supply portfolio by announcing its legacy three-phase product line would enter a limited life cycle to accommodate the new CP-S.3 range with enhanced protection.
- In February 2025, GE Vernova Inc. launched a grid-forming relay platform in the United States, providing advanced protection for inverter-based resources like large-scale wind and solar farms.
- In April 2025, Siemens AG deployed its latest SIPROTEC 5 ecosystem enhancements, including an updated web user interface and digital twin technology, allowing engineers to test protection schemes in a cloud-based environment before deployment.
- In July 2025, Schneider Electric SE announced a partnership with regional utility providers to deploy a new range of protective relays featuring enhanced cybersecurity protocols to safeguard critical infrastructure.
Dive into Technavio’s robust research methodology, blending expert interviews, extensive data synthesis, and validated models for unparalleled Protective Relay Market insights. See full methodology.
| Market Scope | |
|---|---|
| Page number | 323 |
| Base year | 2025 |
| Historic period | 2020-2024 |
| Forecast period | 2026-2030 |
| Growth momentum & CAGR | Accelerate at a CAGR of 5.9% |
| Market growth 2026-2030 | USD 887.5 million |
| Market structure | Fragmented |
| YoY growth 2025-2026(%) | 5.2% |
| Key countries | China, India, Japan, South Korea, Australia, Indonesia, US, Canada, Mexico, Germany, UK, France, Italy, Spain, The Netherlands, Saudi Arabia, UAE, South Africa, Turkey, Israel, Brazil, Argentina and Chile |
| Competitive landscape | Leading Companies, Market Positioning of Companies, Competitive Strategies, and Industry Risks |
Research Analyst Overview
- The global protective relay market 2026-2030 is defined by the technological shift from the legacy electromechanical relay to the microprocessor-based relay. This grid modernization is essential for electrical grid protection. Modern intelligent electronic devices utilize advanced digital signal processing for superior fault detection, forming the basis of a self-healing grid.
- Key applications such as feeder protection relay, transmission line protection, generator protection relay, and motor protection relay now depend on the precision of a numeric relay. For high-value assets, a dedicated busbar protection scheme and transformer protection are critical. Core functionalities, including overcurrent protection, differential protection, distance protection, and frequency protection, are now integrated.
- The widespread adoption of the IEC 61850 standard is central to substation automation, enabling technologies like arc-flash protection, traveling wave fault location, and the use of phasor measurement units within wide-area monitoring systems. The implementation requires expertise in secondary system engineering and handling protocols like goose messaging and sampled values to upgrade secondary wiring.
- A key boardroom focus is resilience, with advanced systems improving detection of a high-impedance fault and providing robust voltage protection relay functions, reducing outage risks by a significant margin compared to older infrastructure. This transition toward virtualized protection is pivotal for future energy networks.
What are the Key Data Covered in this Protective Relay Market Research and Growth Report?
-
What is the expected growth of the Protective Relay Market between 2026 and 2030?
-
USD 887.5 million, at a CAGR of 5.9%
-
-
What segmentation does the market report cover?
-
The report is segmented by Type (Digital and numeric relay, and Electromechanical and static relay), Application (Feeder, Transmission line, Generator, Motor, and Others), Variant (Low voltage, Medium voltage, and High voltage), End-user (Utilities, Industrial, and Commercial) and Geography (APAC, North America, Europe, Middle East and Africa, South America)
-
-
Which regions are analyzed in the report?
-
APAC, North America, Europe, Middle East and Africa and South America
-
-
What are the key growth drivers and market challenges?
-
Global transition toward smart grid infrastructure, Interoperability conflicts within multi-company environments
-
-
Who are the major players in the Protective Relay Market?
-
ABB Ltd., Eaton Corp. Plc, Fanox Electronic SL, Fuji Electric Co. Ltd., GE Vernova Inc., Hitachi Energy Ltd., Hubbell Inc., Littelfuse Inc., Microelettrica Scientifica SpA, Mitsubishi Electric Corp., Orion Italia Srl, P and B Weir Electrical Ltd, Rockwell Automation Inc., Schneider Electric SE, Schweitzer Engineering, Siemens AG, TE Connectivity plc, Toshiba Corp., Woodward Inc. and ZIV Automation
-
Market Research Insights
- Market dynamics are shaped by a strategic pivot towards intelligent infrastructure, where investments in advanced metering infrastructure and digital substation technology are showing tangible returns. For example, utilities leveraging real-time data acquisition from modern relays report up to a 15% reduction in outage durations compared to systems without such capabilities.
- The implementation of robust operational technology security and comprehensive power quality monitoring is no longer optional, with facilities adopting these measures seeing a 10% decrease in equipment-related failures. This focus on electrical system reliability is critical as industrial automation protection becomes more complex.
- As a result, the market is demonstrating steady growth, with adoption rates for automated reclosing logic in new installations increasing by over 5% annually, directly impacting service continuity and customer satisfaction metrics.
We can help! Our analysts can customize this protective relay market research report to meet your requirements.
 RIA -
RIA - 
