Pup Joint Market Analysis, Size, and Forecast 2026-2030: North America (US, Canada, and Mexico), Middle East and Africa (Saudi Arabia, UAE, and South Africa), APAC (China, India, and Japan), Europe (Germany, UK, and France), South America (Brazil, Argentina, and Colombia), and Rest of World (ROW)

Pup Joint Market Analysis, Size, and Forecast 2026-2030:
North America (US, Canada, and Mexico), Middle East and Africa (Saudi Arabia, UAE, and South Africa), APAC (China, India, and Japan), Europe (Germany, UK, and France), South America (Brazil, Argentina, and Colombia), and Rest of World (ROW)

Published: Dec 2025 301 Pages SKU: IRTNTR81173

Market Overview at a Glance

$226.6 Mn
Market Opportunity
6.2%
CAGR 2025 - 2030
32.3%
North America Growth
$
Hot Rolled segment 2024

Pup Joint Market Size 2026-2030

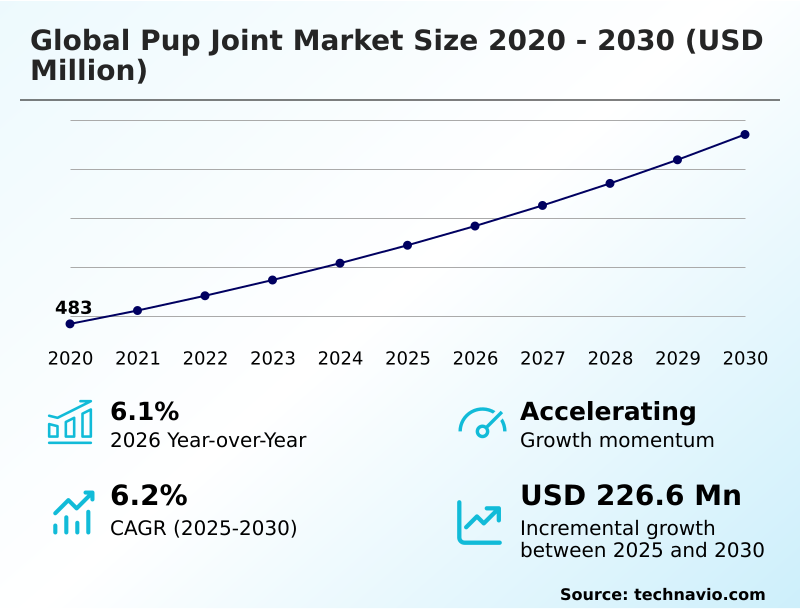
The pup joint market size is valued to increase by USD 226.6 million, at a CAGR of 6.2% from 2025 to 2030. Increasing oil and gas exploration and production activities will drive the pup joint market.

Major Market Trends & Insights

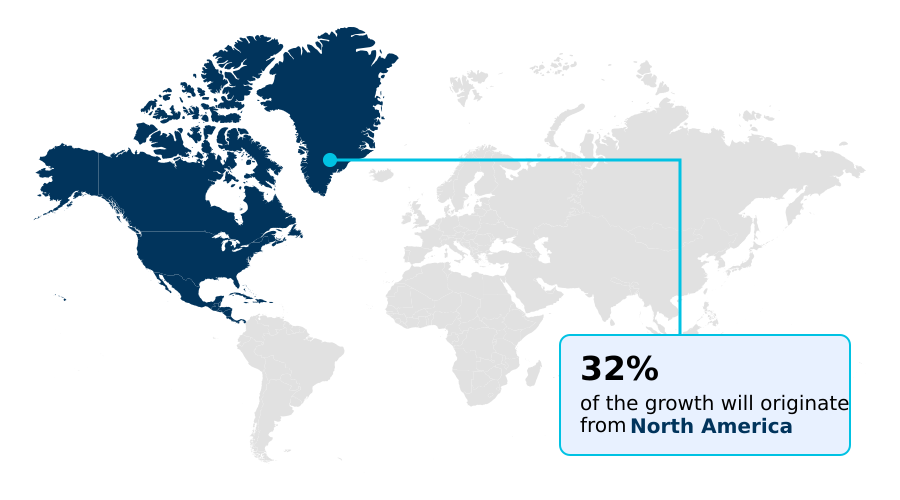
  • North America dominated the market and accounted for a 32.3% growth during the forecast period.
  • By Technology - Hot Rolled segment was valued at in 2024
  • By Application - Oil and gas segment accounted for the largest market revenue share in 2024

Market Size & Forecast

  • Market Opportunities: USD 387.4 million
  • Market Future Opportunities: USD 226.6 million
  • CAGR from 2025 to 2030 : 6.2%

Market Summary

  • The pup joint market is integral to the efficiency and safety of the oil and gas sector. These non-standard length tubulars are essential for the precise construction of drill and production strings, enabling operators to achieve exact depth requirements for downhole equipment.
  • Growth is underpinned by relentless deepwater exploration and the industrial-scale development of unconventional resources, which demand sophisticated well completion operations and high-integrity components. For instance, in a complex horizontal drilling campaign, achieving optimal spacing for hydraulic fracturing stages relies on the accurate placement of packers and sleeves, a task facilitated by a specific sequence of pup joints.
  • This precision directly impacts reservoir contact and production outcomes. Concurrently, the industry is navigating the challenge of volatile raw material pricing while embracing technological advancements in materials science, such as high-strength alloys and corrosion-resistant coatings. These innovations are critical for extending component life in high-pressure, high-temperature (HPHT) environments, ensuring the market's alignment with the industry's evolving technical demands.
  • The market's trajectory is therefore a balance of robust upstream activity, infrastructural expansion, and continuous product innovation to meet increasingly rigorous operational standards.

What will be the Size of the Pup Joint Market during the forecast period?

Get Key Insights on Market Forecast (PDF) Request Free Sample

How is the Pup Joint Market Segmented?

The pup joint industry research report provides comprehensive data (region-wise segment analysis), with forecasts and estimates in "USD million" for the period 2026-2030, as well as historical data from 2020-2024 for the following segments.

  • Technology
    • Hot rolled
    • Cold rolled
  • Application
    • Oil and gas
    • Chemical industry
    • Mining
    • Construction
    • Others
  • Type
    • Tubing pup joint
    • Drill pipe pup joint
    • Crossover pup joint
    • Casing pup joint
  • Geography
    • North America
      • US
      • Canada
      • Mexico
    • Middle East and Africa
      • Saudi Arabia
      • UAE
      • South Africa
    • APAC
      • China
      • India
      • Japan
    • Europe
      • Germany
      • UK
      • France
    • South America
      • Brazil
      • Argentina
      • Colombia
    • Rest of World (ROW)

By Technology Insights

The hot rolled segment is estimated to witness significant growth during the forecast period.

The hot rolled segment is foundational to the pup joint market, valued for its cost efficiency and mechanical resilience in many oil and gas applications.

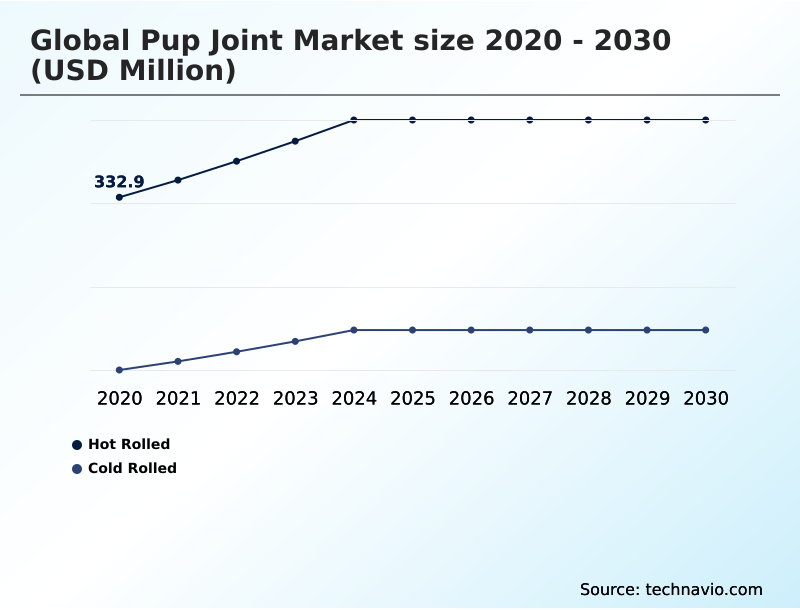
The manufacturing process, which involves shaping steel above its recrystallization temperature, yields products with high tensile strength and ductility. This makes hot rolled steel ideal for downhole environments where impact resistance is critical.

These components are integral to building casing and tubing strings, supporting overall wellbore integrity during upstream exploration and production. While the process results in less precise dimensional tolerances compared to cold rolling, its economic advantage is a significant factor.

The inherent toughness of the material, which can enhance impact resistance by up to 15% in certain applications, ensures sustained demand for drilling and completion operations, promoting greater operational efficiency.

Request Free Sample

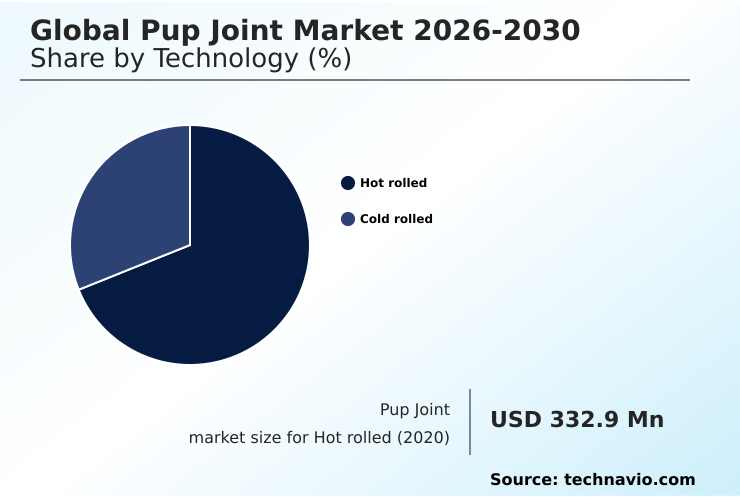
The Hot rolled segment was valued at in 2024 and showed a gradual increase during the forecast period.

Request Free Sample

Regional Analysis

North America is estimated to contribute 32.3% to the growth of the global market during the forecast period.Technavio’s analysts have elaborately explained the regional trends and drivers that shape the market during the forecast period.

See How Pup Joint Market Demand is Rising in North America Request Free Sample

The geographic landscape of the pup joint market is dominated by regions with intensive upstream activity, with North America, the Middle East, and APAC being key centers of demand.

North America leads, accounting for over 32% of the market opportunity, driven by relentless hydraulic fracturing operations and deepwater projects.

In these areas, the use of precision-machined drill pipe components has contributed to drilling efficiency gains, reducing well completion times by up to 20%.

The Middle East is characterized by large-scale, long-term investments in both conventional and unconventional gas fields, requiring a steady supply of oil country tubular goods (OCTG) for its energy infrastructure expansion.

Meanwhile, the APAC region is a significant growth frontier, where deepwater exploration and a focus on energy security are fueling investments in subsea well construction and pipeline network construction.

Market Dynamics

Our researchers analyzed the data with 2025 as the base year, along with the key drivers, trends, and challenges. A holistic analysis of drivers will help companies refine their marketing strategies to gain a competitive advantage.

  • Strategic decision-making in the pup joint market hinges on a granular understanding of technical requirements and operational contexts. The pup joint selection for HPPT wells, for example, is a critical process where engineering teams must balance cost with performance, as the material specifications for sour gas pup joints differ significantly from those for standard service.
  • Innovations in pup joint material science are providing new options, with corrosion-resistant alloys for pup joints becoming a key focus for extending asset life in harsh environments. The pup joint role in managed pressure drilling is also expanding, demanding higher-grade components. The debate over hot rolled vs.
  • cold rolled pup joint performance continues, with the choice depending on the specific application, whether it is for geothermal drilling or unconventional plays. In modern operations, using pup joints for downhole tool spacing is a fundamental aspect of optimizing well completions.
  • The impact of pup joints on operational efficiency is significant; firms that optimize their supply chain for high-strength pup joints report component failure rates that are two-thirds lower than industry averages. As the industry moves toward digitalization, integrating smart pup joints in digital oilfields is the next frontier, promising real-time data on string integrity.
  • This complexity underscores the importance of a nuanced approach, from understanding premium threaded pup joint applications to mastering the use of casing pup joints for wellbore integrity in deepwater completion design.

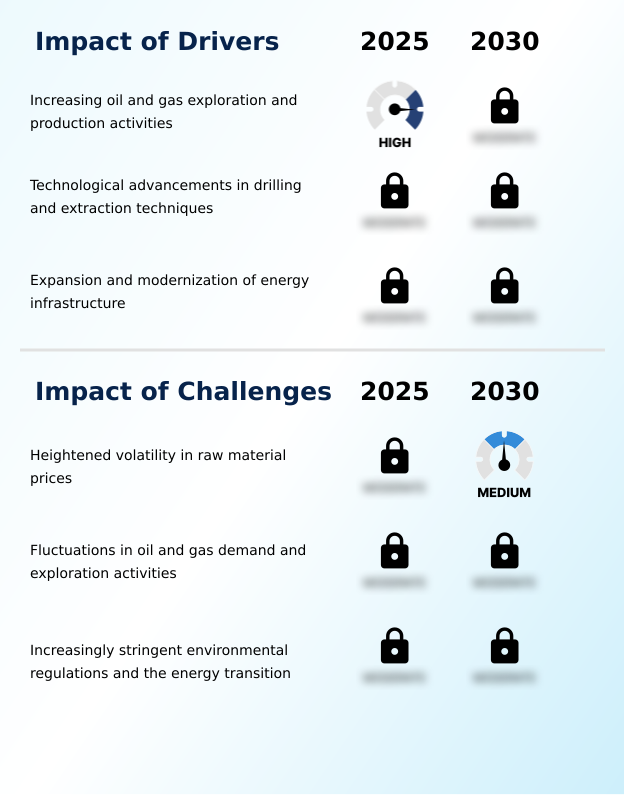
What are the key market drivers leading to the rise in the adoption of Pup Joint Industry?

  • The market is fundamentally driven by the sustained level of global oil and gas exploration and production activities.

  • Market growth is fundamentally propelled by increasing oil and gas sector investment and the corresponding expansion of energy infrastructure. Sustained upstream exploration and production activities, especially in deepwater and unconventional fields, directly fuel demand.
  • As drilling programs become more ambitious, projects now require tubulars rated for 20% higher pressures, driving a 10% increase in demand for premium grade tubulars.
  • This necessity for high-performance oil country tubular goods (OCTG) and casing and tubing strings is a direct result of the industry's need to access more complex reservoirs.
  • Furthermore, the global build-out of pipeline networks requires vast quantities of components for precise connections, supporting the market's expansion across the entire energy value chain. The investment in drilling and extraction technologies underpins the consistent need for these critical components.

What are the market trends shaping the Pup Joint Industry?

  • The market is shaped by surging demand from the expansion of unconventional resource plays and deepwater drilling operations.

  • Key trends are being dictated by the industry's push into more challenging frontiers, particularly unconventional drilling and deepwater exploration. These environments, characterized by extreme downhole conditions, are fueling the demand for high-strength alloys and corrosion-resistant materials. The complexity of these operations can increase drilling program requirements by over 25%, making wellbore integrity a paramount concern.
  • Consequently, the use of advanced drill pipe components and seamless tubular products is no longer optional but essential. Proper selection and deployment of these specialized parts for downhole tool adjustment can improve string integrity by 15%, ensuring safer and more reliable production.
  • This trend is driving innovation in manufacturing, with a focus on producing components that meet stringent performance standards for sour gas service and other demanding applications.

What challenges does the Pup Joint Industry face during its growth?

  • A key challenge restraining market growth is the heightened volatility in the prices of essential raw materials.

  • The primary challenge facing the market is the inherent volatility of the global oil and gas industry, coupled with supply chain pressures. Fluctuations in raw material costs, particularly for high-grade steel, have been shown to impact production costs by as much as 18%, creating significant margin pressure for manufacturers. This uncertainty complicates financial planning for both suppliers and end-users.
  • Additionally, increasingly strict environmental regulations and the push for non-productive time reduction are forcing operators to invest in higher-specification equipment. Complying with new standards can increase operational overhead by 5-8%. Navigating this environment requires a focus on operational efficiency and the adoption of well intervention techniques and tubular running services that optimize resource use while ensuring well integrity assurance.

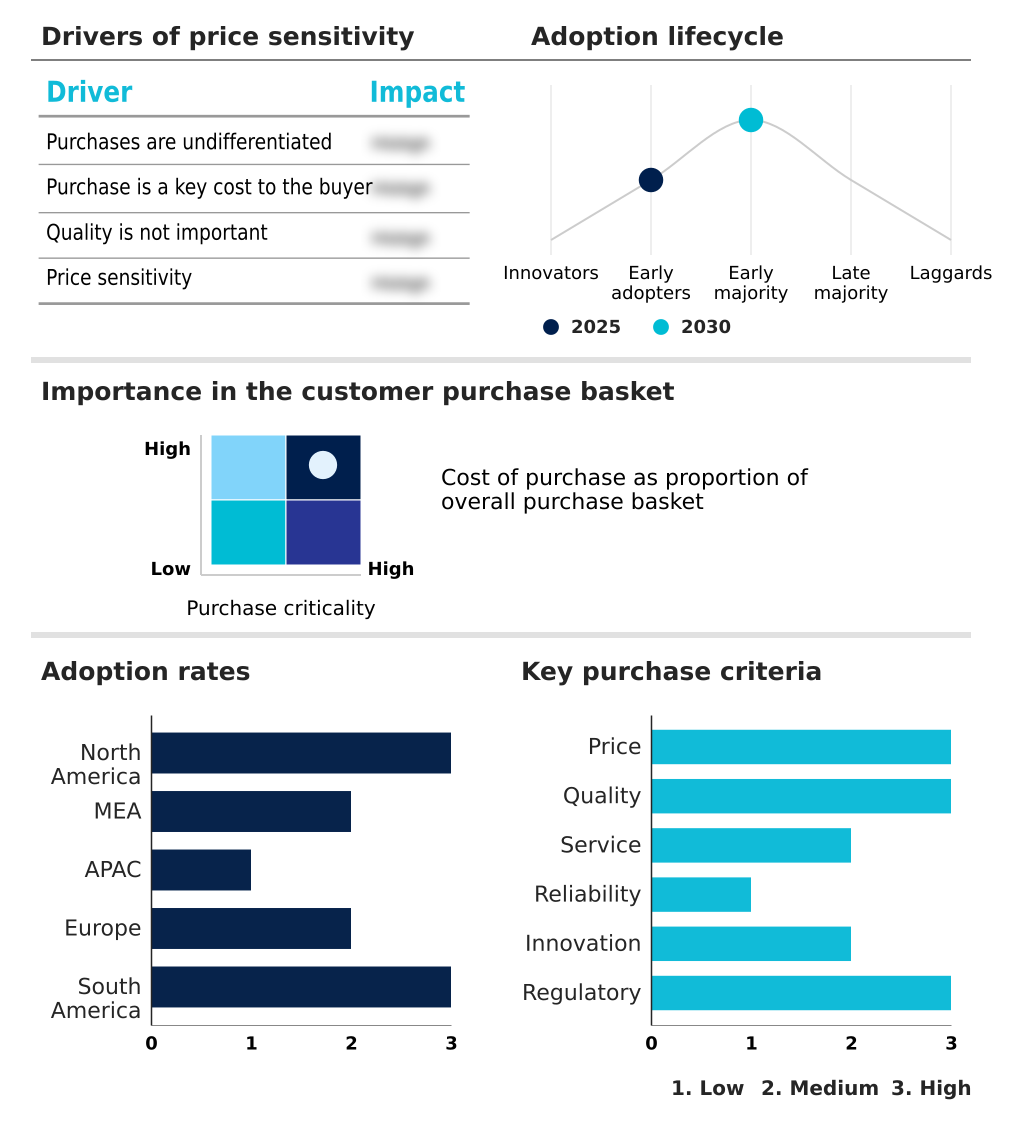
Exclusive Technavio Analysis on Customer Landscape

The pup joint market forecasting report includes the adoption lifecycle of the market, covering from the innovator’s stage to the laggard’s stage. It focuses on adoption rates in different regions based on penetration. Furthermore, the pup joint market report also includes key purchase criteria and drivers of price sensitivity to help companies evaluate and develop their market growth analysis strategies.

Customer Landscape of Pup Joint Industry

Competitive Landscape

Companies are implementing various strategies, such as strategic alliances, pup joint market forecast, partnerships, mergers and acquisitions, geographical expansion, and product/service launches, to enhance their presence in the industry.

ASC Engineered Solutions - Providing API-compliant tubing pup joints with advanced external coatings, engineered for diverse downhole applications and enhanced material integrity.

The industry research and growth report includes detailed analyses of the competitive landscape of the market and information about key companies, including:

  • ASC Engineered Solutions
  • AZZ Inc.
  • Baker Hughes Co.
  • Forum Energy Technologies Inc.
  • Mid-Continent Equipment Group Pte Ltd.
  • NOV Inc.
  • Oil Country Tubular Ltd.
  • Schlumberger Ltd.
  • Sledgehammer Oil Tools Pvt. Ltd.
  • Stewart Tubular Products LLC
  • Tejas Tebular Products Inc.
  • Tenaris SA
  • Texas Pipe Works Inc.
  • TPS Technitube Rohrenwerke GmbH
  • Vallourec SA
  • Weatherford International Plc
  • Weijia Petroleum
  • WestCan Oilfield Supply Ltd.

Qualitative and quantitative analysis of companies has been conducted to help clients understand the wider business environment as well as the strengths and weaknesses of key industry players. Data is qualitatively analyzed to categorize companies as pure play, category-focused, industry-focused, and diversified; it is quantitatively analyzed to categorize companies as dominant, leading, strong, tentative, and weak.

Recent Development and News in Pup joint market

  • In August 2024, Chevron announced the commencement of oil and natural gas production from the Anchor project in the deepwater U.S. Gulf of Mexico, a development notable for its use of high-pressure technology rated to 20,000 psi.
  • In September 2024, DCL Technology Group announced the development of a new Houston facility to expand its production of clean energy and emissions reduction technologies.
  • In November 2024, Sunlit Chemical inaugurated its first U.S. manufacturing facility, a $100 million, 900,000-square-foot plant in Phoenix, Arizona, to supply the semiconductor industry.
  • In May 2025, a report noted a significant surge in capital deployment into the global water sector, with 72% of organizations expecting to increase their investment to improve water and wastewater infrastructure.

Dive into Technavio’s robust research methodology, blending expert interviews, extensive data synthesis, and validated models for unparalleled Pup Joint Market insights. See full methodology.

Market Scope
Page number 301
Base year 2025
Historic period 2020-2024
Forecast period 2026-2030
Growth momentum & CAGR Accelerate at a CAGR of 6.2%
Market growth 2026-2030 USD 226.6 million
Market structure Fragmented
YoY growth 2025-2026(%) 6.1%
Key countries US, Canada, Mexico, Saudi Arabia, UAE, South Africa, Turkey, Israel, China, India, Japan, Australia, South Korea, Indonesia, Germany, UK, France, Italy, Spain, The Netherlands, Brazil, Argentina and Colombia
Competitive landscape Leading Companies, Market Positioning of Companies, Competitive Strategies, and Industry Risks

Request Free Sample

Research Analyst Overview

  • The pup joint market is defined by a dynamic interplay between technological advancement and rigorous operational demands. Its evolution is evident in the shift toward high-strength alloys and corrosion-resistant materials, which are becoming standard for deepwater exploration and high-pressure, high-temperature (HPPT) fields. The use of these advanced materials extends component lifecycles by over 40% in harsh downhole environments.
  • For boardroom consideration, this trend directly impacts capital expenditure planning, favoring investments in premium, durable components to ensure long-term wellbore integrity and mitigate operational risks. The market's core function remains the precise downhole equipment spacing and adjustment of casing and tubing strings, a necessity in both conventional and unconventional drilling.
  • Innovations in precision machining and proprietary thread designs are key differentiators, enhancing the reliability of oil country tubular goods (OCTG).
  • The expansion into sour gas service and complex well completion operations, facilitated by managed pressure drilling and hydraulic fracturing, continues to fuel demand for specialized drill pipe components and production tubing strings, underpinning the market's critical role in global energy extraction.

What are the Key Data Covered in this Pup Joint Market Research and Growth Report?

  • What is the expected growth of the Pup Joint Market between 2026 and 2030?

    • USD 226.6 million, at a CAGR of 6.2%

  • What segmentation does the market report cover?

    • The report is segmented by Technology (Hot Rolled, and Cold Rolled), Application (Oil and gas, Chemical industry, Mining, Construction, and Others), Type (Tubing pup joint, Drill pipe pup joint, Crossover pup joint, and Casing pup joint ) and Geography (North America, Middle East and Africa, APAC, Europe, South America)

  • Which regions are analyzed in the report?

    • North America, Middle East and Africa, APAC, Europe and South America

  • What are the key growth drivers and market challenges?

    • Increasing oil and gas exploration and production activities, Heightened volatility in raw material prices

  • Who are the major players in the Pup Joint Market?

    • ASC Engineered Solutions, AZZ Inc., Baker Hughes Co., Forum Energy Technologies Inc., Mid-Continent Equipment Group Pte Ltd., NOV Inc., Oil Country Tubular Ltd., Schlumberger Ltd., Sledgehammer Oil Tools Pvt. Ltd., Stewart Tubular Products LLC, Tejas Tebular Products Inc., Tenaris SA, Texas Pipe Works Inc., TPS Technitube Rohrenwerke GmbH, Vallourec SA, Weatherford International Plc, Weijia Petroleum and WestCan Oilfield Supply Ltd.

Market Research Insights

  • Market dynamics are increasingly shaped by the pursuit of enhanced operational efficiency and asset longevity. The adoption of premium grade tubulars for string length adjustment in complex wellbores is directly linked to non-productive time reduction, with some operations reporting efficiency gains of over 12%.
  • As operators push the boundaries of extended reach drilling, the need for precise downhole tool adjustment intensifies. Utilizing advanced components for casing string alignment can improve placement accuracy by up to 15% in deepwater well designs. This focus on performance minimizes costly interventions and supports well integrity assurance.
  • The strategic use of pup joints in bottom hole assembly (BHA) configurations is pivotal, enabling more flexible and cost-effective drilling campaigns that contribute to longer asset life and improved returns on investment.

We can help! Our analysts can customize this pup joint market research report to meet your requirements.

Get in touch

1. Executive Summary

1.1 Market overview

Executive Summary - Chart on Market Overview
Executive Summary - Data Table on Market Overview
Executive Summary - Chart on Global Market Characteristics
Executive Summary - Chart on Market by Geography
Executive Summary - Chart on Market Segmentation by Technology
Executive Summary - Chart on Market Segmentation by Application
Executive Summary - Chart on Market Segmentation by Type
Executive Summary - Chart on Incremental Growth
Executive Summary - Data Table on Incremental Growth
Executive Summary - Chart on Company Market Positioning

2. Technavio Analysis

2.1 Analysis of price sensitivity, lifecycle, customer purchase basket, adoption rates, and purchase criteria

2.2 Criticality of inputs and Factors of differentiation

Chart on Overview on criticality of inputs and factors of differentiation

2.3 Factors of disruption

Chart on Overview on factors of disruption

2.4 Impact of drivers and challenges

Chart on Impact of drivers and challenges in 2025 and 2030

3. Market Landscape

3.1 Market ecosystem

Chart on Parent Market
Data Table on - Parent Market

3.2 Market characteristics

Chart on Market characteristics analysis

3.3 Value chain analysis

Chart on Value chain analysis

4. Market Sizing

4.1 Market definition

Data Table on Offerings of companies included in the market definition

4.2 Market segment analysis

Market segments

4.3 Market size 2025

4.4 Market outlook: Forecast for 2025-2030

Chart on Global - Market size and forecast 2025-2030 ($ million)
Data Table on Global - Market size and forecast 2025-2030 ($ million)
Chart on Global Market: Year-over-year growth 2025-2030 (%)
Data Table on Global Market: Year-over-year growth 2025-2030 (%)

5. Historic Market Size

5.1 Global Pup Joint Market 2020 - 2024

Historic Market Size - Data Table on Global Pup Joint Market 2020 - 2024 ($ million)

5.2 Technology segment analysis 2020 - 2024

Historic Market Size - Technology Segment 2020 - 2024 ($ million)

5.3 Application segment analysis 2020 - 2024

Historic Market Size - Application Segment 2020 - 2024 ($ million)

5.4 Type segment analysis 2020 - 2024

Historic Market Size - Type Segment 2020 - 2024 ($ million)

5.5 Geography segment analysis 2020 - 2024

Historic Market Size - Geography Segment 2020 - 2024 ($ million)

5.6 Country segment analysis 2020 - 2024

Historic Market Size - Country Segment 2020 - 2024 ($ million)

6. Qualitative Analysis

6.1 The AI impact on Global Pup Joint Market

7. Five Forces Analysis

7.1 Five forces summary

Five forces analysis - Comparison between 2025 and 2030

7.2 Bargaining power of buyers

Bargaining power of buyers - Impact of key factors 2025 and 2030

7.3 Bargaining power of suppliers

Bargaining power of suppliers - Impact of key factors in 2025 and 2030

7.4 Threat of new entrants

Threat of new entrants - Impact of key factors in 2025 and 2030

7.5 Threat of substitutes

Threat of substitutes - Impact of key factors in 2025 and 2030

7.6 Threat of rivalry

Threat of rivalry - Impact of key factors in 2025 and 2030

7.7 Market condition

Chart on Market condition - Five forces 2025 and 2030

8. Market Segmentation by Technology

8.1 Market segments

Chart on Technology - Market share 2025-2030 (%)
Data Table on Technology - Market share 2025-2030 (%)

8.2 Comparison by Technology

Chart on Comparison by Technology
Data Table on Comparison by Technology

8.3 Hot rolled - Market size and forecast 2025-2030

Chart on Hot rolled - Market size and forecast 2025-2030 ($ million)
Data Table on Hot rolled - Market size and forecast 2025-2030 ($ million)
Chart on Hot rolled - Year-over-year growth 2025-2030 (%)
Data Table on Hot rolled - Year-over-year growth 2025-2030 (%)

8.4 Cold rolled - Market size and forecast 2025-2030

Chart on Cold rolled - Market size and forecast 2025-2030 ($ million)
Data Table on Cold rolled - Market size and forecast 2025-2030 ($ million)
Chart on Cold rolled - Year-over-year growth 2025-2030 (%)
Data Table on Cold rolled - Year-over-year growth 2025-2030 (%)

8.5 Market opportunity by Technology

Market opportunity by Technology ($ million)
Data Table on Market opportunity by Technology ($ million)

9. Market Segmentation by Application

9.1 Market segments

Chart on Application - Market share 2025-2030 (%)
Data Table on Application - Market share 2025-2030 (%)

9.2 Comparison by Application

Chart on Comparison by Application
Data Table on Comparison by Application

9.3 Oil and gas - Market size and forecast 2025-2030

Chart on Oil and gas - Market size and forecast 2025-2030 ($ million)
Data Table on Oil and gas - Market size and forecast 2025-2030 ($ million)
Chart on Oil and gas - Year-over-year growth 2025-2030 (%)
Data Table on Oil and gas - Year-over-year growth 2025-2030 (%)

9.4 Chemical industry - Market size and forecast 2025-2030

Chart on Chemical industry - Market size and forecast 2025-2030 ($ million)
Data Table on Chemical industry - Market size and forecast 2025-2030 ($ million)
Chart on Chemical industry - Year-over-year growth 2025-2030 (%)
Data Table on Chemical industry - Year-over-year growth 2025-2030 (%)

9.5 Mining - Market size and forecast 2025-2030

Chart on Mining - Market size and forecast 2025-2030 ($ million)
Data Table on Mining - Market size and forecast 2025-2030 ($ million)
Chart on Mining - Year-over-year growth 2025-2030 (%)
Data Table on Mining - Year-over-year growth 2025-2030 (%)

9.6 Construction - Market size and forecast 2025-2030

Chart on Construction - Market size and forecast 2025-2030 ($ million)
Data Table on Construction - Market size and forecast 2025-2030 ($ million)
Chart on Construction - Year-over-year growth 2025-2030 (%)
Data Table on Construction - Year-over-year growth 2025-2030 (%)

9.7 Others - Market size and forecast 2025-2030

Chart on Others - Market size and forecast 2025-2030 ($ million)
Data Table on Others - Market size and forecast 2025-2030 ($ million)
Chart on Others - Year-over-year growth 2025-2030 (%)
Data Table on Others - Year-over-year growth 2025-2030 (%)

9.8 Market opportunity by Application

Market opportunity by Application ($ million)
Data Table on Market opportunity by Application ($ million)

10. Market Segmentation by Type

10.1 Market segments

Chart on Type - Market share 2025-2030 (%)
Data Table on Type - Market share 2025-2030 (%)

10.2 Comparison by Type

Chart on Comparison by Type
Data Table on Comparison by Type

10.3 Tubing pup joint - Market size and forecast 2025-2030

Chart on Tubing pup joint - Market size and forecast 2025-2030 ($ million)
Data Table on Tubing pup joint - Market size and forecast 2025-2030 ($ million)
Chart on Tubing pup joint - Year-over-year growth 2025-2030 (%)
Data Table on Tubing pup joint - Year-over-year growth 2025-2030 (%)

10.4 Drill pipe pup joint - Market size and forecast 2025-2030

Chart on Drill pipe pup joint - Market size and forecast 2025-2030 ($ million)
Data Table on Drill pipe pup joint - Market size and forecast 2025-2030 ($ million)
Chart on Drill pipe pup joint - Year-over-year growth 2025-2030 (%)
Data Table on Drill pipe pup joint - Year-over-year growth 2025-2030 (%)

10.5 Crossover pup joint - Market size and forecast 2025-2030

Chart on Crossover pup joint - Market size and forecast 2025-2030 ($ million)
Data Table on Crossover pup joint - Market size and forecast 2025-2030 ($ million)
Chart on Crossover pup joint - Year-over-year growth 2025-2030 (%)
Data Table on Crossover pup joint - Year-over-year growth 2025-2030 (%)

10.6 Casing pup joint - Market size and forecast 2025-2030

Chart on Casing pup joint - Market size and forecast 2025-2030 ($ million)
Data Table on Casing pup joint - Market size and forecast 2025-2030 ($ million)
Chart on Casing pup joint - Year-over-year growth 2025-2030 (%)
Data Table on Casing pup joint - Year-over-year growth 2025-2030 (%)

10.7 Market opportunity by Type

Market opportunity by Type ($ million)
Data Table on Market opportunity by Type ($ million)

11. Customer Landscape

11.1 Customer landscape overview

Analysis of price sensitivity, lifecycle, customer purchase basket, adoption rates, and purchase criteria

12. Geographic Landscape

12.1 Geographic segmentation

Chart on Market share by geography 2025-2030 (%)
Data Table on Market share by geography 2025-2030 (%)

12.2 Geographic comparison

Chart on Geographic comparison
Data Table on Geographic comparison

12.3 North America - Market size and forecast 2025-2030

Chart on North America - Market size and forecast 2025-2030 ($ million)
Data Table on North America - Market size and forecast 2025-2030 ($ million)
Chart on North America - Year-over-year growth 2025-2030 (%)
Data Table on North America - Year-over-year growth 2025-2030 (%)
Chart on Regional Comparison - North America
Data Table on Regional Comparison - North America

12.3.1 US - Market size and forecast 2025-2030

Chart on US - Market size and forecast 2025-2030 ($ million)
Data Table on US - Market size and forecast 2025-2030 ($ million)
Chart on US - Year-over-year growth 2025-2030 (%)
Data Table on US - Year-over-year growth 2025-2030 (%)

12.3.2 Canada - Market size and forecast 2025-2030

Chart on Canada - Market size and forecast 2025-2030 ($ million)
Data Table on Canada - Market size and forecast 2025-2030 ($ million)
Chart on Canada - Year-over-year growth 2025-2030 (%)
Data Table on Canada - Year-over-year growth 2025-2030 (%)

12.3.3 Mexico - Market size and forecast 2025-2030

Chart on Mexico - Market size and forecast 2025-2030 ($ million)
Data Table on Mexico - Market size and forecast 2025-2030 ($ million)
Chart on Mexico - Year-over-year growth 2025-2030 (%)
Data Table on Mexico - Year-over-year growth 2025-2030 (%)

12.4 Middle East and Africa - Market size and forecast 2025-2030

Chart on Middle East and Africa - Market size and forecast 2025-2030 ($ million)
Data Table on Middle East and Africa - Market size and forecast 2025-2030 ($ million)
Chart on Middle East and Africa - Year-over-year growth 2025-2030 (%)
Data Table on Middle East and Africa - Year-over-year growth 2025-2030 (%)
Chart on Regional Comparison - Middle East and Africa
Data Table on Regional Comparison - Middle East and Africa

12.4.1 Saudi Arabia - Market size and forecast 2025-2030

Chart on Saudi Arabia - Market size and forecast 2025-2030 ($ million)
Data Table on Saudi Arabia - Market size and forecast 2025-2030 ($ million)
Chart on Saudi Arabia - Year-over-year growth 2025-2030 (%)
Data Table on Saudi Arabia - Year-over-year growth 2025-2030 (%)

12.4.2 UAE - Market size and forecast 2025-2030

Chart on UAE - Market size and forecast 2025-2030 ($ million)
Data Table on UAE - Market size and forecast 2025-2030 ($ million)
Chart on UAE - Year-over-year growth 2025-2030 (%)
Data Table on UAE - Year-over-year growth 2025-2030 (%)

12.4.3 South Africa - Market size and forecast 2025-2030

Chart on South Africa - Market size and forecast 2025-2030 ($ million)
Data Table on South Africa - Market size and forecast 2025-2030 ($ million)
Chart on South Africa - Year-over-year growth 2025-2030 (%)
Data Table on South Africa - Year-over-year growth 2025-2030 (%)

12.4.4 Turkey - Market size and forecast 2025-2030

Chart on Turkey - Market size and forecast 2025-2030 ($ million)
Data Table on Turkey - Market size and forecast 2025-2030 ($ million)
Chart on Turkey - Year-over-year growth 2025-2030 (%)
Data Table on Turkey - Year-over-year growth 2025-2030 (%)

12.4.5 Israel - Market size and forecast 2025-2030

Chart on Israel - Market size and forecast 2025-2030 ($ million)
Data Table on Israel - Market size and forecast 2025-2030 ($ million)
Chart on Israel - Year-over-year growth 2025-2030 (%)
Data Table on Israel - Year-over-year growth 2025-2030 (%)

12.5 APAC - Market size and forecast 2025-2030

Chart on APAC - Market size and forecast 2025-2030 ($ million)
Data Table on APAC - Market size and forecast 2025-2030 ($ million)
Chart on APAC - Year-over-year growth 2025-2030 (%)
Data Table on APAC - Year-over-year growth 2025-2030 (%)
Chart on Regional Comparison - APAC
Data Table on Regional Comparison - APAC

12.5.1 China - Market size and forecast 2025-2030

Chart on China - Market size and forecast 2025-2030 ($ million)
Data Table on China - Market size and forecast 2025-2030 ($ million)
Chart on China - Year-over-year growth 2025-2030 (%)
Data Table on China - Year-over-year growth 2025-2030 (%)

12.5.2 India - Market size and forecast 2025-2030

Chart on India - Market size and forecast 2025-2030 ($ million)
Data Table on India - Market size and forecast 2025-2030 ($ million)
Chart on India - Year-over-year growth 2025-2030 (%)
Data Table on India - Year-over-year growth 2025-2030 (%)

12.5.3 Japan - Market size and forecast 2025-2030

Chart on Japan - Market size and forecast 2025-2030 ($ million)
Data Table on Japan - Market size and forecast 2025-2030 ($ million)
Chart on Japan - Year-over-year growth 2025-2030 (%)
Data Table on Japan - Year-over-year growth 2025-2030 (%)

12.5.4 Australia - Market size and forecast 2025-2030

Chart on Australia - Market size and forecast 2025-2030 ($ million)
Data Table on Australia - Market size and forecast 2025-2030 ($ million)
Chart on Australia - Year-over-year growth 2025-2030 (%)
Data Table on Australia - Year-over-year growth 2025-2030 (%)

12.5.5 South Korea - Market size and forecast 2025-2030

Chart on South Korea - Market size and forecast 2025-2030 ($ million)
Data Table on South Korea - Market size and forecast 2025-2030 ($ million)
Chart on South Korea - Year-over-year growth 2025-2030 (%)
Data Table on South Korea - Year-over-year growth 2025-2030 (%)

12.5.6 Indonesia - Market size and forecast 2025-2030

Chart on Indonesia - Market size and forecast 2025-2030 ($ million)
Data Table on Indonesia - Market size and forecast 2025-2030 ($ million)
Chart on Indonesia - Year-over-year growth 2025-2030 (%)
Data Table on Indonesia - Year-over-year growth 2025-2030 (%)

12.6 Europe - Market size and forecast 2025-2030

Chart on Europe - Market size and forecast 2025-2030 ($ million)
Data Table on Europe - Market size and forecast 2025-2030 ($ million)
Chart on Europe - Year-over-year growth 2025-2030 (%)
Data Table on Europe - Year-over-year growth 2025-2030 (%)
Chart on Regional Comparison - Europe
Data Table on Regional Comparison - Europe

12.6.1 Germany - Market size and forecast 2025-2030

Chart on Germany - Market size and forecast 2025-2030 ($ million)
Data Table on Germany - Market size and forecast 2025-2030 ($ million)
Chart on Germany - Year-over-year growth 2025-2030 (%)
Data Table on Germany - Year-over-year growth 2025-2030 (%)

12.6.2 UK - Market size and forecast 2025-2030

Chart on UK - Market size and forecast 2025-2030 ($ million)
Data Table on UK - Market size and forecast 2025-2030 ($ million)
Chart on UK - Year-over-year growth 2025-2030 (%)
Data Table on UK - Year-over-year growth 2025-2030 (%)

12.6.3 France - Market size and forecast 2025-2030

Chart on France - Market size and forecast 2025-2030 ($ million)
Data Table on France - Market size and forecast 2025-2030 ($ million)
Chart on France - Year-over-year growth 2025-2030 (%)
Data Table on France - Year-over-year growth 2025-2030 (%)

12.6.4 Italy - Market size and forecast 2025-2030

Chart on Italy - Market size and forecast 2025-2030 ($ million)
Data Table on Italy - Market size and forecast 2025-2030 ($ million)
Chart on Italy - Year-over-year growth 2025-2030 (%)
Data Table on Italy - Year-over-year growth 2025-2030 (%)

12.6.5 Spain - Market size and forecast 2025-2030

Chart on Spain - Market size and forecast 2025-2030 ($ million)
Data Table on Spain - Market size and forecast 2025-2030 ($ million)
Chart on Spain - Year-over-year growth 2025-2030 (%)
Data Table on Spain - Year-over-year growth 2025-2030 (%)

12.6.6 The Netherlands - Market size and forecast 2025-2030

Chart on The Netherlands - Market size and forecast 2025-2030 ($ million)
Data Table on The Netherlands - Market size and forecast 2025-2030 ($ million)
Chart on The Netherlands - Year-over-year growth 2025-2030 (%)
Data Table on The Netherlands - Year-over-year growth 2025-2030 (%)

12.7 South America - Market size and forecast 2025-2030

Chart on South America - Market size and forecast 2025-2030 ($ million)
Data Table on South America - Market size and forecast 2025-2030 ($ million)
Chart on South America - Year-over-year growth 2025-2030 (%)
Data Table on South America - Year-over-year growth 2025-2030 (%)
Chart on Regional Comparison - South America
Data Table on Regional Comparison - South America

12.7.1 Brazil - Market size and forecast 2025-2030

Chart on Brazil - Market size and forecast 2025-2030 ($ million)
Data Table on Brazil - Market size and forecast 2025-2030 ($ million)
Chart on Brazil - Year-over-year growth 2025-2030 (%)
Data Table on Brazil - Year-over-year growth 2025-2030 (%)

12.7.2 Argentina - Market size and forecast 2025-2030

Chart on Argentina - Market size and forecast 2025-2030 ($ million)
Data Table on Argentina - Market size and forecast 2025-2030 ($ million)
Chart on Argentina - Year-over-year growth 2025-2030 (%)
Data Table on Argentina - Year-over-year growth 2025-2030 (%)

12.7.3 Colombia - Market size and forecast 2025-2030

Chart on Colombia - Market size and forecast 2025-2030 ($ million)
Data Table on Colombia - Market size and forecast 2025-2030 ($ million)
Chart on Colombia - Year-over-year growth 2025-2030 (%)
Data Table on Colombia - Year-over-year growth 2025-2030 (%)

12.8 Market opportunity by geography

Market opportunity by geography ($ million)
Data Tables on Market opportunity by geography ($ million)

13. Drivers, Challenges, and Opportunity

13.1 Market drivers

Increasing oil and gas exploration and production activities
Technological advancements in drilling and extraction techniques
Expansion and modernization of energy infrastructure

13.2 Market challenges

Heightened volatility in raw material prices
Fluctuations in oil and gas demand and exploration activities
Increasingly stringent environmental regulations and the energy transition

13.3 Impact of drivers and challenges

Impact of drivers and challenges in 2025 and 2030

13.4 Market opportunities

Rising demand from unconventional and deepwater drilling expansion
Technological advancements and innovation in pup joint manufacturing
Market expansion in the Asia pacific region driven by growing energy demand

14. Competitive Landscape

14.1 Overview

14.2

Overview on criticality of inputs and factors of differentiation

14.3 Landscape disruption

Overview on factors of disruption

14.4 Industry risks

Impact of key risks on business

15. Competitive Analysis

15.1 Companies profiled

Companies covered

15.2 Company ranking index

15.3 Market positioning of companies

Matrix on companies position and classification

15.4 ASC Engineered Solutions

ASC Engineered Solutions - Overview
ASC Engineered Solutions - Product / Service
ASC Engineered Solutions - Key offerings
SWOT

15.5 AZZ Inc.

AZZ Inc. - Overview
AZZ Inc. - Business segments
AZZ Inc. - Key offerings
AZZ Inc. - Segment focus
SWOT

15.6 Baker Hughes Co.

Baker Hughes Co. - Overview
Baker Hughes Co. - Business segments
Baker Hughes Co. - Key news
Baker Hughes Co. - Key offerings
Baker Hughes Co. - Segment focus
SWOT

15.7 Forum Energy Technologies Inc.

Forum Energy Technologies Inc. - Overview
Forum Energy Technologies Inc. - Business segments
Forum Energy Technologies Inc. - Key news
Forum Energy Technologies Inc. - Key offerings
Forum Energy Technologies Inc. - Segment focus
SWOT

15.8 NOV Inc.

NOV Inc. - Overview
NOV Inc. - Business segments
NOV Inc. - Key news
NOV Inc. - Key offerings
NOV Inc. - Segment focus
SWOT

15.9 Oil Country Tubular Ltd.

Oil Country Tubular Ltd. - Overview
Oil Country Tubular Ltd. - Product / Service
Oil Country Tubular Ltd. - Key offerings
SWOT

15.10 Schlumberger Ltd.

Schlumberger Ltd. - Overview
Schlumberger Ltd. - Business segments
Schlumberger Ltd. - Key news
Schlumberger Ltd. - Key offerings
Schlumberger Ltd. - Segment focus
SWOT

15.11 Sledgehammer Oil Tools Pvt. Ltd.

Sledgehammer Oil Tools Pvt. Ltd. - Overview
Sledgehammer Oil Tools Pvt. Ltd. - Product / Service
Sledgehammer Oil Tools Pvt. Ltd. - Key offerings
SWOT

15.12 Stewart Tubular Products LLC

Stewart Tubular Products LLC - Overview
Stewart Tubular Products LLC - Product / Service
Stewart Tubular Products LLC - Key offerings
SWOT

15.13 Tejas Tebular Products Inc.

Tejas Tebular Products Inc. - Overview
Tejas Tebular Products Inc. - Product / Service
Tejas Tebular Products Inc. - Key offerings
SWOT

15.14 Tenaris SA

Tenaris SA - Overview
Tenaris SA - Product / Service
Tenaris SA - Key news
Tenaris SA - Key offerings
SWOT

15.15 Texas Pipe Works Inc.

Texas Pipe Works Inc. - Overview
Texas Pipe Works Inc. - Product / Service
Texas Pipe Works Inc. - Key offerings
SWOT

15.16 Vallourec SA

Vallourec SA - Overview
Vallourec SA - Business segments
Vallourec SA - Key offerings
Vallourec SA - Segment focus
SWOT

15.17 Weatherford International Plc

Weatherford International Plc - Overview
Weatherford International Plc - Business segments
Weatherford International Plc - Key news
Weatherford International Plc - Key offerings
Weatherford International Plc - Segment focus
SWOT

15.18 Weijia Petroleum

Weijia Petroleum - Overview
Weijia Petroleum - Product / Service
Weijia Petroleum - Key offerings
SWOT

16. Appendix

16.1 Scope of the report

Market definition
Objectives
Notes and caveats

16.2 Inclusions and exclusions checklist

Inclusions checklist
Exclusions checklist

16.3 Currency conversion rates for US$

16.4 Research methodology

16.5 Data procurement

Information sources

16.6 Data validation

16.7 Validation techniques employed for market sizing

16.8 Data synthesis

16.9 360 degree market analysis

16.10 List of abbreviations

Research Methodology

Technavio presents a detailed picture of the market by way of study, synthesis, and summation of data from multiple sources. The analysts have presented the various facets of the market with a particular focus on identifying the key industry influencers. The data thus presented is comprehensive, reliable, and the result of extensive research, both primary and secondary.

INFORMATION SOURCES

Primary sources

  • Manufacturers and suppliers
  • Channel partners
  • Industry experts
  • Strategic decision makers

Secondary sources

  • Industry journals and periodicals
  • Government data
  • Financial reports of key industry players
  • Historical data
  • Press releases

DATA ANALYSIS

Data Synthesis

  • Collation of data
  • Estimation of key figures
  • Analysis of derived insights

Data Validation

  • Triangulation with data models
  • Reference against proprietary databases
  • Corroboration with industry experts

REPORT WRITING

Qualitative

  • Market drivers
  • Market challenges
  • Market trends
  • Five forces analysis

Quantitative

  • Market size and forecast
  • Market segmentation
  • Geographical insights
  • Competitive landscape

Interested in this report?

Get your sample now to see our research methodology and insights!

Download Now

Frequently Asked Questions

Pup Joint market growth will increase by USD 226.6 million during 2026-2030 .

The Pup Joint market is expected to grow at a CAGR of 6.2% during 2026-2030 .

Pup Joint market is segmented by Technology (Hot rolled, Cold rolled) Application (Oil and gas, Chemical industry, Mining, Construction, Others) Type (Tubing pup joint, Drill pipe pup joint, Crossover pup joint, Casing pup joint)

ASC Engineered Solutions, AZZ Inc., Baker Hughes Co., Forum Energy Technologies Inc., Mid-Continent Equipment Group Pte Ltd., NOV Inc., Oil Country Tubular Ltd., Schlumberger Ltd., Sledgehammer Oil Tools Pvt. Ltd., Stewart Tubular Products LLC, Tejas Tebular Products Inc., Tenaris SA, Texas Pipe Works Inc., TPS Technitube Rohrenwerke GmbH, Vallourec SA, Weatherford International Plc, Weijia Petroleum, WestCan Oilfield Supply Ltd. are a few of the key vendors in the Pup Joint market.

North America will register the highest growth rate of 32.3% among the other regions. Therefore, the Pup Joint market in North America is expected to garner significant business opportunities for the vendors during the forecast period.

US, Canada, Mexico, Saudi Arabia, UAE, South Africa, Turkey, Israel, China, India, Japan, Australia, South Korea, Indonesia, Germany, UK, France, Italy, Spain, The Netherlands, Brazil, Argentina, Colombia

  • Increasing oil and gas exploration and production activities is the driving factor this market.

The Pup Joint market vendors should focus on grabbing business opportunities from the Technology segment as it accounted for the largest market share in the base year.