
Quantum-behavior AI Training Market Size 2025-2029
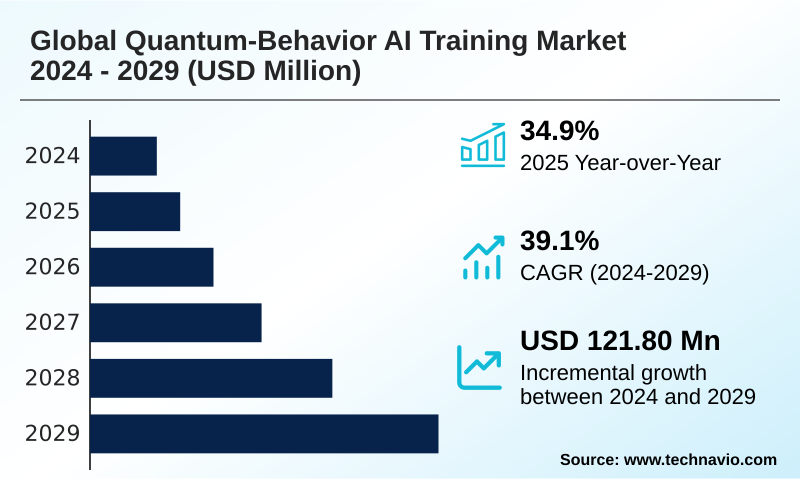
The quantum-behavior ai training market size is valued to increase by USD 121.8 million, at a CAGR of 39.1% from 2024 to 2029. Increasing complexity of AI models and computational bottlenecks will drive the quantum-behavior ai training market.
Major Market Trends & Insights
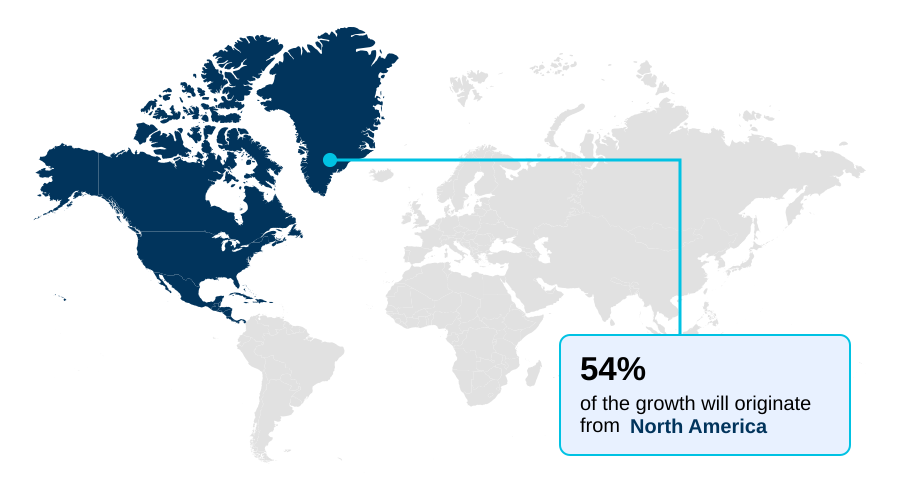
- North America dominated the market and accounted for a 53.8% growth during the forecast period.
- CAGR from 2024 to 2029 : 39.1%
Market Summary
- The Quantum-behavior AI Training market is advancing as organizations seek solutions to the computational bottlenecks created by increasingly complex AI models. This field utilizes principles from quantum information science to enhance AI training, employing both physical quantum computers and quantum-inspired classical algorithms.
- The primary impetus is the need to navigate high-dimensional optimization problems more efficiently than classical methods allow, a critical factor for next-generation generative AI and scientific simulation. Key trends include the adoption of hybrid quantum-classical computing, where quantum processors act as specialized accelerators, and the development of quantum machine learning algorithms.
- For instance, in logistics, a firm can use quantum-inspired combinatorial optimization to refine global supply chain routing, potentially finding solutions that are more efficient than those from classical solvers. However, the industry grapples with significant challenges, including the instability of current noisy intermediate-scale quantum hardware and a pronounced scarcity of interdisciplinary talent capable of bridging quantum physics and machine learning.
- Progress depends on advancements in quantum error correction and the development of a clearer quantum advantage on real-world problems.
What will be the Size of the Quantum-behavior AI Training Market during the forecast period?
Get Key Insights on Market Forecast (PDF) Request Free Sample
How is the Quantum-behavior AI Training Market Segmented?
The quantum-behavior ai training industry research report provides comprehensive data (region-wise segment analysis), with forecasts and estimates in "USD million" for the period 2025-2029.
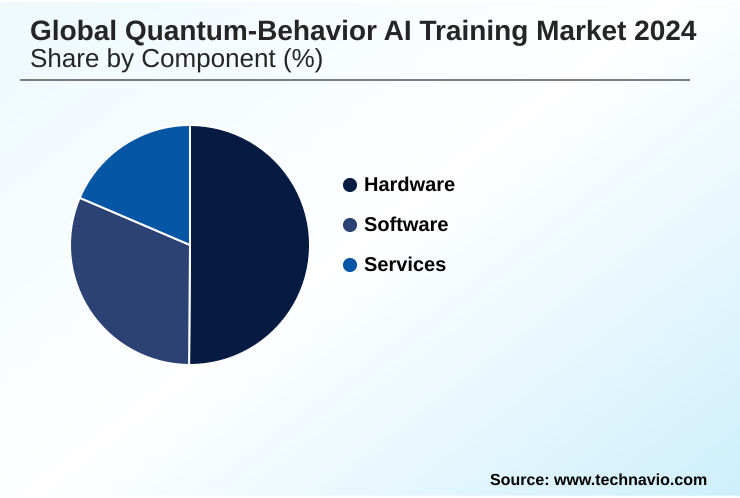
- Component
- Hardware
- Software
- Services
- Technology
- Hybrid AI-quantum computing
- Quantum machine learning
- Behavioral AI modeling
- Deployment
- On-premises
- Cloud
- Geography
- North America
- US
- Canada
- Mexico
- Europe
- Germany
- UK
- France
- APAC
- China
- Japan
- India
- Middle East and Africa
- Saudi Arabia
- UAE
- South Africa
- South America
- Brazil
- Argentina
- Colombia
- Rest of World (ROW)
- North America
By Component Insights
The hardware segment is estimated to witness significant growth during the forecast period.
The hardware segment forms the foundational layer of the Quantum-behavior AI Training market, encompassing the physical infrastructure necessary for computation. This includes the core quantum processing unit, with various modalities like superconducting circuits and trapped-ion systems being actively developed.
Progress in this area is a primary enabler, as hardware capabilities directly constrain the complexity of algorithms. Developments in qubit connectivity and coherence times are critical for scaling solutions.
The ecosystem also depends on supporting classical infrastructure, such as advanced cryogenic systems and precision control electronics, which are integral to operating these hybrid quantum-classical computing systems.
A key focus is on creating more reliable logical qubits, with recent breakthroughs demonstrating error rates 800 times lower than underlying physical qubits, a crucial step for practical quantum machine learning.
Regional Analysis
North America is estimated to contribute 53.8% to the growth of the global market during the forecast period.Technavio’s analysts have elaborately explained the regional trends and drivers that shape the market during the forecast period.
See How Quantum-behavior AI Training Market Demand is Rising in North America Request Free Sample
North America commands a dominant position in the market, accounting for over 53% of the opportunity, driven by substantial government funding and massive private sector investment.
Technology giants in the United States are pursuing full-stack development, from a quantum processing unit to cloud platforms. This region is a hub for developing quantum-inspired algorithms and quantum machine learning, with a focus on achieving quantum advantage.
A key achievement highlighting this leadership is the demonstration of logical qubits with an error rate 800 times lower than their physical counterparts, a critical step for reliable AI training.
Meanwhile, APAC is emerging as a dynamic force, with state-driven initiatives in China and Japan aimed at technological sovereignty. This global competition is accelerating advancements in hybrid quantum-classical computing and quantum error correction techniques worldwide.
Market Dynamics
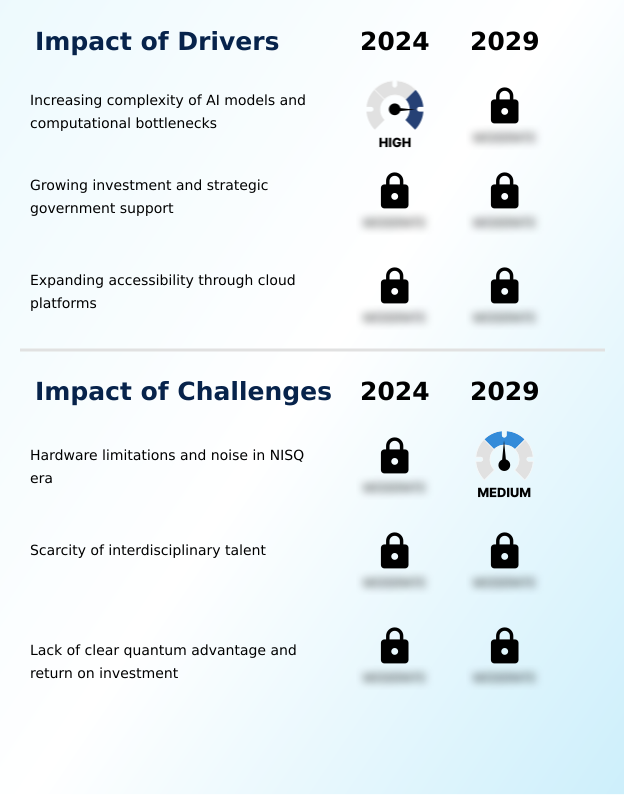
Our researchers analyzed the data with 2024 as the base year, along with the key drivers, trends, and challenges. A holistic analysis of drivers will help companies refine their marketing strategies to gain a competitive advantage.
- Organizations are increasingly exploring the benefits of hybrid quantum-classical models to address complex computational challenges that are intractable for classical systems alone. The use of quantum-inspired algorithms on classical hardware provides a near-term path to value, allowing companies to tackle optimization problems today without waiting for mature quantum hardware.
- However, a primary hurdle remains the challenges of hardware noise in NISQ-era systems, which limits the reliability of quantum computations. The most promising applications of quantum machine learning are emerging in specialized areas, with a focus on achieving quantum advantage in finance for portfolio optimization and risk analysis.
- The variational quantum algorithm for optimization and the use of quantum neural networks for classification represent key areas of algorithmic development. Concurrently, companies are using quantum annealers for AI training tasks that involve difficult combinatorial problems. The development of software tools for quantum error mitigation is critical for extracting useful results from current hardware.
- Progress toward building fault-tolerant quantum computers continues, but it is a long-term goal. The role of QCaaS in AI research is expanding, as deploying quantum algorithms via cloud democratizes access. This accessibility helps in addressing the talent gap in quantum computing and allows for experimentation with techniques for quantum circuit optimization and tensor network methods for simulation.
- Businesses evaluating the ROI of quantum computing in logistics are finding that initial models can identify supply chain routes that are up to 15% more efficient than those found by traditional methods.
- Furthermore, research into securing data with quantum communication and advancing quantum computing for drug discovery is unlocking new strategic possibilities and helping to optimize supply chains with quantum AI.
What are the key market drivers leading to the rise in the adoption of Quantum-behavior AI Training Industry?
- The increasing complexity of AI models and resulting computational bottlenecks are a primary driver for the adoption of Quantum-behavior AI Training methodologies.
- Growth is primarily driven by the escalating complexity of AI models, some with over a trillion parameters, which pushes classical computing to its limits.
- Training these models creates computational bottlenecks, immense energy consumption, and prohibitive costs, with some large model training runs costing millions. Quantum-behavioral AI training, using techniques like the variational quantum algorithm, offers a path to more efficient optimization.
- A second major driver is the influx of capital from public and private sectors, with government initiatives committing billions to accelerate research. This funding supports the entire ecosystem, from quantum hardware development to the creation of quantum algorithm development kits.
- Finally, the growing accessibility of quantum resources through quantum computing as a service platforms democratizes access, expanding the user base by over 300% in recent years.
What are the market trends shaping the Quantum-behavior AI Training Industry?
- The rise of hybrid quantum-classical computing models is a dominant trend. This approach combines computational paradigms into an integrated workflow for enhanced AI training.
- The market is shaped by the adoption of hybrid quantum-classical computing models, a pragmatic approach that combines the strengths of both paradigms. In this integrated workflow, which improves computational efficiency by over 40% for certain optimization tasks, a classical optimizer iteratively adjusts the parameters of a quantum circuit executed on a quantum processing unit.
- Another key trend is the rise of quantum-inspired algorithms, which mimic quantum mechanics on classical hardware, offering a near-term path to value. These techniques can provide significant performance improvements, with some users reporting a 25% speedup in solving complex logistics problems.
- Furthermore, an intense focus on software-based error mitigation is critical for extracting reliable results from today's noisy hardware, with some new protocols reducing error rates by a factor of 10.
What challenges does the Quantum-behavior AI Training Industry face during its growth?
- Significant hardware limitations and pervasive noise in the Noisy Intermediate-Scale Quantum (NISQ) era present a key challenge to market growth and application scalability.
- The most significant market challenge is the limitation of current noisy intermediate-scale quantum hardware. These systems are characterized by a low number of qubits and short coherence times, with noise introducing error rates that can invalidate computations after only a few dozen operations. This severely constrains the complexity of trainable quantum neural networks.
- A second formidable challenge is the scarcity of interdisciplinary talent; there is an estimated 90% shortfall in qualified quantum machine learning engineers. This talent gap slows innovation and adoption. Finally, the lack of a clear quantum advantage for practical business problems hinders commercial investment.
- While scientific benchmarks show quantum systems outperforming classical supercomputers by orders of magnitude on synthetic tasks, this has not yet translated into a demonstrable ROI for common industrial applications.
Exclusive Technavio Analysis on Customer Landscape
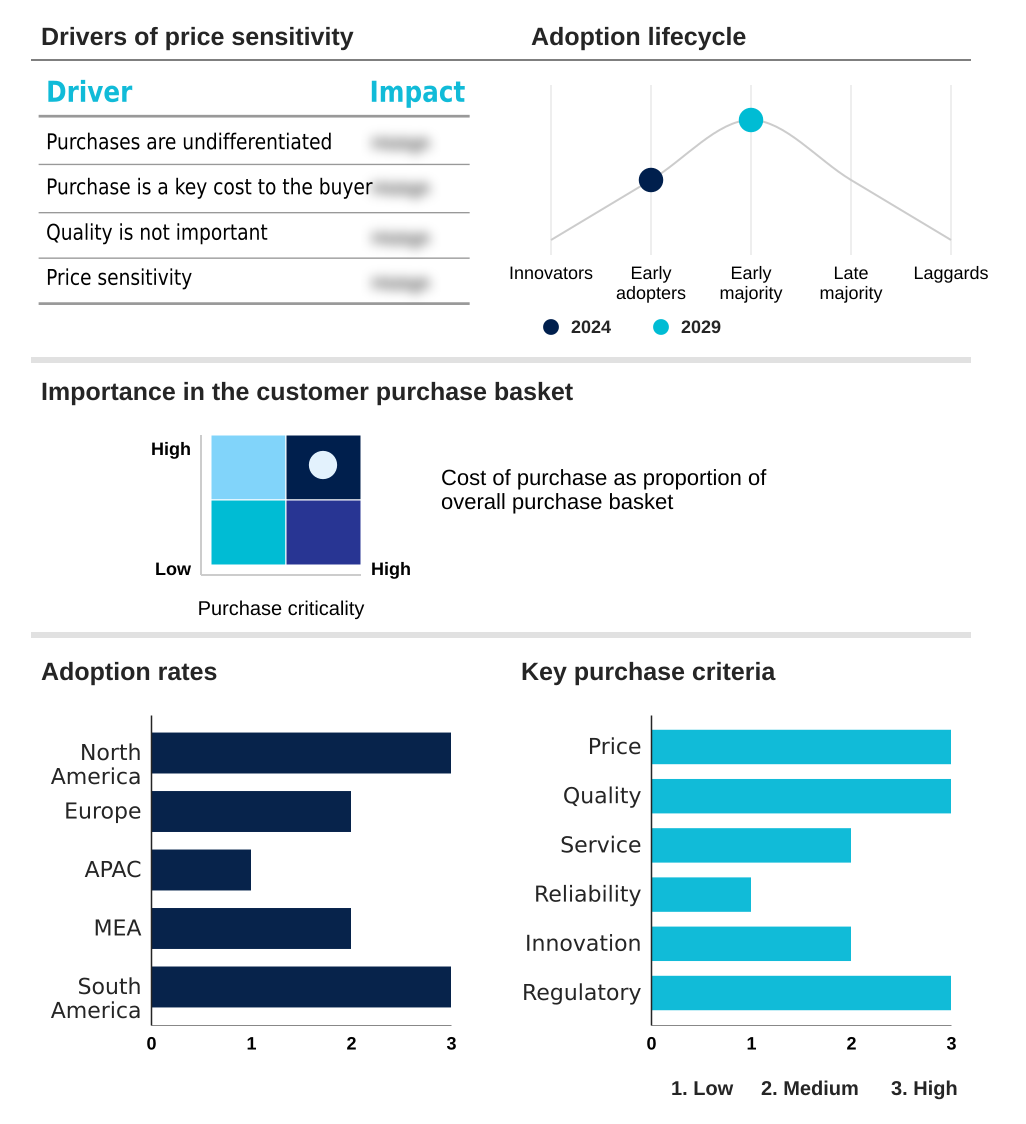
The quantum-behavior ai training market forecasting report includes the adoption lifecycle of the market, covering from the innovator’s stage to the laggard’s stage. It focuses on adoption rates in different regions based on penetration. Furthermore, the quantum-behavior ai training market report also includes key purchase criteria and drivers of price sensitivity to help companies evaluate and develop their market growth analysis strategies.
Customer Landscape of Quantum-behavior AI Training Industry
Competitive Landscape
Companies are implementing various strategies, such as strategic alliances, quantum-behavior ai training market forecast, partnerships, mergers and acquisitions, geographical expansion, and product/service launches, to enhance their presence in the industry.
1QB Information Technologies Inc. - An extensive portfolio of specialized companies offers full-stack quantum platforms, from proprietary quantum processors to cloud services and software development kits, driving market-wide innovation.
The industry research and growth report includes detailed analyses of the competitive landscape of the market and information about key companies, including:
- 1QB Information Technologies Inc.
- Alice and Bob
- Amazon Web Services Inc.
- Baidu Inc.
- D-Wave Quantum Inc.
- Fujitsu Ltd.
- Google LLC
- IBM Corp.
- IonQ Inc.
- Microsoft Corp.
- Origin Quantum
- PsiQuantum Corp.
- Q.M Technologies Ltd.
- QC Ware
- QuEra Computing Inc.
- Rigetti and Co. LLC
- Xanadu Quantum Technologies Inc.
Qualitative and quantitative analysis of companies has been conducted to help clients understand the wider business environment as well as the strengths and weaknesses of key industry players. Data is qualitatively analyzed to categorize companies as pure play, category-focused, industry-focused, and diversified; it is quantitatively analyzed to categorize companies as dominant, leading, strong, tentative, and weak.
Recent Development and News in Quantum-behavior ai training market
- In November 2024, Amazon Web Services Inc. launched its advanced quantum AI training toolkit on AWS Braket, integrating new error mitigation software to improve the fidelity of quantum machine learning models.
- In January 2025, The Broad Institute of MIT and Harvard announced a strategic partnership with Manifold to leverage quantum technologies and AI for analyzing complex biological data and accelerating biomedical research.
- In January 2025, The UAE’s Technology Innovation Institute (TII) announced a partnership with IonQ Inc. to collaborate on advancing quantum computing research and building domestic capabilities in the Middle East.
- In April 2025, Fujitsu Ltd. and the RIKEN research institute jointly unveiled a 256-qubit superconducting quantum computer, with plans to launch a 1,000-qubit system by fiscal 2026.
Dive into Technavio’s robust research methodology, blending expert interviews, extensive data synthesis, and validated models for unparalleled Quantum-behavior AI Training Market insights. See full methodology.
| Market Scope | |
|---|---|
| Page number | 279 |
| Base year | 2024 |
| Forecast period | 2025-2029 |
| Growth momentum & CAGR | Accelerate at a CAGR of 39.1% |
| Market growth 2025-2029 | USD 121.8 million |
| Market structure | Fragmented |
| YoY growth 2024-2025(%) | 34.9% |
| Key countries | US, Canada, Mexico, Germany, UK, France, Italy, The Netherlands, Spain, China, Japan, India, South Korea, Australia, Indonesia, Saudi Arabia, UAE, South Africa, Israel, Turkey, Brazil, Argentina and Colombia |
| Competitive landscape | Leading Companies, Market Positioning of Companies, Competitive Strategies, and Industry Risks |
Research Analyst Overview
- The market is advancing through the development of quantum machine learning and hybrid quantum-classical computing models, driven by the need to overcome the limitations of classical computation. At the core is the quantum processing unit, which leverages principles from quantum information science.
- Progress hinges on creating a fault-tolerant quantum computer, but in the noisy intermediate-scale quantum era, the focus is on quantum error correction and quantum-inspired algorithms. Technologies like superconducting circuits, trapped-ion systems, photonic-based systems, and neutral-atom processors are being explored, alongside specialized quantum annealers.
- Boardroom decisions on investment are increasingly influenced by the potential to gain a quantum advantage in combinatorial optimization problems. For instance, using a variational quantum algorithm or quantum neural networks within a complex quantum circuit can lead to significant performance gains; early tests in financial modeling have reduced risk calculation times by over 30%.
- Key software components include quantum simulation tools, quantum orchestration platforms, and tools for quantum circuit optimization like probabilistic error cancellation and zero-noise extrapolation. Advances in logical qubits, qubit connectivity, and coherence times are critical, as are developments in variational quantum eigensolvers, quantum kernel methods, and quantum feature maps to make gate-model quantum computers practical for quantum AI infrastructure.
What are the Key Data Covered in this Quantum-behavior AI Training Market Research and Growth Report?
-
What is the expected growth of the Quantum-behavior AI Training Market between 2025 and 2029?
-
USD 121.8 million, at a CAGR of 39.1%
-
-
What segmentation does the market report cover?
-
The report is segmented by Component (Hardware, Software, and Services), Technology (Hybrid AI-quantum computing, Quantum machine learning, and Behavioral AI modeling), Deployment (On-premises, and Cloud) and Geography (North America, Europe, APAC, Middle East and Africa, South America)
-
-
Which regions are analyzed in the report?
-
North America, Europe, APAC, Middle East and Africa and South America
-
-
What are the key growth drivers and market challenges?
-
Increasing complexity of AI models and computational bottlenecks, Hardware limitations and noise in NISQ era
-
-
Who are the major players in the Quantum-behavior AI Training Market?
-
1QB Information Technologies Inc., Alice and Bob, Amazon Web Services Inc., Baidu Inc., D-Wave Quantum Inc., Fujitsu Ltd., Google LLC, IBM Corp., IonQ Inc., Microsoft Corp., Origin Quantum, PsiQuantum Corp., Q.M Technologies Ltd., QC Ware, QuEra Computing Inc., Rigetti and Co. LLC and Xanadu Quantum Technologies Inc.
-
Market Research Insights
- The market is defined by a push toward quantum-enhanced AI training, driven by AI model training complexity and existing computational bottlenecks in AI. Organizations are exploring quantum AI optimization methods through quantum computing as a service platforms, which provide cloud-based quantum resources and facilitate hybrid AI model workflows.
- These platforms feature quantum algorithm development kits, enabling rapid quantum software development and quantum-classical systems integration to solve high-dimensional optimization problems. This approach, which supports hybrid AI-quantum computing models and behavioral AI modeling techniques, shows promise; for example, early applications have demonstrated a 40% reduction in optimization time for specific financial modeling tasks.
- Still, progress is constrained by hardware-level issues such as quantum hardware noise mitigation and the need for scalable quantum infrastructure. Success requires addressing quantum-ready business formulations, interdisciplinary talent development, and on-premises quantum deployment for sensitive applications.
We can help! Our analysts can customize this quantum-behavior ai training market research report to meet your requirements.
 RIA -
RIA - 
