Quick Service Restaurants Market Analysis, Size, and Forecast 2026-2030: North America (US, Canada, and Mexico), APAC (China, India, and Japan), Europe (Germany, UK, and France), South America (Brazil and Argentina), Middle East and Africa (Saudi Arabia, UAE, and South Africa), and Rest of World (ROW)

Quick Service Restaurants Market Analysis, Size, and Forecast 2026-2030:
North America (US, Canada, and Mexico), APAC (China, India, and Japan), Europe (Germany, UK, and France), South America (Brazil and Argentina), Middle East and Africa (Saudi Arabia, UAE, and South Africa), and Rest of World (ROW)

Published: Mar 2026 305 Pages SKU: IRTNTR43556

Market Overview at a Glance

$65.81 B
Market Opportunity
2.2%
CAGR 2025 - 2030
42.3%
APAC Growth
$285.86 B
Eat-in service segment 2024

Quick Service Restaurants Market Size 2026-2030

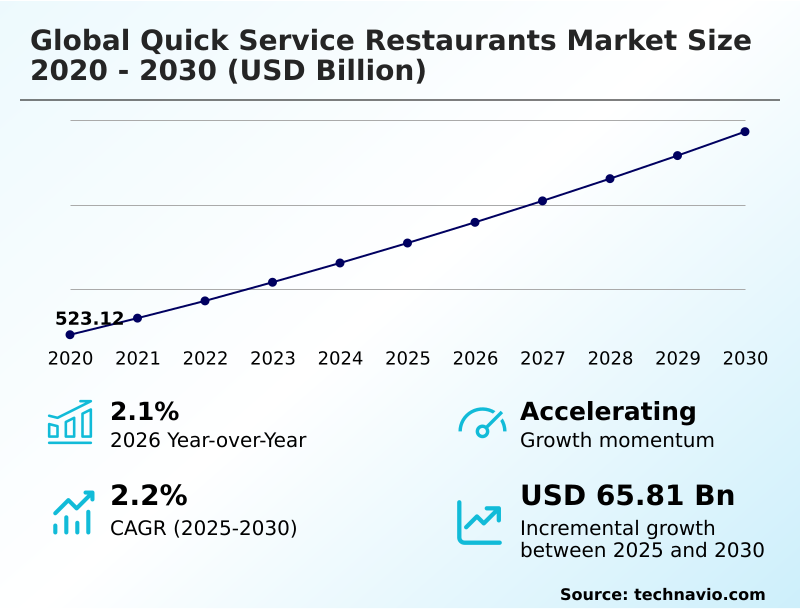
The quick service restaurants market size is valued to increase by USD 65.81 billion, at a CAGR of 2.2% from 2025 to 2030. Strategic mainstreaming of digital-first ecosystems and hyper-automation will drive the quick service restaurants market.

Major Market Trends & Insights

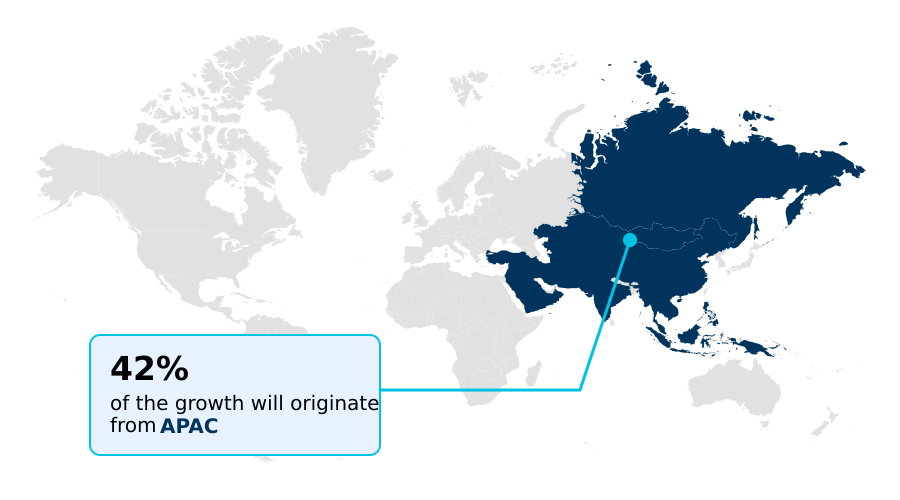
  • APAC dominated the market and accounted for a 42.3% growth during the forecast period.
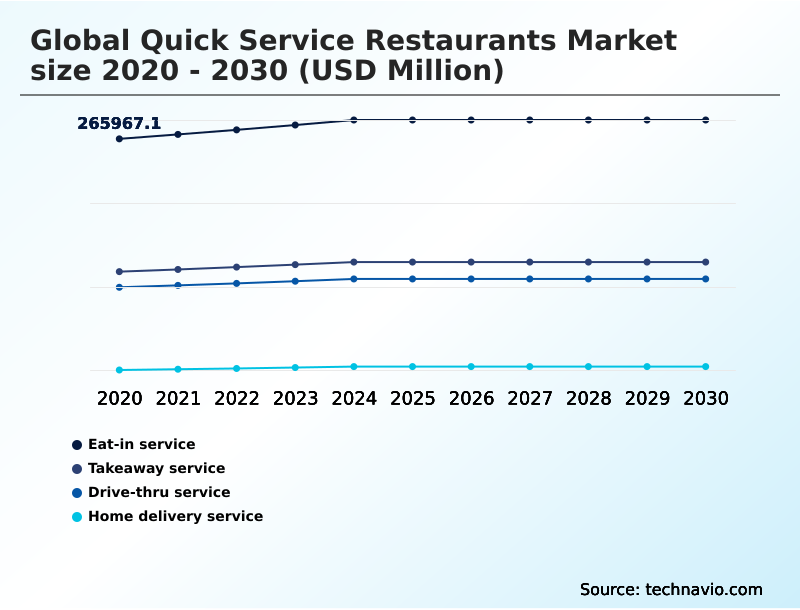
  • By Service - Eat-in service segment was valued at USD 285.86 billion in 2024
  • By Type - Chain segment accounted for the largest market revenue share in 2024

Market Size & Forecast

  • Market Opportunities: USD 120.00 billion
  • Market Future Opportunities: USD 65.81 billion
  • CAGR from 2025 to 2030 : 2.2%

Market Summary

  • The quick service restaurants market is defined by a fundamental shift toward digital-first ecosystems and operational simplification. As consumer lifestyles become increasingly compressed, the traditional value proposition of speed is now augmented by an expectation for seamless, technology-enabled interactions.
  • This evolution is evident in the widespread adoption of artificial intelligence for drive-thru optimization, personalized loyalty platforms, and automated kitchen management systems that enhance throughput while reducing labor dependency.
  • For instance, operators leverage predictive analytics to optimize supply chains, analyzing real-time sales data and local event schedules to forecast demand, thereby reducing food waste by over 15% and ensuring ingredient availability. This focus on data-driven efficiency is critical as the market navigates persistent labor shortages and rising input costs.
  • The competitive landscape is further shaped by the proliferation of cloud kitchens and delivery-only formats, which allow brands to expand their geographic reach with reduced capital expenditure. Ultimately, the ability to balance price accessibility with ingredient quality and ethical sourcing will determine market leadership.

What will be the Size of the Quick Service Restaurants Market during the forecast period?

Get Key Insights on Market Forecast (PDF) Request Free Sample

How is the Quick Service Restaurants Market Segmented?

The quick service restaurants industry research report provides comprehensive data (region-wise segment analysis), with forecasts and estimates in "USD million" for the period 2026-2030, as well as historical data from 2020-2024 for the following segments.

  • Service
    • Eat-in service
    • Takeaway service
    • Drive-thru service
    • Home delivery service
  • Type
    • Chain
    • Independent
  • Product type
    • Burger and sandwich
    • Pizza
    • Asian cuisine
    • Frozen desserts and ice cream
    • Others
  • Geography
    • North America
      • US
      • Canada
      • Mexico
    • APAC
      • China
      • India
      • Japan
    • Europe
      • Germany
      • UK
      • France
    • South America
      • Brazil
      • Argentina
    • Middle East and Africa
      • Saudi Arabia
      • UAE
      • South Africa
    • Rest of World (ROW)

By Service Insights

The eat-in service segment is estimated to witness significant growth during the forecast period.

The eat-in service segment is transforming, pivoting from functional dining to experiences defined by hospitality-focused technology and premium design. Modern establishments integrate self-service kiosks and table-side mobile ordering, using a unified commerce platform to reduce queuing friction.

This shift toward operational self-optimization improves order accuracy by over 15%. High-traffic urban locations are adopting 'third place' concepts with comfortable seating to attract customers during off-peak hours.

The adoption of biometric authentication and frictionless payment methods at the point of sale is streamlining the checkout process, maintaining the speed advantage of the quick service model during high-volume periods.

These data-driven sustainability reporting measures are key for franchisee profitability and leveraging next-generation oven temperature controls.

Request Free Sample

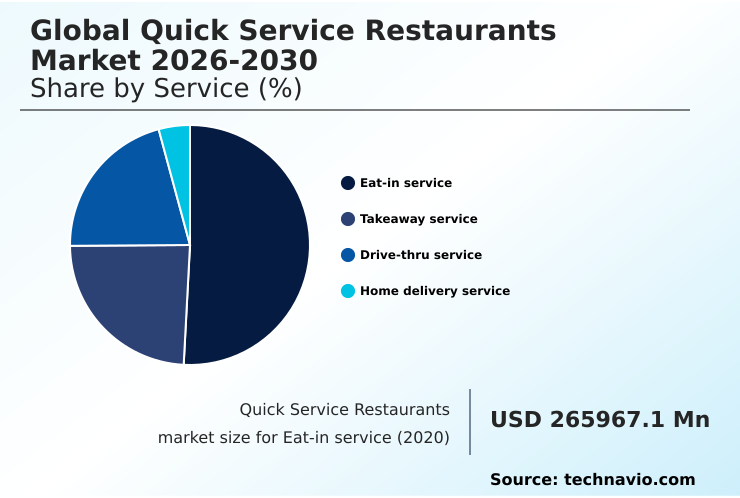
The Eat-in service segment was valued at USD 285.86 billion in 2024 and showed a gradual increase during the forecast period.

Request Free Sample

Regional Analysis

APAC is estimated to contribute 42.3% to the growth of the global market during the forecast period.Technavio’s analysts have elaborately explained the regional trends and drivers that shape the market during the forecast period.

See How Quick Service Restaurants Market Demand is Rising in APAC Request Free Sample

The global quick service restaurants market exhibits a varied geographic landscape, with APAC emerging as the primary engine for incremental growth, contributing 42.3% of the total opportunity.

This region's momentum is fueled by rapid urbanization and a tech-savvy consumer base embracing mobile-first dining experiences and menu localization. In contrast, North America and Europe function as mature markets focused on operational self-optimization.

Here, the deployment of agentic artificial intelligence and autonomous back-of-house systems is standard, with AI-powered restaurant management solutions improving order fulfillment precision by over 12%.

These established regions prioritize workforce retention and are early adopters of reusable container programs and other zero-waste initiatives to meet stringent environmental stewardship standards.

Market Dynamics

Our researchers analyzed the data with 2025 as the base year, along with the key drivers, trends, and challenges. A holistic analysis of drivers will help companies refine their marketing strategies to gain a competitive advantage.

  • The future of the Global Quick Service Restaurants Market 2026-2030 is being shaped by highly specific strategic imperatives. The industrialization of hyper-automation within drive-thru operations is no longer optional, with leaders achieving twice the throughput of competitors. This is complemented by the deployment of unified commerce platforms that create a seamless customer journey.
  • Internally, the integration of agentic AI and autonomous operations, particularly automating order queues based on preparation complexity, is critical for efficiency. On the customer-facing side, the proliferation of hyper-personalized loyalty ecosystems that use geofencing for personalized drive-thru menus is driving retention.
  • The strategic expansion of sustainable circularity is also paramount, involving everything from implementing reusable tableware for dine-in to integrating biomaterial-based soy sauce droppers. Success hinges on navigating the regulatory burden of sustainability mandates while managing input cost volatility and pricing power. This requires a balanced approach, from re-engaging guests with bundled offers to mitigating labor scarcity with automated kitchen tech.
  • Firms that master the deployment of augmented makeline cobotic systems and the upgrade to next-generation espresso equipment will lead the market. The impact of GLP-1 medications on consumer appetites is also forcing a re-evaluation of menu strategies, pushing operators to use local pulses for plant-based options.

What are the key market drivers leading to the rise in the adoption of Quick Service Restaurants Industry?

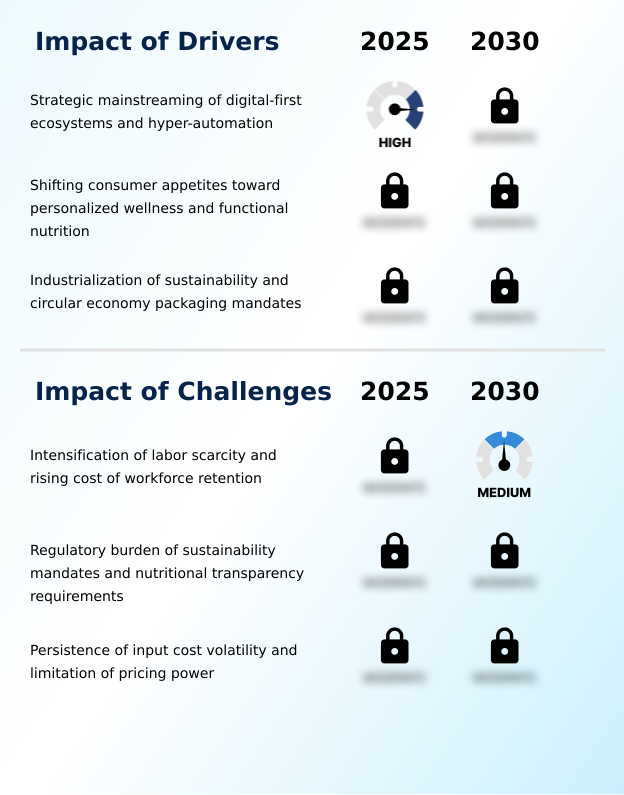
  • The strategic mainstreaming of digital-first ecosystems and the industrialization of hyper-automation are key drivers propelling market growth and operational resilience.

  • A primary market driver is the transition to digital-first ecosystems and hyper-automation, particularly within drive-thru and carry-out channels.
  • In labor-constrained markets, the requirement for AI-driven voice assistants and unified commerce platforms is mounting, as these systems can handle high-volume order processing with minimal human oversight, reducing order errors by up to 20%.
  • The implementation of predictive analytics optimizes inventory levels and labor scheduling based on real-time demand forecasting. This focus on technology is coupled with the strategic evolution of consumer appetites toward personalized wellness and functional nutrition.
  • AI-driven menu personalization, suggesting items based on health goals, is becoming standard.
  • Furthermore, sustainability mandates and the rise of circular economy packaging solutions, such as strawless rPET lids, are compelling operators to adopt closed-loop waste management and data-driven sustainability reporting to enhance brand loyalty.

What are the market trends shaping the Quick Service Restaurants Industry?

  • The market is undergoing a structural realignment, marked by the institutionalization of agentic AI and the deployment of autonomous back-of-house operations to enhance efficiency.

  • The market is structurally realigning toward the institutionalization of agentic artificial intelligence and autonomous back-of-house operations. This move toward invisible AI is driven by labor shortages, with AI-driven kitchen managers prioritizing order queues based on preparation complexity, improving throughput during peak periods by up to 18%. This trend toward operational self-optimization enables the autonomous adjustment of staffing and inventory orders.
  • The proliferation of hyper-personalized loyalty ecosystems and dynamic pricing models utilize real-time consumer data. Sophisticated customer relationship management platforms analyze order history to push tailored promotions, which has been shown to increase engagement by 15%. This shift toward precision value engineering, balancing premium innovation with targeted affordability, is critical.
  • Sustainable circularity and plant-forward hybridization are also key, utilizing compostable packaging and hybrid burgers to reduce carbon footprints.

What challenges does the Quick Service Restaurants Industry face during its growth?

  • A key market challenge is the intensification of labor scarcity, which is compounded by the rising costs associated with workforce retention and training.

  • The market faces a critical challenge from a shrinking labor pool and escalating workforce retention costs, compelling investment in automated kitchen technologies and self-service kiosks. However, the high capital expenditure for these integrations, often representing over 20% of an independent operator's annual budget, creates significant financial barriers.
  • Another major challenge is the escalating regulatory burden related to sustainability mandates and nutritional transparency requirements. Navigating a fragmented landscape of local health mandates and packaging bans on single-use plastics adds significant administrative overhead. Finally, the sustained volatility of raw material prices and consumer resistance to further price hikes, or input cost volatility, are compressing margins.
  • The necessity to stabilize pricing, even as input costs remain unpredictable, creates an economic trap, forcing a reliance on a barbell menu strategy to balance value with profitability.

Exclusive Technavio Analysis on Customer Landscape

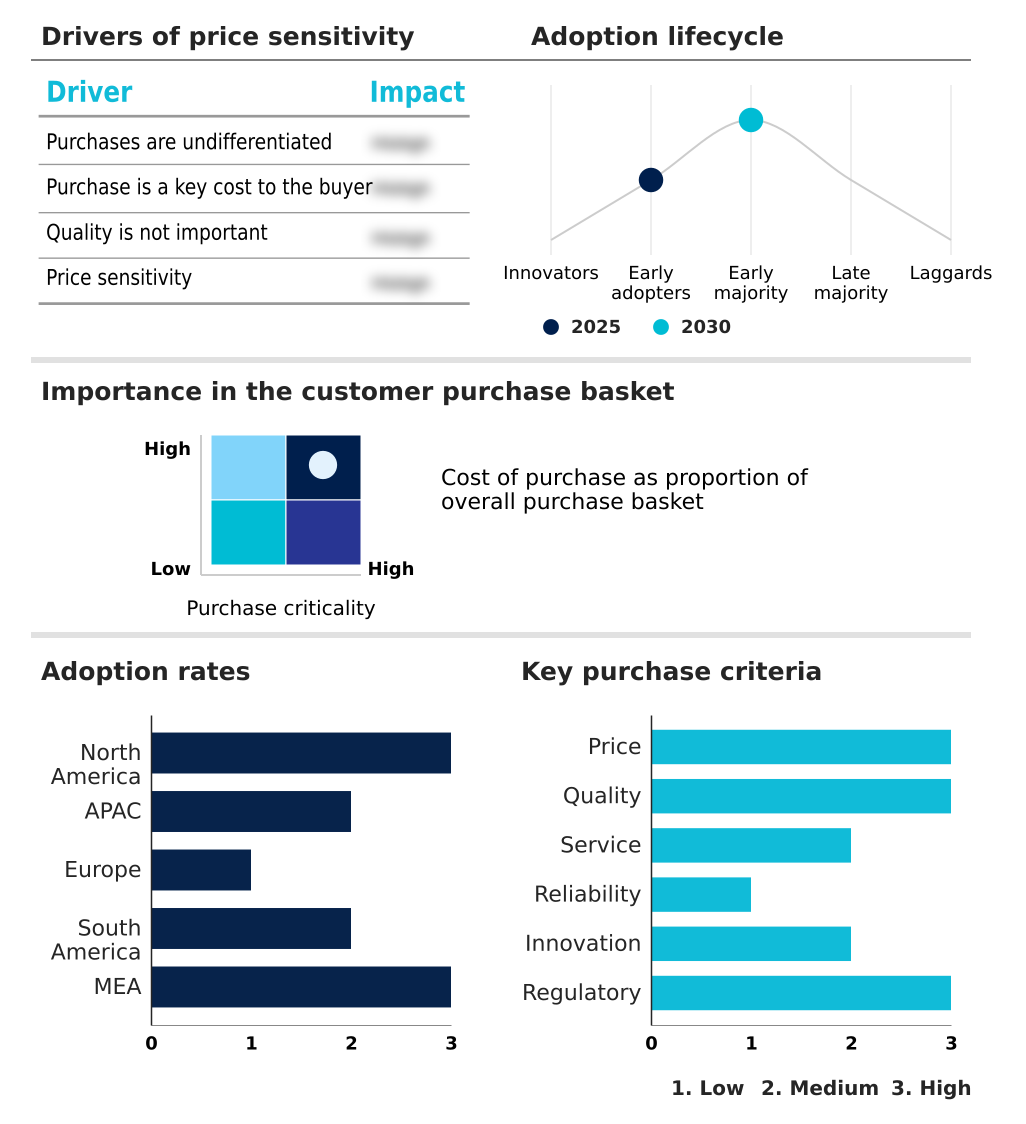
The quick service restaurants market forecasting report includes the adoption lifecycle of the market, covering from the innovator’s stage to the laggard’s stage. It focuses on adoption rates in different regions based on penetration. Furthermore, the quick service restaurants market report also includes key purchase criteria and drivers of price sensitivity to help companies evaluate and develop their market growth analysis strategies.

Customer Landscape of Quick Service Restaurants Industry

Competitive Landscape

Companies are implementing various strategies, such as strategic alliances, quick service restaurants market forecast, partnerships, mergers and acquisitions, geographical expansion, and product/service launches, to enhance their presence in the industry.

American Dairy Queen Corp. - An analyst view indicates a focus on specialized menus featuring fresh, high-quality ingredients delivered through a company-owned, fast-casual operational model, emphasizing food with integrity.

The industry research and growth report includes detailed analyses of the competitive landscape of the market and information about key companies, including:

  • American Dairy Queen Corp.
  • Carls Jr. Restaurants LLC
  • Carrols Restaurant Group Inc.
  • Chick fil A Inc.
  • Chipotle Mexican Grill Inc.
  • Dominos Pizza Inc.
  • Greggs Plc
  • Hardees Restaurants LLC
  • Honeybee Foods Corp.
  • Inspire Brands Inc.
  • Jack in the Box Inc.
  • Little Caesar Enterprises Inc.
  • McDonald Corp.
  • MOS Food Services Inc.
  • Pret A Manger
  • Restaurant Brands Inc.
  • Starbucks Corp.
  • The Wendys Co.
  • YUM Brands Inc.
  • Zaxbys Franchising LLC

Qualitative and quantitative analysis of companies has been conducted to help clients understand the wider business environment as well as the strengths and weaknesses of key industry players. Data is qualitatively analyzed to categorize companies as pure play, category-focused, industry-focused, and diversified; it is quantitatively analyzed to categorize companies as dominant, leading, strong, tentative, and weak.

Recent Development and News in Quick service restaurants market

  • In September, 2024, Chipotle Mexican Grill Inc. announced the successful transition of its Autocado and Augmented Makeline cobotic systems into live restaurant environments, aimed at automating labor-intensive preparation tasks and improving throughput.
  • In November, 2024, Datassential reported that Filipino cuisine emerged as the fastest-growing menu category in the United States, signaling a broader consumer shift toward unique and authentic global flavor profiles.
  • In March, 2025, delivery aggregator Swiggy entered into a strategic partnership with Domino's Pizza Inc. in India to bolster its quick-service offerings, demonstrating increasing collaboration between tech platforms and established food chains.
  • In April, 2025, Church Texas Chicken announced a significant global expansion with the launch of nine hundred new international sites, many featuring specialized beverage stations and regional bakery items to increase average order values.

Dive into Technavio’s robust research methodology, blending expert interviews, extensive data synthesis, and validated models for unparalleled Quick Service Restaurants Market insights. See full methodology.

Market Scope
Page number 305
Base year 2025
Historic period 2020-2024
Forecast period 2026-2030
Growth momentum & CAGR Accelerate at a CAGR of 2.2%
Market growth 2026-2030 USD 65805.0 million
Market structure Fragmented
YoY growth 2025-2026(%) 2.1%
Key countries US, Canada, Mexico, China, India, Japan, South Korea, Australia, Indonesia, Germany, UK, France, Italy, Spain, The Netherlands, Brazil, Argentina, Chile, Saudi Arabia, UAE, South Africa, Turkey and Israel
Competitive landscape Leading Companies, Market Positioning of Companies, Competitive Strategies, and Industry Risks

Request Free Sample

Research Analyst Overview

  • The global quick service restaurants market is defined by a strategic pivot toward digital-first ecosystems and hyper-automation, where market leaders leverage smart restaurant formats. Dominant entities are institutionalizing AI-driven voice assistants and unified commerce platforms that prioritize mobile ordering and data-driven loyalty programs.
  • The landscape is witnessing a massive technological overhaul, including the integration of agentic artificial intelligence for drive-thru ordering and autonomous back-of-house operations. This move to AI-powered restaurant management is a direct response to operational pressures and a core component of boardroom strategy, with capital expenditure for automated kitchen technologies and self-service kiosks directly tied to ESG compliance and profitability goals.
  • Other firms are differentiating through technical innovation; for instance, successfully transitioning robotic kitchen assistants from pilot to live environments to automate labor-intensive tasks and improve peak service times by up to 30%.
  • This competitive environment is further shaped by the digital expansion strategies of delivery-only formats and the growth of virtual brands, all increasingly reliant on integrated delivery platforms, predictive analytics, and hyper-personalized marketing through dynamic pricing models and digital menu boards to maintain consumer frequency.
  • The adoption of high-performance sampling oscilloscopes and high-speed data transceivers underpins the reliability of these sprawling digital networks, from kitchen display systems to frictionless payment methods.

What are the Key Data Covered in this Quick Service Restaurants Market Research and Growth Report?

  • What is the expected growth of the Quick Service Restaurants Market between 2026 and 2030?

    • USD 65.81 billion, at a CAGR of 2.2%

  • What segmentation does the market report cover?

    • The report is segmented by Service (Eat-in service, Takeaway service, Drive-thru service, and Home delivery service), Type (Chain, and Independent), Product Type (Burger and sandwich, Pizza, Asian cuisine, Frozen desserts and ice cream, and Others) and Geography (North America, APAC, Europe, South America, Middle East and Africa)

  • Which regions are analyzed in the report?

    • North America, APAC, Europe, South America and Middle East and Africa

  • What are the key growth drivers and market challenges?

    • Strategic mainstreaming of digital-first ecosystems and hyper-automation, Intensification of labor scarcity and rising cost of workforce retention

  • Who are the major players in the Quick Service Restaurants Market?

    • American Dairy Queen Corp., Carls Jr. Restaurants LLC, Carrols Restaurant Group Inc., Chick fil A Inc., Chipotle Mexican Grill Inc., Dominos Pizza Inc., Greggs Plc, Hardees Restaurants LLC, Honeybee Foods Corp., Inspire Brands Inc., Jack in the Box Inc., Little Caesar Enterprises Inc., McDonald Corp., MOS Food Services Inc., Pret A Manger, Restaurant Brands Inc., Starbucks Corp., The Wendys Co., YUM Brands Inc. and Zaxbys Franchising LLC

Market Research Insights

  • The market's momentum is driven by a strategic pivot toward hyper-personalized loyalty ecosystems, where real-time demand forecasting and data-enabled risk management are standard. This approach moves beyond generic discounts, creating mobile-first dining experiences that have been shown to increase customer frequency by up to 20%.
  • The implementation of a barbell menu strategy is critical for navigating input cost volatility, balancing high-margin premium items with value offerings. This requires sophisticated inventory tracking and nutritional innovation to maintain profitability. Furthermore, the integration of plant-based proteins and clean-label sourcing, now a baseline expectation, aligns with responsible consumption habits and broadens demographic appeal.
  • Operators adopting these strategies report a 10% improvement in brand loyalty metrics.

We can help! Our analysts can customize this quick service restaurants market research report to meet your requirements.

Get in touch

1. Executive Summary

1.1 Market overview

Executive Summary - Chart on Market Overview
Executive Summary - Data Table on Market Overview
Executive Summary - Chart on Global Market Characteristics
Executive Summary - Chart on Market by Geography
Executive Summary - Chart on Market Segmentation by Service
Executive Summary - Chart on Market Segmentation by Type
Executive Summary - Chart on Market Segmentation by Product Type
Executive Summary - Chart on Incremental Growth
Executive Summary - Data Table on Incremental Growth
Executive Summary - Chart on Company Market Positioning

2. Technavio Analysis

2.1 Analysis of price sensitivity, lifecycle, customer purchase basket, adoption rates, and purchase criteria

2.2 Criticality of inputs and Factors of differentiation

Chart on Overview on criticality of inputs and factors of differentiation

2.3 Factors of disruption

Chart on Overview on factors of disruption

2.4 Impact of drivers and challenges

Chart on Impact of drivers and challenges in 2025 and 2030

3. Market Landscape

3.1 Market ecosystem

Chart on Parent Market
Data Table on - Parent Market

3.2 Market characteristics

Chart on Market characteristics analysis

3.3 Value chain analysis

Chart on Value chain analysis

4. Market Sizing

4.1 Market definition

Data Table on Offerings of companies included in the market definition

4.2 Market segment analysis

Market segments

4.3 Market size 2025

4.4 Market outlook: Forecast for 2025-2030

Chart on Global - Market size and forecast 2025-2030 ($ million)
Data Table on Global - Market size and forecast 2025-2030 ($ million)
Chart on Global Market: Year-over-year growth 2025-2030 (%)
Data Table on Global Market: Year-over-year growth 2025-2030 (%)

5. Historic Market Size

5.1 Global Quick Service Restaurants Market 2020 - 2024

Historic Market Size - Data Table on Global Quick Service Restaurants Market 2020 - 2024 ($ million)

5.2 Service segment analysis 2020 - 2024

Historic Market Size - Service Segment 2020 - 2024 ($ million)

5.3 Type segment analysis 2020 - 2024

Historic Market Size - Type Segment 2020 - 2024 ($ million)

5.4 Product Type segment analysis 2020 - 2024

Historic Market Size - Product Type Segment 2020 - 2024 ($ million)

5.5 Geography segment analysis 2020 - 2024

Historic Market Size - Geography Segment 2020 - 2024 ($ million)

5.6 Country segment analysis 2020 - 2024

Historic Market Size - Country Segment 2020 - 2024 ($ million)

6. Qualitative Analysis

6.1 Impact of AI in global quick service restaurants market

6.2 Impact of geopolitical conflict for global quick service restaurants market

7. Five Forces Analysis

7.1 Five forces summary

Five forces analysis - Comparison between 2025 and 2030

7.2 Bargaining power of buyers

Bargaining power of buyers - Impact of key factors 2025 and 2030

7.3 Bargaining power of suppliers

Bargaining power of suppliers - Impact of key factors in 2025 and 2030

7.4 Threat of new entrants

Threat of new entrants - Impact of key factors in 2025 and 2030

7.5 Threat of substitutes

Threat of substitutes - Impact of key factors in 2025 and 2030

7.6 Threat of rivalry

Threat of rivalry - Impact of key factors in 2025 and 2030

7.7 Market condition

Chart on Market condition - Five forces 2025 and 2030

8. Market Segmentation by Service

8.1 Market segments

Chart on Service - Market share 2025-2030 (%)
Data Table on Service - Market share 2025-2030 (%)

8.2 Comparison by Service

Chart on Comparison by Service
Data Table on Comparison by Service

8.3 Eat-in service - Market size and forecast 2025-2030

Chart on Eat-in service - Market size and forecast 2025-2030 ($ million)
Data Table on Eat-in service - Market size and forecast 2025-2030 ($ million)
Chart on Eat-in service - Year-over-year growth 2025-2030 (%)
Data Table on Eat-in service - Year-over-year growth 2025-2030 (%)

8.4 Takeaway service - Market size and forecast 2025-2030

Chart on Takeaway service - Market size and forecast 2025-2030 ($ million)
Data Table on Takeaway service - Market size and forecast 2025-2030 ($ million)
Chart on Takeaway service - Year-over-year growth 2025-2030 (%)
Data Table on Takeaway service - Year-over-year growth 2025-2030 (%)

8.5 Drive-thru service - Market size and forecast 2025-2030

Chart on Drive-thru service - Market size and forecast 2025-2030 ($ million)
Data Table on Drive-thru service - Market size and forecast 2025-2030 ($ million)
Chart on Drive-thru service - Year-over-year growth 2025-2030 (%)
Data Table on Drive-thru service - Year-over-year growth 2025-2030 (%)

8.6 Home delivery service - Market size and forecast 2025-2030

Chart on Home delivery service - Market size and forecast 2025-2030 ($ million)
Data Table on Home delivery service - Market size and forecast 2025-2030 ($ million)
Chart on Home delivery service - Year-over-year growth 2025-2030 (%)
Data Table on Home delivery service - Year-over-year growth 2025-2030 (%)

8.7 Market opportunity by Service

Market opportunity by Service ($ million)
Data Table on Market opportunity by Service ($ million)

9. Market Segmentation by Type

9.1 Market segments

Chart on Type - Market share 2025-2030 (%)
Data Table on Type - Market share 2025-2030 (%)

9.2 Comparison by Type

Chart on Comparison by Type
Data Table on Comparison by Type

9.3 Chain - Market size and forecast 2025-2030

Chart on Chain - Market size and forecast 2025-2030 ($ million)
Data Table on Chain - Market size and forecast 2025-2030 ($ million)
Chart on Chain - Year-over-year growth 2025-2030 (%)
Data Table on Chain - Year-over-year growth 2025-2030 (%)

9.4 Independent - Market size and forecast 2025-2030

Chart on Independent - Market size and forecast 2025-2030 ($ million)
Data Table on Independent - Market size and forecast 2025-2030 ($ million)
Chart on Independent - Year-over-year growth 2025-2030 (%)
Data Table on Independent - Year-over-year growth 2025-2030 (%)

9.5 Market opportunity by Type

Market opportunity by Type ($ million)
Data Table on Market opportunity by Type ($ million)

10. Market Segmentation by Product Type

10.1 Market segments

Chart on Product Type - Market share 2025-2030 (%)
Data Table on Product Type - Market share 2025-2030 (%)

10.2 Comparison by Product Type

Chart on Comparison by Product Type
Data Table on Comparison by Product Type

10.3 Burger and sandwich - Market size and forecast 2025-2030

Chart on Burger and sandwich - Market size and forecast 2025-2030 ($ million)
Data Table on Burger and sandwich - Market size and forecast 2025-2030 ($ million)
Chart on Burger and sandwich - Year-over-year growth 2025-2030 (%)
Data Table on Burger and sandwich - Year-over-year growth 2025-2030 (%)

10.4 Pizza - Market size and forecast 2025-2030

Chart on Pizza - Market size and forecast 2025-2030 ($ million)
Data Table on Pizza - Market size and forecast 2025-2030 ($ million)
Chart on Pizza - Year-over-year growth 2025-2030 (%)
Data Table on Pizza - Year-over-year growth 2025-2030 (%)

10.5 Asian cuisine - Market size and forecast 2025-2030

Chart on Asian cuisine - Market size and forecast 2025-2030 ($ million)
Data Table on Asian cuisine - Market size and forecast 2025-2030 ($ million)
Chart on Asian cuisine - Year-over-year growth 2025-2030 (%)
Data Table on Asian cuisine - Year-over-year growth 2025-2030 (%)

10.6 Frozen desserts and ice cream - Market size and forecast 2025-2030

Chart on Frozen desserts and ice cream - Market size and forecast 2025-2030 ($ million)
Data Table on Frozen desserts and ice cream - Market size and forecast 2025-2030 ($ million)
Chart on Frozen desserts and ice cream - Year-over-year growth 2025-2030 (%)
Data Table on Frozen desserts and ice cream - Year-over-year growth 2025-2030 (%)

10.7 Others - Market size and forecast 2025-2030

Chart on Others - Market size and forecast 2025-2030 ($ million)
Data Table on Others - Market size and forecast 2025-2030 ($ million)
Chart on Others - Year-over-year growth 2025-2030 (%)
Data Table on Others - Year-over-year growth 2025-2030 (%)

10.8 Market opportunity by Product Type

Market opportunity by Product Type ($ million)
Data Table on Market opportunity by Product Type ($ million)

11. Customer Landscape

11.1 Customer landscape overview

Analysis of price sensitivity, lifecycle, customer purchase basket, adoption rates, and purchase criteria

12. Geographic Landscape

12.1 Geographic segmentation

Chart on Market share by geography 2025-2030 (%)
Data Table on Market share by geography 2025-2030 (%)

12.2 Geographic comparison

Chart on Geographic comparison
Data Table on Geographic comparison

12.3 North America - Market size and forecast 2025-2030

Chart on North America - Market size and forecast 2025-2030 ($ million)
Data Table on North America - Market size and forecast 2025-2030 ($ million)
Chart on North America - Year-over-year growth 2025-2030 (%)
Data Table on North America - Year-over-year growth 2025-2030 (%)
Chart on Regional Comparison - North America
Data Table on Regional Comparison - North America

12.3.1 US - Market size and forecast 2025-2030

Chart on US - Market size and forecast 2025-2030 ($ million)
Data Table on US - Market size and forecast 2025-2030 ($ million)
Chart on US - Year-over-year growth 2025-2030 (%)
Data Table on US - Year-over-year growth 2025-2030 (%)

12.3.2 Canada - Market size and forecast 2025-2030

Chart on Canada - Market size and forecast 2025-2030 ($ million)
Data Table on Canada - Market size and forecast 2025-2030 ($ million)
Chart on Canada - Year-over-year growth 2025-2030 (%)
Data Table on Canada - Year-over-year growth 2025-2030 (%)

12.3.3 Mexico - Market size and forecast 2025-2030

Chart on Mexico - Market size and forecast 2025-2030 ($ million)
Data Table on Mexico - Market size and forecast 2025-2030 ($ million)
Chart on Mexico - Year-over-year growth 2025-2030 (%)
Data Table on Mexico - Year-over-year growth 2025-2030 (%)

12.4 APAC - Market size and forecast 2025-2030

Chart on APAC - Market size and forecast 2025-2030 ($ million)
Data Table on APAC - Market size and forecast 2025-2030 ($ million)
Chart on APAC - Year-over-year growth 2025-2030 (%)
Data Table on APAC - Year-over-year growth 2025-2030 (%)
Chart on Regional Comparison - APAC
Data Table on Regional Comparison - APAC

12.4.1 China - Market size and forecast 2025-2030

Chart on China - Market size and forecast 2025-2030 ($ million)
Data Table on China - Market size and forecast 2025-2030 ($ million)
Chart on China - Year-over-year growth 2025-2030 (%)
Data Table on China - Year-over-year growth 2025-2030 (%)

12.4.2 India - Market size and forecast 2025-2030

Chart on India - Market size and forecast 2025-2030 ($ million)
Data Table on India - Market size and forecast 2025-2030 ($ million)
Chart on India - Year-over-year growth 2025-2030 (%)
Data Table on India - Year-over-year growth 2025-2030 (%)

12.4.3 Japan - Market size and forecast 2025-2030

Chart on Japan - Market size and forecast 2025-2030 ($ million)
Data Table on Japan - Market size and forecast 2025-2030 ($ million)
Chart on Japan - Year-over-year growth 2025-2030 (%)
Data Table on Japan - Year-over-year growth 2025-2030 (%)

12.4.4 South Korea - Market size and forecast 2025-2030

Chart on South Korea - Market size and forecast 2025-2030 ($ million)
Data Table on South Korea - Market size and forecast 2025-2030 ($ million)
Chart on South Korea - Year-over-year growth 2025-2030 (%)
Data Table on South Korea - Year-over-year growth 2025-2030 (%)

12.4.5 Australia - Market size and forecast 2025-2030

Chart on Australia - Market size and forecast 2025-2030 ($ million)
Data Table on Australia - Market size and forecast 2025-2030 ($ million)
Chart on Australia - Year-over-year growth 2025-2030 (%)
Data Table on Australia - Year-over-year growth 2025-2030 (%)

12.4.6 Indonesia - Market size and forecast 2025-2030

Chart on Indonesia - Market size and forecast 2025-2030 ($ million)
Data Table on Indonesia - Market size and forecast 2025-2030 ($ million)
Chart on Indonesia - Year-over-year growth 2025-2030 (%)
Data Table on Indonesia - Year-over-year growth 2025-2030 (%)

12.5 Europe - Market size and forecast 2025-2030

Chart on Europe - Market size and forecast 2025-2030 ($ million)
Data Table on Europe - Market size and forecast 2025-2030 ($ million)
Chart on Europe - Year-over-year growth 2025-2030 (%)
Data Table on Europe - Year-over-year growth 2025-2030 (%)
Chart on Regional Comparison - Europe
Data Table on Regional Comparison - Europe

12.5.1 Germany - Market size and forecast 2025-2030

Chart on Germany - Market size and forecast 2025-2030 ($ million)
Data Table on Germany - Market size and forecast 2025-2030 ($ million)
Chart on Germany - Year-over-year growth 2025-2030 (%)
Data Table on Germany - Year-over-year growth 2025-2030 (%)

12.5.2 UK - Market size and forecast 2025-2030

Chart on UK - Market size and forecast 2025-2030 ($ million)
Data Table on UK - Market size and forecast 2025-2030 ($ million)
Chart on UK - Year-over-year growth 2025-2030 (%)
Data Table on UK - Year-over-year growth 2025-2030 (%)

12.5.3 France - Market size and forecast 2025-2030

Chart on France - Market size and forecast 2025-2030 ($ million)
Data Table on France - Market size and forecast 2025-2030 ($ million)
Chart on France - Year-over-year growth 2025-2030 (%)
Data Table on France - Year-over-year growth 2025-2030 (%)

12.5.4 Italy - Market size and forecast 2025-2030

Chart on Italy - Market size and forecast 2025-2030 ($ million)
Data Table on Italy - Market size and forecast 2025-2030 ($ million)
Chart on Italy - Year-over-year growth 2025-2030 (%)
Data Table on Italy - Year-over-year growth 2025-2030 (%)

12.5.5 Spain - Market size and forecast 2025-2030

Chart on Spain - Market size and forecast 2025-2030 ($ million)
Data Table on Spain - Market size and forecast 2025-2030 ($ million)
Chart on Spain - Year-over-year growth 2025-2030 (%)
Data Table on Spain - Year-over-year growth 2025-2030 (%)

12.5.6 The Netherlands - Market size and forecast 2025-2030

Chart on The Netherlands - Market size and forecast 2025-2030 ($ million)
Data Table on The Netherlands - Market size and forecast 2025-2030 ($ million)
Chart on The Netherlands - Year-over-year growth 2025-2030 (%)
Data Table on The Netherlands - Year-over-year growth 2025-2030 (%)

12.6 South America - Market size and forecast 2025-2030

Chart on South America - Market size and forecast 2025-2030 ($ million)
Data Table on South America - Market size and forecast 2025-2030 ($ million)
Chart on South America - Year-over-year growth 2025-2030 (%)
Data Table on South America - Year-over-year growth 2025-2030 (%)
Chart on Regional Comparison - South America
Data Table on Regional Comparison - South America

12.6.1 Brazil - Market size and forecast 2025-2030

Chart on Brazil - Market size and forecast 2025-2030 ($ million)
Data Table on Brazil - Market size and forecast 2025-2030 ($ million)
Chart on Brazil - Year-over-year growth 2025-2030 (%)
Data Table on Brazil - Year-over-year growth 2025-2030 (%)

12.6.2 Argentina - Market size and forecast 2025-2030

Chart on Argentina - Market size and forecast 2025-2030 ($ million)
Data Table on Argentina - Market size and forecast 2025-2030 ($ million)
Chart on Argentina - Year-over-year growth 2025-2030 (%)
Data Table on Argentina - Year-over-year growth 2025-2030 (%)

12.6.3 Chile - Market size and forecast 2025-2030

Chart on Chile - Market size and forecast 2025-2030 ($ million)
Data Table on Chile - Market size and forecast 2025-2030 ($ million)
Chart on Chile - Year-over-year growth 2025-2030 (%)
Data Table on Chile - Year-over-year growth 2025-2030 (%)

12.7 Middle East and Africa - Market size and forecast 2025-2030

Chart on Middle East and Africa - Market size and forecast 2025-2030 ($ million)
Data Table on Middle East and Africa - Market size and forecast 2025-2030 ($ million)
Chart on Middle East and Africa - Year-over-year growth 2025-2030 (%)
Data Table on Middle East and Africa - Year-over-year growth 2025-2030 (%)
Chart on Regional Comparison - Middle East and Africa
Data Table on Regional Comparison - Middle East and Africa

12.7.1 Saudi Arabia - Market size and forecast 2025-2030

Chart on Saudi Arabia - Market size and forecast 2025-2030 ($ million)
Data Table on Saudi Arabia - Market size and forecast 2025-2030 ($ million)
Chart on Saudi Arabia - Year-over-year growth 2025-2030 (%)
Data Table on Saudi Arabia - Year-over-year growth 2025-2030 (%)

12.7.2 UAE - Market size and forecast 2025-2030

Chart on UAE - Market size and forecast 2025-2030 ($ million)
Data Table on UAE - Market size and forecast 2025-2030 ($ million)
Chart on UAE - Year-over-year growth 2025-2030 (%)
Data Table on UAE - Year-over-year growth 2025-2030 (%)

12.7.3 South Africa - Market size and forecast 2025-2030

Chart on South Africa - Market size and forecast 2025-2030 ($ million)
Data Table on South Africa - Market size and forecast 2025-2030 ($ million)
Chart on South Africa - Year-over-year growth 2025-2030 (%)
Data Table on South Africa - Year-over-year growth 2025-2030 (%)

12.7.4 Turkey - Market size and forecast 2025-2030

Chart on Turkey - Market size and forecast 2025-2030 ($ million)
Data Table on Turkey - Market size and forecast 2025-2030 ($ million)
Chart on Turkey - Year-over-year growth 2025-2030 (%)
Data Table on Turkey - Year-over-year growth 2025-2030 (%)

12.7.5 Israel - Market size and forecast 2025-2030

Chart on Israel - Market size and forecast 2025-2030 ($ million)
Data Table on Israel - Market size and forecast 2025-2030 ($ million)
Chart on Israel - Year-over-year growth 2025-2030 (%)
Data Table on Israel - Year-over-year growth 2025-2030 (%)

12.8 Market opportunity by geography

Market opportunity by geography ($ million)
Data Tables on Market opportunity by geography ($ million)

13. Drivers, Challenges, and Opportunity

13.1 Market drivers

Strategic mainstreaming of digital-first ecosystems and hyper-automation
Shifting consumer appetites toward personalized wellness and functional nutrition
Industrialization of sustainability and circular economy packaging mandates

13.2 Market challenges

Intensification of labor scarcity and rising cost of workforce retention
Regulatory burden of sustainability mandates and nutritional transparency requirements
Persistence of input cost volatility and limitation of pricing power

13.3 Impact of drivers and challenges

Impact of drivers and challenges in 2025 and 2030

13.4 Market opportunities

Integration of agentic AI and autonomous back-of-house operations
Growth of hyper-personalized loyalty ecosystems and dynamic pricing models
Expansion of sustainable circularity and plant-forward hybridization

14. Competitive Landscape

14.1 Overview

14.2

Overview on criticality of inputs and factors of differentiation

14.3 Landscape disruption

Overview on factors of disruption

14.4 Industry risks

Impact of key risks on business

15. Competitive Analysis

15.1 Companies profiled

Companies covered

15.2 Company ranking index

15.3 Market positioning of companies

Matrix on companies position and classification

15.4 Carls Jr. Restaurants LLC

Carls Jr. Restaurants LLC - Overview
Carls Jr. Restaurants LLC - Product / Service
Carls Jr. Restaurants LLC - Key offerings
SWOT

15.5 Chick fil A Inc.

Chick fil A Inc. - Overview
Chick fil A Inc. - Product / Service
Chick fil A Inc. - Key offerings
SWOT

15.6 Chipotle Mexican Grill Inc.

Chipotle Mexican Grill Inc. - Overview
Chipotle Mexican Grill Inc. - Product / Service
Chipotle Mexican Grill Inc. - Key offerings
SWOT

15.7 Dominos Pizza Inc.

Dominos Pizza Inc. - Overview
Dominos Pizza Inc. - Business segments
Dominos Pizza Inc. - Key offerings
Dominos Pizza Inc. - Segment focus
SWOT

15.8 Greggs Plc

Greggs Plc - Overview
Greggs Plc - Business segments
Greggs Plc - Key offerings
Greggs Plc - Segment focus
SWOT

15.9 Honeybee Foods Corp.

Honeybee Foods Corp. - Overview
Honeybee Foods Corp. - Product / Service
Honeybee Foods Corp. - Key offerings
SWOT

15.10 Inspire Brands Inc.

Inspire Brands Inc. - Overview
Inspire Brands Inc. - Product / Service
Inspire Brands Inc. - Key offerings
SWOT

15.11 Jack in the Box Inc.

Jack in the Box Inc. - Overview
Jack in the Box Inc. - Business segments
Jack in the Box Inc. - Key offerings
Jack in the Box Inc. - Segment focus
SWOT

15.12 McDonald Corp.

McDonald Corp. - Overview
McDonald Corp. - Business segments
McDonald Corp. - Key offerings
McDonald Corp. - Segment focus
SWOT

15.13 MOS Food Services Inc.

MOS Food Services Inc. - Overview
MOS Food Services Inc. - Product / Service
MOS Food Services Inc. - Key offerings
SWOT

15.14 Restaurant Brands Inc.

Restaurant Brands Inc. - Overview
Restaurant Brands Inc. - Business segments
Restaurant Brands Inc. - Key offerings
Restaurant Brands Inc. - Segment focus
SWOT

15.15 Starbucks Corp.

Starbucks Corp. - Overview
Starbucks Corp. - Business segments
Starbucks Corp. - Key offerings
Starbucks Corp. - Segment focus
SWOT

15.16 The Wendys Co.

The Wendys Co. - Overview
The Wendys Co. - Business segments
The Wendys Co. - Key offerings
The Wendys Co. - Segment focus
SWOT

15.17 YUM Brands Inc.

YUM Brands Inc. - Overview
YUM Brands Inc. - Business segments
YUM Brands Inc. - Key offerings
YUM Brands Inc. - Segment focus
SWOT

15.18 Zaxbys Franchising LLC

Zaxbys Franchising LLC - Overview
Zaxbys Franchising LLC - Product / Service
Zaxbys Franchising LLC - Key offerings
SWOT

16. Appendix

16.1 Scope of the report

Market definition
Objectives
Notes and caveats

16.2 Inclusions and exclusions checklist

Inclusions checklist
Exclusions checklist

16.3 Currency conversion rates for US$

16.4 Research methodology

16.5 Data procurement

Information sources

16.6 Data validation

16.7 Validation techniques employed for market sizing

16.8 Data synthesis

16.9 360 degree market analysis

16.10 List of abbreviations

Research Methodology

Technavio presents a detailed picture of the market by way of study, synthesis, and summation of data from multiple sources. The analysts have presented the various facets of the market with a particular focus on identifying the key industry influencers. The data thus presented is comprehensive, reliable, and the result of extensive research, both primary and secondary.

INFORMATION SOURCES

Primary sources

  • Manufacturers and suppliers
  • Channel partners
  • Industry experts
  • Strategic decision makers

Secondary sources

  • Industry journals and periodicals
  • Government data
  • Financial reports of key industry players
  • Historical data
  • Press releases

DATA ANALYSIS

Data Synthesis

  • Collation of data
  • Estimation of key figures
  • Analysis of derived insights

Data Validation

  • Triangulation with data models
  • Reference against proprietary databases
  • Corroboration with industry experts

REPORT WRITING

Qualitative

  • Market drivers
  • Market challenges
  • Market trends
  • Five forces analysis

Quantitative

  • Market size and forecast
  • Market segmentation
  • Geographical insights
  • Competitive landscape

Interested in this report?

Get your sample now to see our research methodology and insights!

Download Now

Frequently Asked Questions

Quick Service Restaurants market growth will increase by USD 65805.0 million during 2026-2030.

The Quick Service Restaurants market is expected to grow at a CAGR of 2.2% during 2026-2030.

Quick Service Restaurants market is segmented by Service (Eat-in service, Takeaway service, Drive-thru service, Home delivery service) Type (Chain, Independent) Product type (Burger and sandwich, Pizza, Asian cuisine, Frozen desserts and ice cream, Others)

American Dairy Queen Corp., Carls Jr. Restaurants LLC, Carrols Restaurant Group Inc., Chick fil A Inc., Chipotle Mexican Grill Inc., Dominos Pizza Inc., Greggs Plc, Hardees Restaurants LLC, Honeybee Foods Corp., Inspire Brands Inc., Jack in the Box Inc., Little Caesar Enterprises Inc., McDonald Corp., MOS Food Services Inc., Pret A Manger, Restaurant Brands Inc., Starbucks Corp., The Wendys Co., YUM Brands Inc., Zaxbys Franchising LLC are a few of the key vendors in the Quick Service Restaurants market.

APAC will register the highest growth rate of 42.3% among the other regions. Therefore, the Quick Service Restaurants market in APAC is expected to garner significant business opportunities for the vendors during the forecast period.

US, Canada, Mexico, China, India, Japan, South Korea, Australia, Indonesia, Germany, UK, France, Italy, Spain, The Netherlands, Brazil, Argentina, Chile, Saudi Arabia, UAE, South Africa, Turkey, Israel

  • Strategic mainstreaming of digital-first ecosystems and hyper-automation is the driving factor this market.

The Quick Service Restaurants market vendors should focus on grabbing business opportunities from the Service segment as it accounted for the largest market share in the base year.
RIA - Research AI Assistant
Ask RIA