Radiosurgery And Radiotherapy Robotics Market Analysis, Size, and Forecast 2026-2030: North America (US, Canada, and Mexico), Europe (Germany, UK, and France), APAC (China, Japan, and India), Middle East and Africa (Saudi Arabia, UAE, and South Africa), South America (Brazil, Argentina, and Colombia), and Rest of World (ROW)

Radiosurgery And Radiotherapy Robotics Market Analysis, Size, and Forecast 2026-2030:
North America (US, Canada, and Mexico), Europe (Germany, UK, and France), APAC (China, Japan, and India), Middle East and Africa (Saudi Arabia, UAE, and South Africa), South America (Brazil, Argentina, and Colombia), and Rest of World (ROW)

Published: Dec 2025 292 Pages SKU: IRTNTR70009

Market Overview at a Glance

$1.03 B
Market Opportunity
5.6%
CAGR 2025 - 2030
38.6%
North America Growth
$2.62 B
X-ray based segment 2024

Radiosurgery And Radiotherapy Robotics Market Size 2026-2030

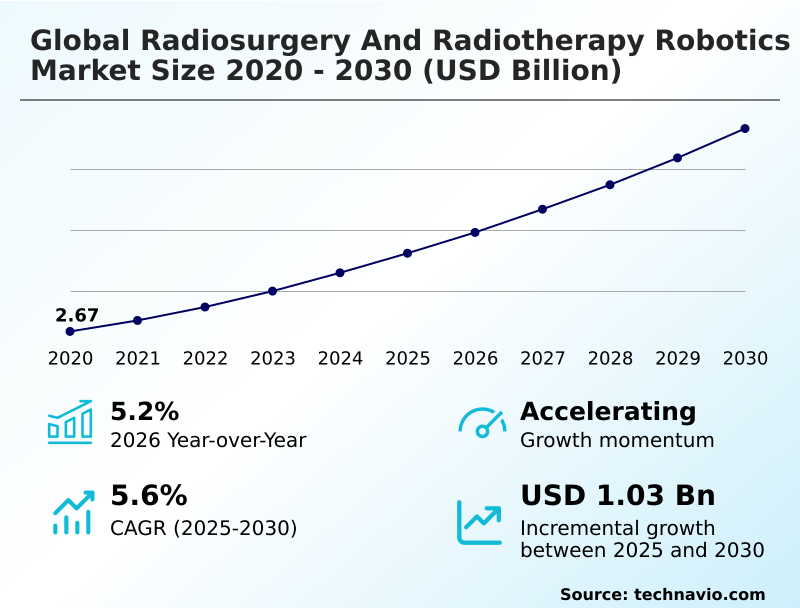
The radiosurgery and radiotherapy robotics market size is valued to increase by USD 1.03 billion, at a CAGR of 5.6% from 2025 to 2030. Increase in cancer cases and re-treatments will drive the radiosurgery and radiotherapy robotics market.

Major Market Trends & Insights

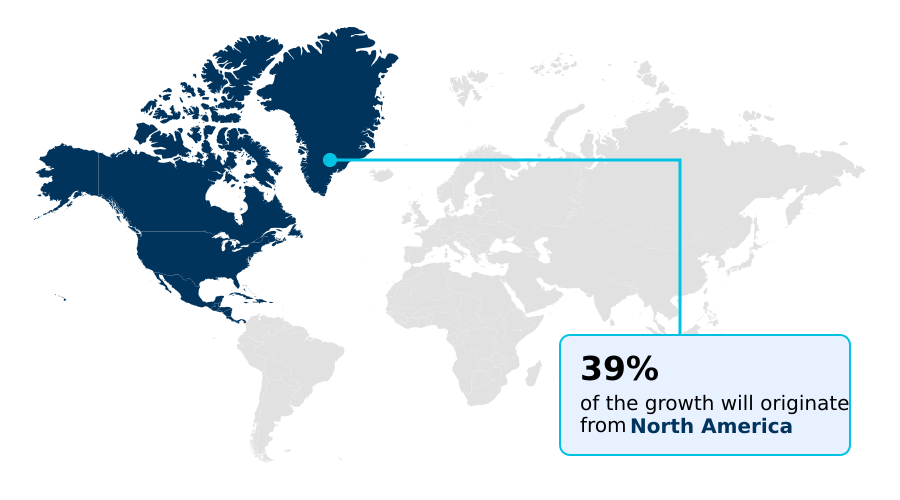
  • North America dominated the market and accounted for a 38.6% growth during the forecast period.
  • By Type - X-ray based segment was valued at USD 2.62 billion in 2024
  • By End-user - Hospitals segment accounted for the largest market revenue share in 2024

Market Size & Forecast

  • Market Opportunities: USD 1.66 billion
  • Market Future Opportunities: USD 1.03 billion
  • CAGR from 2025 to 2030 : 5.6%

Market Summary

  • The radiosurgery and radiotherapy robotics market is defined by a relentless drive for greater precision and efficiency in cancer care. This evolution is propelled by the rising incidence of cancer and the increasing demand for non-invasive tumor treatment options that minimize side effects and shorten recovery times.
  • Key innovations center on advanced radiotherapy techniques, including stereotactic body radiation therapy and mr-guided radiotherapy, which rely on sophisticated motion management solutions and real-time tumor tracking to deliver ablative doses with sub-millimeter treatment accuracy.
  • For instance, in a clinical scenario involving early-stage lung cancer, robotic systems with respiratory motion synchronization can precisely target the tumor as it moves, reducing radiation-induced toxicity to healthy lung tissue. This capability supports the trend of hypofractionated radiotherapy, allowing for shorter treatment courses.
  • However, the high capital equipment procurement costs and the need for specialized oncology centers create significant adoption barriers, particularly in emerging economies. The market is also shaped by the ongoing development of alternative modalities like proton beam therapy systems, which challenge photon-based radiosurgery platforms to demonstrate superior cost-effectiveness and patient outcomes.

What will be the Size of the Radiosurgery And Radiotherapy Robotics Market during the forecast period?

Get Key Insights on Market Forecast (PDF) Request Free Sample

How is the Radiosurgery And Radiotherapy Robotics Market Segmented?

The radiosurgery and radiotherapy robotics industry research report provides comprehensive data (region-wise segment analysis), with forecasts and estimates in "USD million" for the period 2026-2030, as well as historical data from 2020-2024 for the following segments.

  • Type
    • X-ray based
    • Gamma-ray based
  • End-user
    • Hospitals
    • Clinics
    • Independent radiotherapy centers
  • Application
    • Lung cancer
    • Prostate cancer
    • Breast cancer
    • Others
  • Geography
    • North America
      • US
      • Canada
      • Mexico
    • Europe
      • Germany
      • UK
      • France
    • APAC
      • China
      • Japan
      • India
    • Middle East and Africa
      • Saudi Arabia
      • UAE
      • South Africa
    • South America
      • Brazil
      • Argentina
      • Colombia
    • Rest of World (ROW)

By Type Insights

The x-ray based segment is estimated to witness significant growth during the forecast period.

The X-ray-based segment, centered on linear accelerator technology, is foundational to the radiosurgery and radiotherapy robotics market. These systems are preferred for their operational versatility and for avoiding the logistical complexities of radioactive source management.

The integration of robotic arms and advanced couches enables non-isocentric beam delivery with sub-millimeter treatment accuracy, crucial for stereotactic body radiation therapy. Advanced platforms now incorporate real-time tumor tracking and motion management solutions to treat targets in mobile organs.

Innovations in adaptive radiotherapy planning allow for on-the-fly adjustments, with some systems demonstrating a 15% improvement in dose conformity to the target volume.

This capability, combined with hypofractionated radiotherapy schedules, enhances patient treatment throughput, making these systems a cost-effective cornerstone for specialized oncology centers.

Request Free Sample

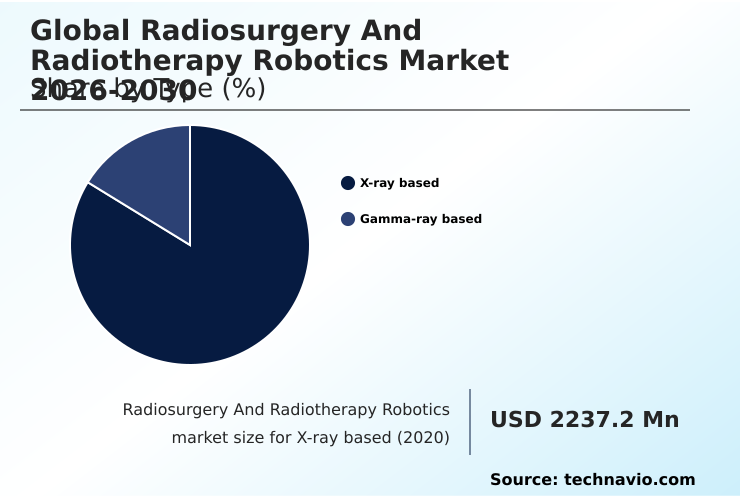
The X-ray based segment was valued at USD 2.62 billion in 2024 and showed a gradual increase during the forecast period.

Request Free Sample

Regional Analysis

North America is estimated to contribute 38.6% to the growth of the global market during the forecast period.Technavio’s analysts have elaborately explained the regional trends and drivers that shape the market during the forecast period.

See How Radiosurgery And Radiotherapy Robotics Market Demand is Rising in North America Request Free Sample

The global geographic landscape is led by North America, which is projected to contribute 38% of the market's incremental growth, driven by its advanced healthcare infrastructure modernization and high adoption rate of precision oncology platforms.

Europe follows, with countries like Germany and the UK investing in linear accelerator technology and mr-guided radiotherapy. Meanwhile, the APAC region is the fastest-growing, with a CAGR of 6.6%, fueled by rising healthcare expenditure in China and India.

This growth supports the build-out of specialized oncology centers and the adoption of technologies like stereotactic ablative radiotherapy.

In contrast, adoption in South America and the Middle East and Africa is more fragmented, often limited to major urban centers and dependent on both public funding and private investment in capital equipment procurement for robotic cancer care.

Market Dynamics

Our researchers analyzed the data with 2025 as the base year, along with the key drivers, trends, and challenges. A holistic analysis of drivers will help companies refine their marketing strategies to gain a competitive advantage.

  • Strategic decision-making in the radiosurgery and radiotherapy robotics market is increasingly influenced by detailed evaluations of specific clinical applications and technologies. For example, the cost-effectiveness of robotic radiosurgery is a key consideration, with analyses often comparing LINAC SRS and Gamma Knife to determine the optimal platform for different intracranial indications.
  • For extracranial targets, SBRT for early-stage lung cancer has become a standard of care, where effective motion management in prostate radiotherapy is crucial for minimizing toxicity. The complexity of adaptive planning for head and neck cancer highlights the need for advanced software and imaging.
  • While proton therapy for pediatric tumors offers distinct advantages, the challenges in commissioning MR-LINAC systems can delay implementation. Improving workflow efficiency in radiosurgery centers is a constant goal, as is reducing toxicity with robotic SBRT to enhance patient outcomes with non-invasive SRS.
  • The application of robotic radiotherapy for liver metastases is growing, though reimbursement policies for stereotactic radiosurgery remain a critical factor. Furthermore, the extensive training requirements for robotic radiotherapy and the need for rigorous quality assurance for robotic radiotherapy are significant operational considerations for healthcare providers.
  • The integration of AI in treatment planning is seen as a pivotal step in managing the role of robotics in re-irradiation cases and improving overall treatment delivery.

What are the key market drivers leading to the rise in the adoption of Radiosurgery And Radiotherapy Robotics Industry?

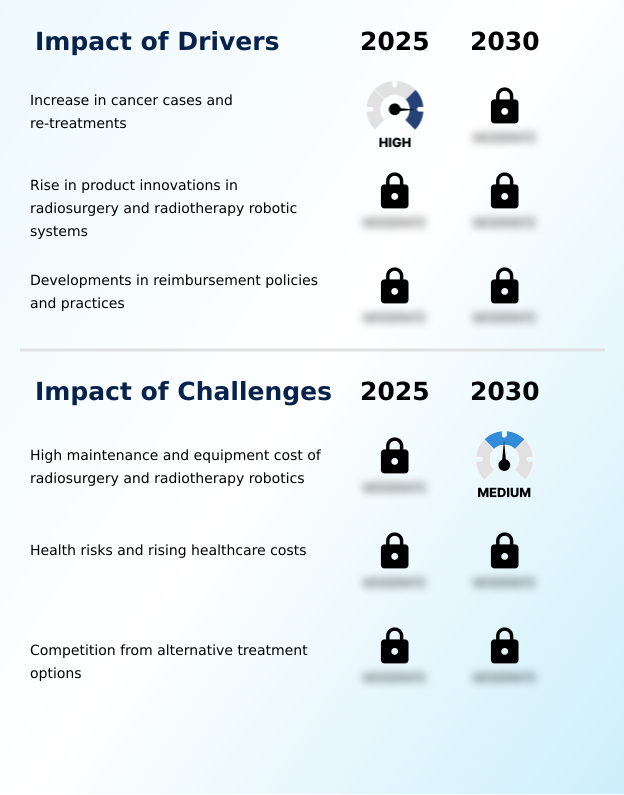
  • The rising global incidence of cancer and a growing number of cases requiring retreatment are key drivers fueling the demand for advanced radiosurgery and radiotherapy solutions.

  • Market growth is fundamentally driven by the rising global cancer incidence and the increasing demand for non-invasive tumor treatment options.
  • Product innovations are reshaping the landscape, with a focus on integrating high-definition imaging and real-time tumor tracking into precision oncology platforms. This allows for the safe delivery of a higher therapeutic radiation dose.
  • The development of more favorable reimbursement policies is also accelerating adoption, making advanced robotic cancer care more accessible.
  • For instance, streamlined medical device regulation in key markets has reduced approval times by up to 30%, speeding the availability of new technologies.
  • These factors combined are expanding the use of stereotactic body radiation therapy and other advanced modalities, meeting the needs of a growing patient population.

What are the market trends shaping the Radiosurgery And Radiotherapy Robotics Industry?

  • The emergence of advanced radiotherapy treatments, such as intensity-modulated and image-guided therapies, represents a significant market trend. These innovations are enhancing treatment precision and overall patient safety.

  • The market is advancing through the adoption of sophisticated technologies that enhance treatment precision and patient safety. Innovations like volumetric modulated arc therapy and image-guided radiotherapy are becoming standard, enabling high-precision radiation delivery to tumors while minimizing exposure to healthy tissue.
  • The growing demand for extracranial radiosurgery applications is driving the development of robotic systems capable of sub-millimeter treatment accuracy for organs such as the liver and lung. This trend is supported by advanced radiotherapy techniques, with some centers reporting a 20% reduction in treatment-related side effects for complex cases.
  • Furthermore, the integration of AI is optimizing radiation oncology workflow, leading to faster and more accurate radiosurgery treatment planning. This focus on both efficacy and efficiency is reshaping clinical treatment protocols globally.

What challenges does the Radiosurgery And Radiotherapy Robotics Industry face during its growth?

  • The substantial equipment and maintenance costs associated with radiosurgery and radiotherapy robotics present a key challenge that can hinder widespread market adoption and growth.

  • The high cost of capital equipment procurement and maintenance remains a significant barrier to market expansion, particularly in emerging economies with limited healthcare infrastructure modernization. Hospitals face substantial upfront investments, and recurring expenses for service and training further strain budgets.
  • This financial pressure is compounded by competition from alternative treatments like brachytherapy and proton therapy, which are sometimes perceived as more cost-effective for certain indications. The complexity of these robotic systems also necessitates specialized expertise, creating a skills gap in some regions.
  • Consequently, despite the proven benefits of high-precision radiation delivery, which can reduce certain long-term toxicities by 15%, cost and operational hurdles limit widespread adoption.

Exclusive Technavio Analysis on Customer Landscape

The radiosurgery and radiotherapy robotics market forecasting report includes the adoption lifecycle of the market, covering from the innovator’s stage to the laggard’s stage. It focuses on adoption rates in different regions based on penetration. Furthermore, the radiosurgery and radiotherapy robotics market report also includes key purchase criteria and drivers of price sensitivity to help companies evaluate and develop their market growth analysis strategies.

Customer Landscape of Radiosurgery And Radiotherapy Robotics Industry

Competitive Landscape

Companies are implementing various strategies, such as strategic alliances, radiosurgery and radiotherapy robotics market forecast, partnerships, mergers and acquisitions, geographical expansion, and product/service launches, to enhance their presence in the industry.

Accuray Inc. - Key offerings include advanced robotic platforms for radiosurgery and radiotherapy, designed to deliver non-invasive, high-precision tumor treatments with enhanced accuracy and efficiency.

The industry research and growth report includes detailed analyses of the competitive landscape of the market and information about key companies, including:

  • Accuray Inc.
  • Advanced Oncotherapy plc
  • Best Medical International Inc.
  • Brainlab AG
  • Elekta AB
  • Hitachi Ltd.
  • Mevion Medical Systems Inc.
  • Mitsubishi Electric Corp.
  • Neusoft Corp.
  • Optivus Proton Therapy Inc.
  • Panacea Medical Tech Pvt. Ltd.
  • PMB Alcen
  • ProTom Holding Corp.
  • Siemens Healthineers AG
  • Varian Medical Systems Inc.
  • ViewRay Inc.
  • ZAP Surgical Systems Inc.

Qualitative and quantitative analysis of companies has been conducted to help clients understand the wider business environment as well as the strengths and weaknesses of key industry players. Data is qualitatively analyzed to categorize companies as pure play, category-focused, industry-focused, and diversified; it is quantitatively analyzed to categorize companies as dominant, leading, strong, tentative, and weak.

Recent Development and News in Radiosurgery and radiotherapy robotics market

  • In May 2025, Elekta AB presented preliminary results from the ERECT clinical trial at the ESTRO annual congress, demonstrating that its 1.5T Elekta Unity MR-Linac significantly reduced erectile dysfunction in prostate cancer patients by enabling precise visualization and sparing of neurovascular structures.
  • In July 2025, Elekta received U.S. FDA 510(k) clearance for its Leksell Gamma Knife radiosurgery system to treat refractory, intractable mesial temporal lobe epilepsy, expanding its application beyond traditional oncology.
  • In September 2025, Varian, a Siemens Healthineers company, announced significant enhancements to its Halcyon treatment platform, including the PerfectKinetix Dynamic Couch and improved real-time imaging capabilities, designed to improve motion management and treatment accuracy.
  • In November 2025, ZAP Surgical Systems Inc. received United States Food and Drug Administration 510(k) clearance and European CE certification for its ZAP Axon Radiosurgery Planning System, streamlining workflow for its vault-free cranial robotic radiosurgery platform.

Dive into Technavio’s robust research methodology, blending expert interviews, extensive data synthesis, and validated models for unparalleled Radiosurgery And Radiotherapy Robotics Market insights. See full methodology.

Market Scope
Page number 292
Base year 2025
Historic period 2020-2024
Forecast period 2026-2030
Growth momentum & CAGR Accelerate at a CAGR of 5.6%
Market growth 2026-2030 USD 1027.1 million
Market structure Fragmented
YoY growth 2025-2026(%) 5.2%
Key countries US, Canada, Mexico, Germany, UK, France, Italy, Spain, The Netherlands, China, Japan, India, South Korea, Australia, Indonesia, Saudi Arabia, UAE, South Africa, Israel, Turkey, Brazil, Argentina and Colombia
Competitive landscape Leading Companies, Market Positioning of Companies, Competitive Strategies, and Industry Risks

Request Free Sample

Research Analyst Overview

  • The radiosurgery and radiotherapy robotics market is characterized by intense technological competition, where leadership is defined by the ability to enhance clinical outcomes through superior precision. The field is advancing beyond incremental hardware updates toward integrated ecosystems that combine linear accelerator technology with sophisticated software for adaptive radiotherapy planning and real-time tumor tracking.
  • Key differentiators include motion management solutions that enable complex procedures like stereotactic body radiation therapy and hypofractionated radiotherapy with exceptional accuracy. For instance, systems now feature fiducial-free tracking and respiratory motion synchronization, which are critical for neoadjuvant radiotherapy and treating mobile tumors. The adoption of mr-guided radiotherapy and biology-guided radiotherapy reflects a strategic shift toward personalized medicine.
  • In this environment, boardroom decisions increasingly focus on investing in platforms that offer not just technical superiority in dose distribution optimization but also demonstrable improvements in patient throughput and reduced radiation-induced toxicity, with some providers reporting a 20% increase in treatment capacity after upgrading to the latest robotic platforms. This focus on verifiable ROI is shaping procurement strategies globally.

What are the Key Data Covered in this Radiosurgery And Radiotherapy Robotics Market Research and Growth Report?

  • What is the expected growth of the Radiosurgery And Radiotherapy Robotics Market between 2026 and 2030?

    • USD 1.03 billion, at a CAGR of 5.6%

  • What segmentation does the market report cover?

    • The report is segmented by Type (X-ray based, and Gamma-ray based), End-user (Hospitals, Clinics, and Independent radiotherapy centers), Application (Lung cancer, Prostate cancer, Breast cancer, and Others) and Geography (North America, Europe, APAC, Middle East and Africa, South America)

  • Which regions are analyzed in the report?

    • North America, Europe, APAC, Middle East and Africa and South America

  • What are the key growth drivers and market challenges?

    • Increase in cancer cases and re-treatments, High maintenance and equipment cost of radiosurgery and radiotherapy robotics

  • Who are the major players in the Radiosurgery And Radiotherapy Robotics Market?

    • Accuray Inc., Advanced Oncotherapy plc, Best Medical International Inc., Brainlab AG, Elekta AB, Hitachi Ltd., Mevion Medical Systems Inc., Mitsubishi Electric Corp., Neusoft Corp., Optivus Proton Therapy Inc., Panacea Medical Tech Pvt. Ltd., PMB Alcen, ProTom Holding Corp., Siemens Healthineers AG, Varian Medical Systems Inc., ViewRay Inc. and ZAP Surgical Systems Inc.

Market Research Insights

  • The market dynamics are shaped by a strategic push toward value-based healthcare, where precision oncology platforms are critical. The adoption of advanced radiotherapy techniques is enabling some facilities to reduce average treatment times by up to 25%, directly boosting patient treatment throughput. This efficiency is paramount as capital equipment procurement decisions are increasingly scrutinized for return on investment.
  • Furthermore, the integration of oncology informatics into the radiation oncology workflow improves clinical trial validation and protocol adherence, with some systems showing a 15% reduction in planning errors. This focus on verifiable outcomes and operational excellence defines the competitive landscape, pushing providers toward holistic robotic cancer care solutions that optimize every step of the cancer care continuum.

We can help! Our analysts can customize this radiosurgery and radiotherapy robotics market research report to meet your requirements.

Get in touch

1. Executive Summary

1.1 Market overview

Executive Summary - Chart on Market Overview
Executive Summary - Data Table on Market Overview
Executive Summary - Chart on Global Market Characteristics
Executive Summary - Chart on Market by Geography
Executive Summary - Chart on Market Segmentation by Type
Executive Summary - Chart on Market Segmentation by End-user
Executive Summary - Chart on Market Segmentation by Application
Executive Summary - Chart on Incremental Growth
Executive Summary - Data Table on Incremental Growth
Executive Summary - Chart on Company Market Positioning

2. Technavio Analysis

2.1 Analysis of price sensitivity, lifecycle, customer purchase basket, adoption rates, and purchase criteria

2.2 Criticality of inputs and Factors of differentiation

Chart on Overview on criticality of inputs and factors of differentiation

2.3 Factors of disruption

Chart on Overview on factors of disruption

2.4 Impact of drivers and challenges

Chart on Impact of drivers and challenges in 2025 and 2030

3. Market Landscape

3.1 Market ecosystem

Chart on Parent Market
Data Table on - Parent Market

3.2 Market characteristics

Chart on Market characteristics analysis

3.3 Value chain analysis

Chart on Value chain analysis

4. Market Sizing

4.1 Market definition

Data Table on Offerings of companies included in the market definition

4.2 Market segment analysis

Market segments

4.3 Market size 2025

4.4 Market outlook: Forecast for 2025-2030

Chart on Global - Market size and forecast 2025-2030 ($ million)
Data Table on Global - Market size and forecast 2025-2030 ($ million)
Chart on Global Market: Year-over-year growth 2025-2030 (%)
Data Table on Global Market: Year-over-year growth 2025-2030 (%)

5. Historic Market Size

5.1 Global Radiosurgery And Radiotherapy Robotics Market 2020 - 2024

Historic Market Size - Data Table on Global Radiosurgery And Radiotherapy Robotics Market 2020 - 2024 ($ million)

5.2 Type segment analysis 2020 - 2024

Historic Market Size - Type Segment 2020 - 2024 ($ million)

5.3 End-user segment analysis 2020 - 2024

Historic Market Size - End-user Segment 2020 - 2024 ($ million)

5.4 Application segment analysis 2020 - 2024

Historic Market Size - Application Segment 2020 - 2024 ($ million)

5.5 Geography segment analysis 2020 - 2024

Historic Market Size - Geography Segment 2020 - 2024 ($ million)

5.6 Country segment analysis 2020 - 2024

Historic Market Size - Country Segment 2020 - 2024 ($ million)

6. Qualitative Analysis

6.1 Impact of AI in global radiosurgery and radiotherapy robotics market

7. Five Forces Analysis

7.1 Five forces summary

Five forces analysis - Comparison between 2025 and 2030

7.2 Bargaining power of buyers

Bargaining power of buyers - Impact of key factors 2025 and 2030

7.3 Bargaining power of suppliers

Bargaining power of suppliers - Impact of key factors in 2025 and 2030

7.4 Threat of new entrants

Threat of new entrants - Impact of key factors in 2025 and 2030

7.5 Threat of substitutes

Threat of substitutes - Impact of key factors in 2025 and 2030

7.6 Threat of rivalry

Threat of rivalry - Impact of key factors in 2025 and 2030

7.7 Market condition

Chart on Market condition - Five forces 2025 and 2030

8. Market Segmentation by Type

8.1 Market segments

Chart on Type - Market share 2025-2030 (%)
Data Table on Type - Market share 2025-2030 (%)

8.2 Comparison by Type

Chart on Comparison by Type
Data Table on Comparison by Type

8.3 X-ray based - Market size and forecast 2025-2030

Chart on X-ray based - Market size and forecast 2025-2030 ($ million)
Data Table on X-ray based - Market size and forecast 2025-2030 ($ million)
Chart on X-ray based - Year-over-year growth 2025-2030 (%)
Data Table on X-ray based - Year-over-year growth 2025-2030 (%)

8.4 Gamma-ray based - Market size and forecast 2025-2030

Chart on Gamma-ray based - Market size and forecast 2025-2030 ($ million)
Data Table on Gamma-ray based - Market size and forecast 2025-2030 ($ million)
Chart on Gamma-ray based - Year-over-year growth 2025-2030 (%)
Data Table on Gamma-ray based - Year-over-year growth 2025-2030 (%)

8.5 Market opportunity by Type

Market opportunity by Type ($ million)
Data Table on Market opportunity by Type ($ million)

9. Market Segmentation by End-user

9.1 Market segments

Chart on End-user - Market share 2025-2030 (%)
Data Table on End-user - Market share 2025-2030 (%)

9.2 Comparison by End-user

Chart on Comparison by End-user
Data Table on Comparison by End-user

9.3 Hospitals - Market size and forecast 2025-2030

Chart on Hospitals - Market size and forecast 2025-2030 ($ million)
Data Table on Hospitals - Market size and forecast 2025-2030 ($ million)
Chart on Hospitals - Year-over-year growth 2025-2030 (%)
Data Table on Hospitals - Year-over-year growth 2025-2030 (%)

9.4 Clinics - Market size and forecast 2025-2030

Chart on Clinics - Market size and forecast 2025-2030 ($ million)
Data Table on Clinics - Market size and forecast 2025-2030 ($ million)
Chart on Clinics - Year-over-year growth 2025-2030 (%)
Data Table on Clinics - Year-over-year growth 2025-2030 (%)

9.5 Independent radiotherapy centers - Market size and forecast 2025-2030

Chart on Independent radiotherapy centers - Market size and forecast 2025-2030 ($ million)
Data Table on Independent radiotherapy centers - Market size and forecast 2025-2030 ($ million)
Chart on Independent radiotherapy centers - Year-over-year growth 2025-2030 (%)
Data Table on Independent radiotherapy centers - Year-over-year growth 2025-2030 (%)

9.6 Market opportunity by End-user

Market opportunity by End-user ($ million)
Data Table on Market opportunity by End-user ($ million)

10. Market Segmentation by Application

10.1 Market segments

Chart on Application - Market share 2025-2030 (%)
Data Table on Application - Market share 2025-2030 (%)

10.2 Comparison by Application

Chart on Comparison by Application
Data Table on Comparison by Application

10.3 Lung cancer - Market size and forecast 2025-2030

Chart on Lung cancer - Market size and forecast 2025-2030 ($ million)
Data Table on Lung cancer - Market size and forecast 2025-2030 ($ million)
Chart on Lung cancer - Year-over-year growth 2025-2030 (%)
Data Table on Lung cancer - Year-over-year growth 2025-2030 (%)

10.4 Prostate cancer - Market size and forecast 2025-2030

Chart on Prostate cancer - Market size and forecast 2025-2030 ($ million)
Data Table on Prostate cancer - Market size and forecast 2025-2030 ($ million)
Chart on Prostate cancer - Year-over-year growth 2025-2030 (%)
Data Table on Prostate cancer - Year-over-year growth 2025-2030 (%)

10.5 Breast cancer - Market size and forecast 2025-2030

Chart on Breast cancer - Market size and forecast 2025-2030 ($ million)
Data Table on Breast cancer - Market size and forecast 2025-2030 ($ million)
Chart on Breast cancer - Year-over-year growth 2025-2030 (%)
Data Table on Breast cancer - Year-over-year growth 2025-2030 (%)

10.6 Others - Market size and forecast 2025-2030

Chart on Others - Market size and forecast 2025-2030 ($ million)
Data Table on Others - Market size and forecast 2025-2030 ($ million)
Chart on Others - Year-over-year growth 2025-2030 (%)
Data Table on Others - Year-over-year growth 2025-2030 (%)

10.7 Market opportunity by Application

Market opportunity by Application ($ million)
Data Table on Market opportunity by Application ($ million)

11. Customer Landscape

11.1 Customer landscape overview

Analysis of price sensitivity, lifecycle, customer purchase basket, adoption rates, and purchase criteria

12. Geographic Landscape

12.1 Geographic segmentation

Chart on Market share by geography 2025-2030 (%)
Data Table on Market share by geography 2025-2030 (%)

12.2 Geographic comparison

Chart on Geographic comparison
Data Table on Geographic comparison

12.3 North America - Market size and forecast 2025-2030

Chart on North America - Market size and forecast 2025-2030 ($ million)
Data Table on North America - Market size and forecast 2025-2030 ($ million)
Chart on North America - Year-over-year growth 2025-2030 (%)
Data Table on North America - Year-over-year growth 2025-2030 (%)
Chart on Regional Comparison - North America
Data Table on Regional Comparison - North America

12.3.1 US - Market size and forecast 2025-2030

Chart on US - Market size and forecast 2025-2030 ($ million)
Data Table on US - Market size and forecast 2025-2030 ($ million)
Chart on US - Year-over-year growth 2025-2030 (%)
Data Table on US - Year-over-year growth 2025-2030 (%)

12.3.2 Canada - Market size and forecast 2025-2030

Chart on Canada - Market size and forecast 2025-2030 ($ million)
Data Table on Canada - Market size and forecast 2025-2030 ($ million)
Chart on Canada - Year-over-year growth 2025-2030 (%)
Data Table on Canada - Year-over-year growth 2025-2030 (%)

12.3.3 Mexico - Market size and forecast 2025-2030

Chart on Mexico - Market size and forecast 2025-2030 ($ million)
Data Table on Mexico - Market size and forecast 2025-2030 ($ million)
Chart on Mexico - Year-over-year growth 2025-2030 (%)
Data Table on Mexico - Year-over-year growth 2025-2030 (%)

12.4 Europe - Market size and forecast 2025-2030

Chart on Europe - Market size and forecast 2025-2030 ($ million)
Data Table on Europe - Market size and forecast 2025-2030 ($ million)
Chart on Europe - Year-over-year growth 2025-2030 (%)
Data Table on Europe - Year-over-year growth 2025-2030 (%)
Chart on Regional Comparison - Europe
Data Table on Regional Comparison - Europe

12.4.1 Germany - Market size and forecast 2025-2030

Chart on Germany - Market size and forecast 2025-2030 ($ million)
Data Table on Germany - Market size and forecast 2025-2030 ($ million)
Chart on Germany - Year-over-year growth 2025-2030 (%)
Data Table on Germany - Year-over-year growth 2025-2030 (%)

12.4.2 UK - Market size and forecast 2025-2030

Chart on UK - Market size and forecast 2025-2030 ($ million)
Data Table on UK - Market size and forecast 2025-2030 ($ million)
Chart on UK - Year-over-year growth 2025-2030 (%)
Data Table on UK - Year-over-year growth 2025-2030 (%)

12.4.3 France - Market size and forecast 2025-2030

Chart on France - Market size and forecast 2025-2030 ($ million)
Data Table on France - Market size and forecast 2025-2030 ($ million)
Chart on France - Year-over-year growth 2025-2030 (%)
Data Table on France - Year-over-year growth 2025-2030 (%)

12.4.4 Italy - Market size and forecast 2025-2030

Chart on Italy - Market size and forecast 2025-2030 ($ million)
Data Table on Italy - Market size and forecast 2025-2030 ($ million)
Chart on Italy - Year-over-year growth 2025-2030 (%)
Data Table on Italy - Year-over-year growth 2025-2030 (%)

12.4.5 Spain - Market size and forecast 2025-2030

Chart on Spain - Market size and forecast 2025-2030 ($ million)
Data Table on Spain - Market size and forecast 2025-2030 ($ million)
Chart on Spain - Year-over-year growth 2025-2030 (%)
Data Table on Spain - Year-over-year growth 2025-2030 (%)

12.4.6 The Netherlands - Market size and forecast 2025-2030

Chart on The Netherlands - Market size and forecast 2025-2030 ($ million)
Data Table on The Netherlands - Market size and forecast 2025-2030 ($ million)
Chart on The Netherlands - Year-over-year growth 2025-2030 (%)
Data Table on The Netherlands - Year-over-year growth 2025-2030 (%)

12.5 APAC - Market size and forecast 2025-2030

Chart on APAC - Market size and forecast 2025-2030 ($ million)
Data Table on APAC - Market size and forecast 2025-2030 ($ million)
Chart on APAC - Year-over-year growth 2025-2030 (%)
Data Table on APAC - Year-over-year growth 2025-2030 (%)
Chart on Regional Comparison - APAC
Data Table on Regional Comparison - APAC

12.5.1 China - Market size and forecast 2025-2030

Chart on China - Market size and forecast 2025-2030 ($ million)
Data Table on China - Market size and forecast 2025-2030 ($ million)
Chart on China - Year-over-year growth 2025-2030 (%)
Data Table on China - Year-over-year growth 2025-2030 (%)

12.5.2 Japan - Market size and forecast 2025-2030

Chart on Japan - Market size and forecast 2025-2030 ($ million)
Data Table on Japan - Market size and forecast 2025-2030 ($ million)
Chart on Japan - Year-over-year growth 2025-2030 (%)
Data Table on Japan - Year-over-year growth 2025-2030 (%)

12.5.3 India - Market size and forecast 2025-2030

Chart on India - Market size and forecast 2025-2030 ($ million)
Data Table on India - Market size and forecast 2025-2030 ($ million)
Chart on India - Year-over-year growth 2025-2030 (%)
Data Table on India - Year-over-year growth 2025-2030 (%)

12.5.4 South Korea - Market size and forecast 2025-2030

Chart on South Korea - Market size and forecast 2025-2030 ($ million)
Data Table on South Korea - Market size and forecast 2025-2030 ($ million)
Chart on South Korea - Year-over-year growth 2025-2030 (%)
Data Table on South Korea - Year-over-year growth 2025-2030 (%)

12.5.5 Australia - Market size and forecast 2025-2030

Chart on Australia - Market size and forecast 2025-2030 ($ million)
Data Table on Australia - Market size and forecast 2025-2030 ($ million)
Chart on Australia - Year-over-year growth 2025-2030 (%)
Data Table on Australia - Year-over-year growth 2025-2030 (%)

12.5.6 Indonesia - Market size and forecast 2025-2030

Chart on Indonesia - Market size and forecast 2025-2030 ($ million)
Data Table on Indonesia - Market size and forecast 2025-2030 ($ million)
Chart on Indonesia - Year-over-year growth 2025-2030 (%)
Data Table on Indonesia - Year-over-year growth 2025-2030 (%)

12.6 Middle East and Africa - Market size and forecast 2025-2030

Chart on Middle East and Africa - Market size and forecast 2025-2030 ($ million)
Data Table on Middle East and Africa - Market size and forecast 2025-2030 ($ million)
Chart on Middle East and Africa - Year-over-year growth 2025-2030 (%)
Data Table on Middle East and Africa - Year-over-year growth 2025-2030 (%)
Chart on Regional Comparison - Middle East and Africa
Data Table on Regional Comparison - Middle East and Africa

12.6.1 Saudi Arabia - Market size and forecast 2025-2030

Chart on Saudi Arabia - Market size and forecast 2025-2030 ($ million)
Data Table on Saudi Arabia - Market size and forecast 2025-2030 ($ million)
Chart on Saudi Arabia - Year-over-year growth 2025-2030 (%)
Data Table on Saudi Arabia - Year-over-year growth 2025-2030 (%)

12.6.2 UAE - Market size and forecast 2025-2030

Chart on UAE - Market size and forecast 2025-2030 ($ million)
Data Table on UAE - Market size and forecast 2025-2030 ($ million)
Chart on UAE - Year-over-year growth 2025-2030 (%)
Data Table on UAE - Year-over-year growth 2025-2030 (%)

12.6.3 South Africa - Market size and forecast 2025-2030

Chart on South Africa - Market size and forecast 2025-2030 ($ million)
Data Table on South Africa - Market size and forecast 2025-2030 ($ million)
Chart on South Africa - Year-over-year growth 2025-2030 (%)
Data Table on South Africa - Year-over-year growth 2025-2030 (%)

12.6.4 Israel - Market size and forecast 2025-2030

Chart on Israel - Market size and forecast 2025-2030 ($ million)
Data Table on Israel - Market size and forecast 2025-2030 ($ million)
Chart on Israel - Year-over-year growth 2025-2030 (%)
Data Table on Israel - Year-over-year growth 2025-2030 (%)

12.6.5 Turkey - Market size and forecast 2025-2030

Chart on Turkey - Market size and forecast 2025-2030 ($ million)
Data Table on Turkey - Market size and forecast 2025-2030 ($ million)
Chart on Turkey - Year-over-year growth 2025-2030 (%)
Data Table on Turkey - Year-over-year growth 2025-2030 (%)

12.7 South America - Market size and forecast 2025-2030

Chart on South America - Market size and forecast 2025-2030 ($ million)
Data Table on South America - Market size and forecast 2025-2030 ($ million)
Chart on South America - Year-over-year growth 2025-2030 (%)
Data Table on South America - Year-over-year growth 2025-2030 (%)
Chart on Regional Comparison - South America
Data Table on Regional Comparison - South America

12.7.1 Brazil - Market size and forecast 2025-2030

Chart on Brazil - Market size and forecast 2025-2030 ($ million)
Data Table on Brazil - Market size and forecast 2025-2030 ($ million)
Chart on Brazil - Year-over-year growth 2025-2030 (%)
Data Table on Brazil - Year-over-year growth 2025-2030 (%)

12.7.2 Argentina - Market size and forecast 2025-2030

Chart on Argentina - Market size and forecast 2025-2030 ($ million)
Data Table on Argentina - Market size and forecast 2025-2030 ($ million)
Chart on Argentina - Year-over-year growth 2025-2030 (%)
Data Table on Argentina - Year-over-year growth 2025-2030 (%)

12.7.3 Colombia - Market size and forecast 2025-2030

Chart on Colombia - Market size and forecast 2025-2030 ($ million)
Data Table on Colombia - Market size and forecast 2025-2030 ($ million)
Chart on Colombia - Year-over-year growth 2025-2030 (%)
Data Table on Colombia - Year-over-year growth 2025-2030 (%)

12.8 Market opportunity by geography

Market opportunity by geography ($ million)
Data Tables on Market opportunity by geography ($ million)

13. Drivers, Challenges, and Opportunity

13.1 Market drivers

Increase in cancer cases and re-treatments
Rise in product innovations in radiosurgery and radiotherapy robotic systems
Developments in reimbursement policies and practices

13.2 Market challenges

High maintenance and equipment cost of radiosurgery and radiotherapy robotics
Health risks and rising healthcare costs
Competition from alternative treatment options

13.3 Impact of drivers and challenges

Impact of drivers and challenges in 2025 and 2030

13.4 Market opportunities

Emergence of advanced radiotherapy treatments
Growing demand for extracranial radiosurgery
Improvement in customer support services by companies of radiosurgery and radiotherapy robotics

14. Competitive Landscape

14.1 Overview

14.2

Overview on criticality of inputs and factors of differentiation

14.3 Landscape disruption

Overview on factors of disruption

14.4 Industry risks

Impact of key risks on business

15. Competitive Analysis

15.1 Companies profiled

Companies covered

15.2 Company ranking index

15.3 Market positioning of companies

Matrix on companies position and classification

15.4 Accuray Inc.

Accuray Inc. - Overview
Accuray Inc. - Product / Service
Accuray Inc. - Key offerings
SWOT

15.5 Advanced Oncotherapy plc

Advanced Oncotherapy plc - Overview
Advanced Oncotherapy plc - Business segments
Advanced Oncotherapy plc - Key offerings
Advanced Oncotherapy plc - Segment focus
SWOT

15.6 Best Medical International Inc.

Best Medical International Inc. - Overview
Best Medical International Inc. - Product / Service
Best Medical International Inc. - Key offerings
SWOT

15.7 Brainlab AG

Brainlab AG - Overview
Brainlab AG - Product / Service
Brainlab AG - Key offerings
SWOT

15.8 Elekta AB

Elekta AB - Overview
Elekta AB - Business segments
Elekta AB - Key offerings
Elekta AB - Segment focus
SWOT

15.9 Hitachi Ltd.

Hitachi Ltd. - Overview
Hitachi Ltd. - Business segments
Hitachi Ltd. - Key news
Hitachi Ltd. - Key offerings
Hitachi Ltd. - Segment focus
SWOT

15.10 Mevion Medical Systems Inc.

Mevion Medical Systems Inc. - Overview
Mevion Medical Systems Inc. - Product / Service
Mevion Medical Systems Inc. - Key offerings
SWOT

15.11 Mitsubishi Electric Corp.

Mitsubishi Electric Corp. - Overview
Mitsubishi Electric Corp. - Business segments
Mitsubishi Electric Corp. - Key offerings
Mitsubishi Electric Corp. - Segment focus
SWOT

15.12 Neusoft Corp.

Neusoft Corp. - Overview
Neusoft Corp. - Product / Service
Neusoft Corp. - Key offerings
SWOT

15.13 Optivus Proton Therapy Inc.

Optivus Proton Therapy Inc. - Overview
Optivus Proton Therapy Inc. - Product / Service
Optivus Proton Therapy Inc. - Key offerings
SWOT

15.14 Panacea Medical Tech Pvt. Ltd.

Panacea Medical Tech Pvt. Ltd. - Overview
Panacea Medical Tech Pvt. Ltd. - Product / Service
Panacea Medical Tech Pvt. Ltd. - Key offerings
SWOT

15.15 PMB Alcen

PMB Alcen - Overview
PMB Alcen - Product / Service
PMB Alcen - Key offerings
SWOT

15.16 ProTom Holding Corp.

ProTom Holding Corp. - Overview
ProTom Holding Corp. - Product / Service
ProTom Holding Corp. - Key offerings
SWOT

15.17 Siemens Healthineers AG

Siemens Healthineers AG - Overview
Siemens Healthineers AG - Business segments
Siemens Healthineers AG - Key news
Siemens Healthineers AG - Key offerings
Siemens Healthineers AG - Segment focus
SWOT

15.18 Varian Medical Systems Inc.

Varian Medical Systems Inc. - Overview
Varian Medical Systems Inc. - Product / Service
Varian Medical Systems Inc. - Key offerings
SWOT

16. Appendix

16.1 Scope of the report

Market definition
Objectives
Notes and caveats

16.2 Inclusions and exclusions checklist

Inclusions checklist
Exclusions checklist

16.3 Currency conversion rates for US$

16.4 Research methodology

16.5 Data procurement

Information sources

16.6 Data validation

16.7 Validation techniques employed for market sizing

16.8 Data synthesis

16.9 360 degree market analysis

16.10 List of abbreviations

Research Methodology

Technavio presents a detailed picture of the market by way of study, synthesis, and summation of data from multiple sources. The analysts have presented the various facets of the market with a particular focus on identifying the key industry influencers. The data thus presented is comprehensive, reliable, and the result of extensive research, both primary and secondary.

INFORMATION SOURCES

Primary sources

  • Manufacturers and suppliers
  • Channel partners
  • Industry experts
  • Strategic decision makers

Secondary sources

  • Industry journals and periodicals
  • Government data
  • Financial reports of key industry players
  • Historical data
  • Press releases

DATA ANALYSIS

Data Synthesis

  • Collation of data
  • Estimation of key figures
  • Analysis of derived insights

Data Validation

  • Triangulation with data models
  • Reference against proprietary databases
  • Corroboration with industry experts

REPORT WRITING

Qualitative

  • Market drivers
  • Market challenges
  • Market trends
  • Five forces analysis

Quantitative

  • Market size and forecast
  • Market segmentation
  • Geographical insights
  • Competitive landscape

Interested in this report?

Get your sample now to see our research methodology and insights!

Download Now

Frequently Asked Questions

Radiosurgery And Radiotherapy Robotics market growth will increase by USD 1027.1 million during 2026-2030 .

The Radiosurgery And Radiotherapy Robotics market is expected to grow at a CAGR of 5.6% during 2026-2030 .

Radiosurgery And Radiotherapy Robotics market is segmented by Type (X-ray based, Gamma-ray based) End-user (Hospitals, Clinics, Independent radiotherapy centers) Application (Lung cancer, Prostate cancer, Breast cancer, Others)

Accuray Inc., Advanced Oncotherapy plc, Best Medical International Inc., Brainlab AG, Elekta AB, Hitachi Ltd., Mevion Medical Systems Inc., Mitsubishi Electric Corp., Neusoft Corp., Optivus Proton Therapy Inc., Panacea Medical Tech Pvt. Ltd., PMB Alcen, ProTom Holding Corp., Siemens Healthineers AG, Varian Medical Systems Inc., ViewRay Inc., ZAP Surgical Systems Inc. are a few of the key vendors in the Radiosurgery And Radiotherapy Robotics market.

North America will register the highest growth rate of 38.6% among the other regions. Therefore, the Radiosurgery And Radiotherapy Robotics market in North America is expected to garner significant business opportunities for the vendors during the forecast period.

US, Canada, Mexico, Germany, UK, France, Italy, Spain, The Netherlands, China, Japan, India, South Korea, Australia, Indonesia, Saudi Arabia, UAE, South Africa, Israel, Turkey, Brazil, Argentina, Colombia

  • Increase in cancer cases and re-treatments is the driving factor this market.

The Radiosurgery And Radiotherapy Robotics market vendors should focus on grabbing business opportunities from the Type segment as it accounted for the largest market share in the base year.