Radiotherapy Monitoring Devices Market Analysis, Size, and Forecast 2026-2030: North America (US, Canada, and Mexico), Europe (Germany, UK, and France), APAC (China, Japan, and India), South America (Brazil), Middle East and Africa (UAE, Saudi Arabia, and South Africa), Asia, Rest of World (ROW)

Radiotherapy Monitoring Devices Market Analysis, Size, and Forecast 2026-2030:
North America (US, Canada, and Mexico), Europe (Germany, UK, and France), APAC (China, Japan, and India), South America (Brazil), Middle East and Africa (UAE, Saudi Arabia, and South Africa), Asia, Rest of World (ROW)

Published: Dec 2025 292 Pages SKU: IRTNTR81226

Market Overview at a Glance

$1.26 B
Market Opportunity
6.7%
CAGR 2025 - 2030
33.1%
North America Growth
$1.39 B
Imaging devices segment 2024

Radiotherapy Monitoring Devices Market Size 2026-2030

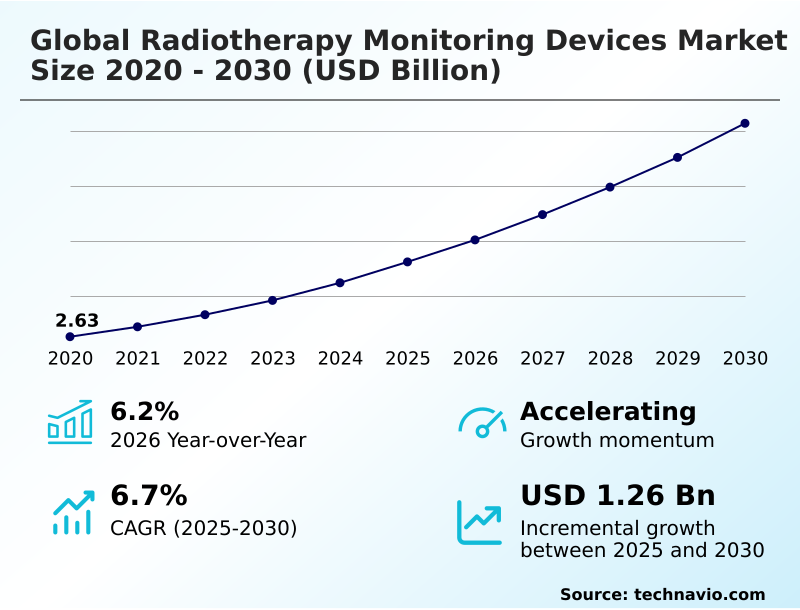
The radiotherapy monitoring devices market size is valued to increase by USD 1.26 billion, at a CAGR of 6.7% from 2025 to 2030. Technological advancements in real-time adaptive radiotherapy and AI Integration will drive the radiotherapy monitoring devices market.

Major Market Trends & Insights

  • North America dominated the market and accounted for a 33.1% growth during the forecast period.
  • By Device - Imaging devices segment was valued at USD 1.39 billion in 2024
  • By End-user - Hospitals segment accounted for the largest market revenue share in 2024

Market Size & Forecast

  • Market Opportunities: USD 1.93 billion
  • Market Future Opportunities: USD 1.26 billion
  • CAGR from 2025 to 2030 : 6.7%

Market Summary

  • The radiotherapy monitoring devices market is defined by a fundamental shift toward precision oncology, where ensuring treatment accuracy is paramount. This evolution is propelled by the clinical need for advanced modalities that minimize toxicity while maximizing therapeutic outcomes.
  • Key drivers include the rising global incidence of cancer, which pressures healthcare systems to adopt efficient and safe treatment solutions, and increasingly stringent regulatory standards that mandate comprehensive quality assurance. A primary trend is the integration of artificial intelligence into monitoring workflows, enabling real-time adaptive radiotherapy and automating error detection.
  • For instance, a hospital network standardizing its quality assurance protocols can leverage AI-driven platforms to analyze performance data across multiple sites, identifying anomalies and predicting equipment maintenance needs, thereby increasing patient throughput and enhancing safety.
  • However, the market faces challenges from the high capital cost of these sophisticated systems and the technical complexity of integrating disparate devices, which can create data silos and operational inefficiencies. The continuous development of non-invasive tracking technologies and software-based verification tools is shaping the competitive landscape, pushing the industry toward more integrated, intelligent, and patient-centric monitoring ecosystems.

What will be the Size of the Radiotherapy Monitoring Devices Market during the forecast period?

Get Key Insights on Market Forecast (PDF) Request Free Sample

How is the Radiotherapy Monitoring Devices Market Segmented?

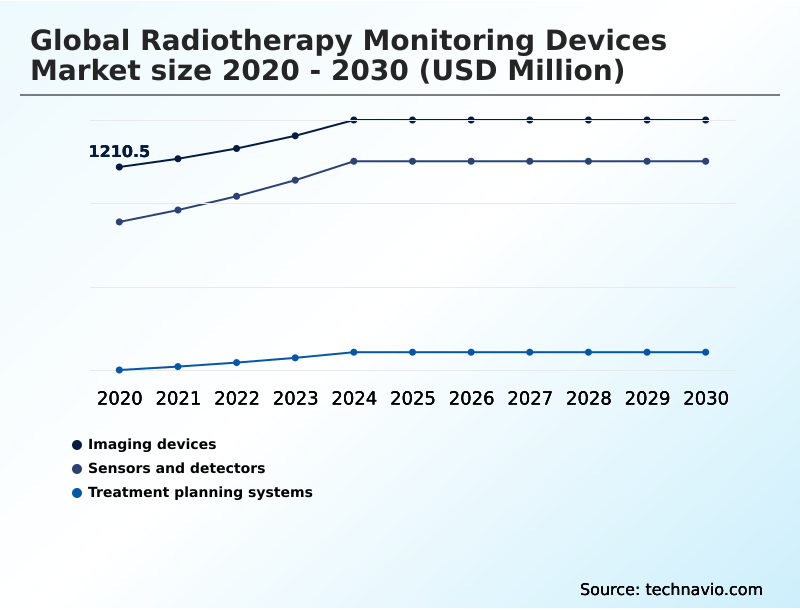
The radiotherapy monitoring devices industry research report provides comprehensive data (region-wise segment analysis), with forecasts and estimates in "USD million" for the period 2026-2030, as well as historical data from 2020-2024 for the following segments.

  • Device
    • Imaging devices
    • Sensors and detectors
    • Treatment planning systems
  • End-user
    • Hospitals
    • Diagnostic centers
    • Cancer research institutes
  • Component
    • Hardware
    • Software
  • Geography
    • North America
      • US
      • Canada
      • Mexico
    • Europe
      • Germany
      • UK
      • France
    • Asia
    • Rest of World (ROW)

By Device Insights

The imaging devices segment is estimated to witness significant growth during the forecast period.

The imaging devices segment is foundational to the radiotherapy monitoring devices market, providing the visual guidance systems for modern oncology.

This category includes technologies like cone beam computed tomography (CBCT) and integrated magnetic resonance imaging, which are critical for image-guided radiation therapy (IGRT) and achieving sub-millimeter treatment accuracy.

The evolution to volumetric 4D imaging for motion analysis allows clinicians to observe tumor motion for real-time tumor tracking. A pivotal driver is the MRI-Linac, providing superior soft-tissue contrast for online adaptive replanning.

These systems are now active delivery components, with enhancements reducing daily acquisition time by 30%, directly improving patient throughput and streamlining clinical workflows.

This is supported by robust dosimetric verification tools, automated error detection algorithms, and patient-specific quality assurance, which are vital for machine performance metrics and ensuring compliance with regulatory standards.

Request Free Sample

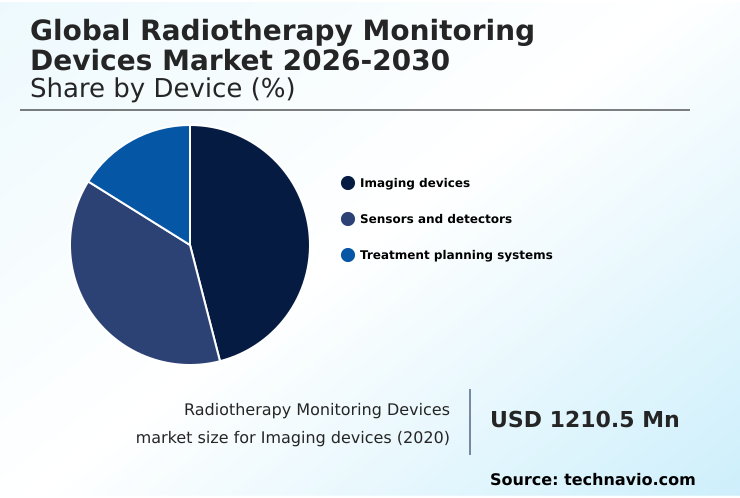
The Imaging devices segment was valued at USD 1.39 billion in 2024 and showed a gradual increase during the forecast period.

Request Free Sample

Regional Analysis

North America is estimated to contribute 33.1% to the growth of the global market during the forecast period.Technavio’s analysts have elaborately explained the regional trends and drivers that shape the market during the forecast period.

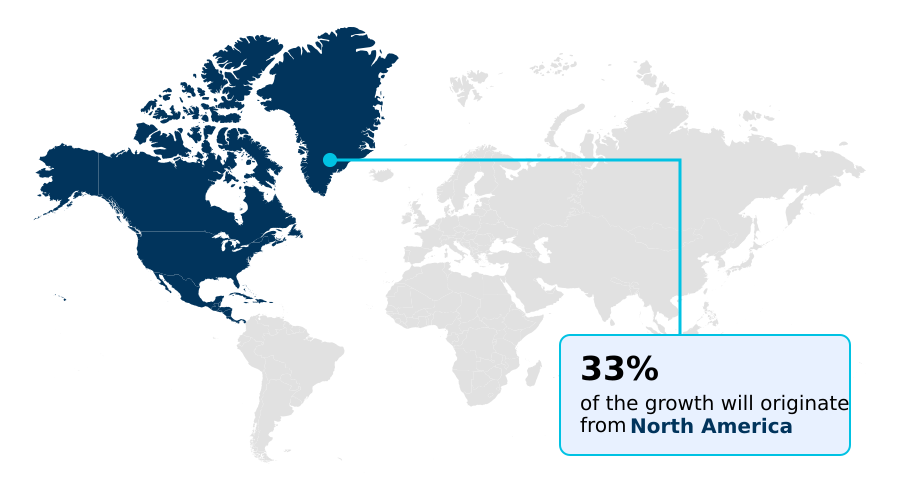
See How Radiotherapy Monitoring Devices Market Demand is Rising in North America Request Free Sample

The global market exhibits distinct regional dynamics, with North America holding a significant share due to its advanced healthcare infrastructure and high adoption rates of adaptive radiotherapy (ART).

In contrast, Asia is the fastest-growing region, with its market expansion outpacing North America's by more than two percentage points, fueled by infrastructure development and a rising focus on reducing treatment toxicity.

Europe's market is shaped by stringent regulations and a focus on standardizing care through technologies such as advanced respiratory gating techniques.

Innovations in remote dosimetry auditing are bridging geographical gaps, particularly in Australia, while the use of monte carlo dose calculation and auto-contouring in treatment planning is becoming a global standard for minimizing radiation exposure.

Efficient 4D dose calculation methods and automated linac warm-up procedures are key priorities worldwide, supporting complex treatments like stereotactic radiosurgery (SRS) and requiring enhanced interoperability with linear accelerators.

Market Dynamics

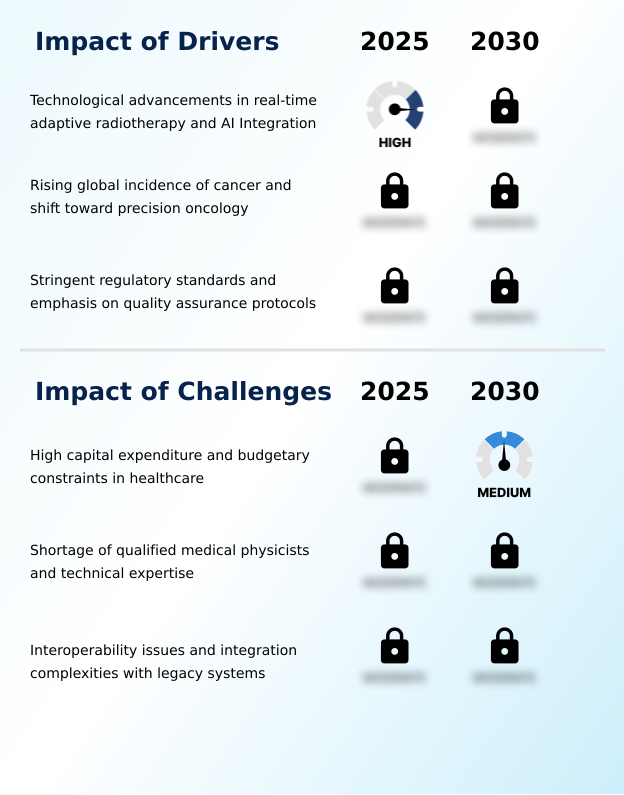
Our researchers analyzed the data with 2025 as the base year, along with the key drivers, trends, and challenges. A holistic analysis of drivers will help companies refine their marketing strategies to gain a competitive advantage.

  • The future of the radiotherapy monitoring devices market hinges on the sophisticated interplay of emerging technologies and the resolution of persistent operational challenges. The impact of AI on quality assurance workflows is transformative, serving as the backbone for advancements in real-time adaptive radiotherapy.
  • This allows for dynamic treatment adjustments, a critical need supported by the ongoing standardization of surface guided radiation therapy (SGRT) in the pursuit of tattoo-less cancer treatments. Concurrently, the expansion of cloud-based centralized dosimetry management addresses the operational needs of multi-site clinics, enabling them to standardize protocols and benchmark performance.
  • The cost-effectiveness of these automated QA tools provides a compelling argument for adoption. However, these opportunities are tempered by the challenges of high capital expenditure and a pronounced shortage of qualified medical physicists, which can limit the uptake of advanced systems. Furthermore, overcoming interoperability issues with legacy systems remains a critical hurdle.
  • For example, facilities that successfully integrate SGRT with their existing linear accelerators have reported setup time reductions that are substantially greater than those using fragmented systems. This demonstrates that realizing the full clinical and economic benefits of innovations like in-vivo dosimetry for dose verification and motion management for hypofractionated radiotherapy depends on creating a cohesive technological ecosystem.

What are the key market drivers leading to the rise in the adoption of Radiotherapy Monitoring Devices Industry?

  • Technological advancements, particularly in real-time adaptive radiotherapy and AI integration, are a key driver of market growth.

  • Market growth is fundamentally driven by the rising global cancer incidence and the clinical shift toward precision oncology.
  • The increasing use of hypofractionated treatment protocols, including stereotactic body radiation therapy (SBRT) and volumetric modulated arc therapy (VMAT), demands sophisticated monitoring to ensure organ at risk (OAR) sparing.
  • This has fueled demand for advanced patient positioning systems and dosimetric verification tools that support complex techniques like deep inspiration breath hold (DIBH).
  • Stringent regulatory standards mandating end-to-end radiotherapy testing and accurate dose accumulation monitoring are also compelling investment in technologies that enhance patient safety protocols.
  • Motion management for SBRT and dosimetry for small field radiotherapy have become critical, with a clear focus on verifying dose delivery accuracy for every treatment fraction, including specialized modalities like proton therapy beam monitoring.

What are the market trends shaping the Radiotherapy Monitoring Devices Industry?

  • The integration of artificial intelligence for real-time adaptive quality assurance is an emerging market trend. This development signifies a shift toward dynamic, data-driven verification processes in radiation oncology.

  • Key trends are reshaping the market, led by the integration of AI for real-time adaptive quality assurance and innovations in software-as-a-medical-device (SaMD). This technological shift enables dynamic capabilities like real-time dose reconstruction and supports the daily QA checks automation, with some platforms capable of predicting linac magnetron failure.
  • The adoption of surface guided radiation therapy (SGRT) is accelerating, driven by clinical demand for tattoo-less radiation therapy and its ability to enable bi-directional linac communication for motion management. Validating AI-based software is becoming a key focus, as AI in radiotherapy quality assurance is proven to reduce QA times by 40%.
  • Concurrently, the expansion of cloud-based dosimetry management is helping healthcare networks in standardizing QA across clinics, moving the industry toward software-based dose calculation and greater operational efficiency.

What challenges does the Radiotherapy Monitoring Devices Industry face during its growth?

  • High capital expenditure and budgetary constraints within healthcare represent a key challenge affecting industry growth.

  • Significant challenges constrain market adoption, primarily stemming from high capital expenditure for systems like MR-compatible dosimetry hardware and the global shortage of qualified medical physicists. This skills gap is compounded by persistent interoperability issues with legacy systems, which leads to data fragmentation in oncology and discourages investment in third-party devices.
  • Facilities often favor integrated monitoring suites from a single provider to avoid the complexities of managing high dose rate treatments with incompatible tools. The technical demands of emerging modalities, such as flash radiotherapy dosimetry and heavy ion therapy monitoring, require specialized expertise for calibrating radiation detection instruments.
  • While innovations like robotic patient positioning and non-invasive patient monitoring offer solutions, the complexity of multileaf collimator (MLC) tracking and data integration remains a considerable hurdle for many institutions.

Exclusive Technavio Analysis on Customer Landscape

The radiotherapy monitoring devices market forecasting report includes the adoption lifecycle of the market, covering from the innovator’s stage to the laggard’s stage. It focuses on adoption rates in different regions based on penetration. Furthermore, the radiotherapy monitoring devices market report also includes key purchase criteria and drivers of price sensitivity to help companies evaluate and develop their market growth analysis strategies.

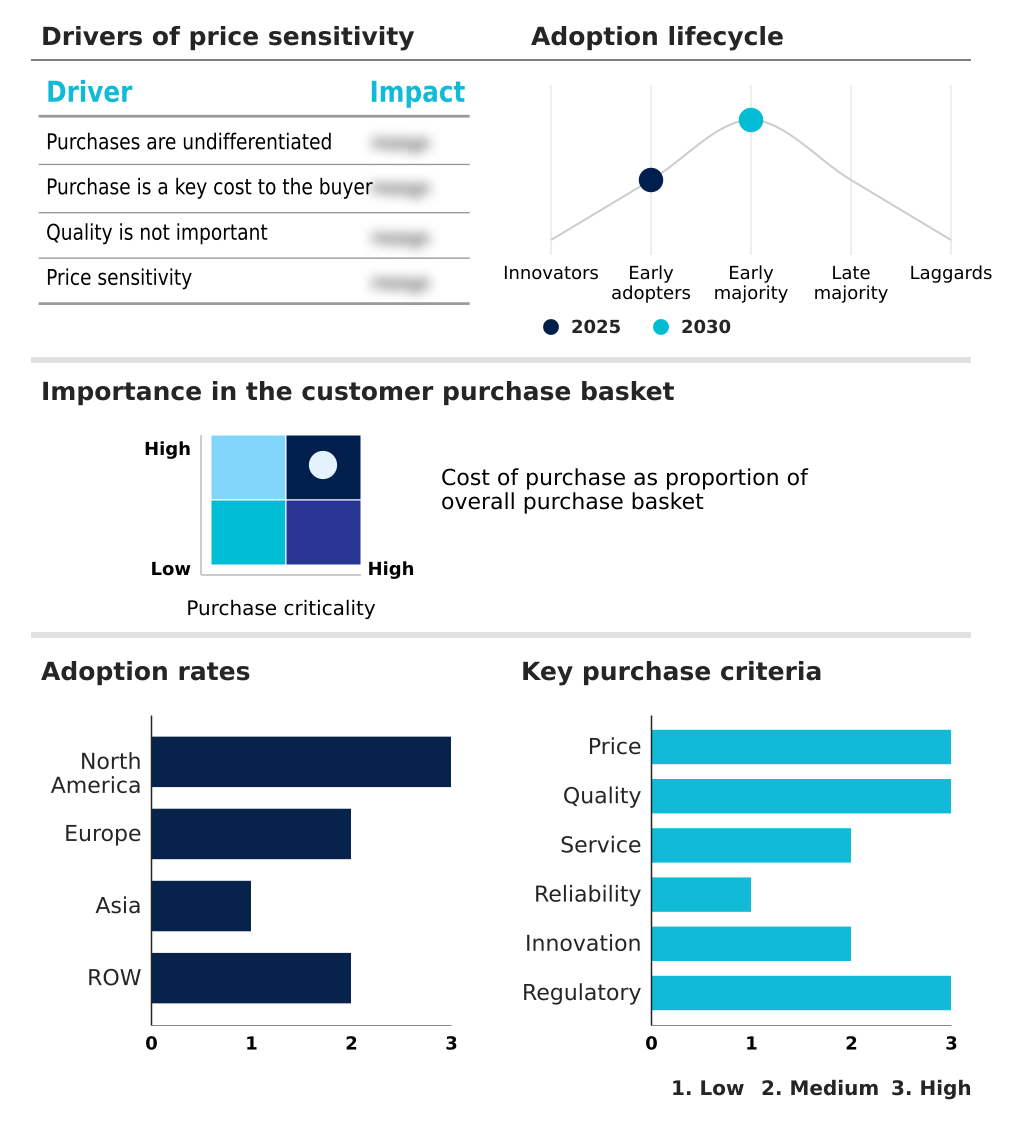
Customer Landscape of Radiotherapy Monitoring Devices Industry

Competitive Landscape

Companies are implementing various strategies, such as strategic alliances, radiotherapy monitoring devices market forecast, partnerships, mergers and acquisitions, geographical expansion, and product/service launches, to enhance their presence in the industry.

Accuray Inc. - Focus is centered on delivering real-time motion synchronization and advanced target tracking capabilities integral to precision radiation therapy delivery platforms.

The industry research and growth report includes detailed analyses of the competitive landscape of the market and information about key companies, including:

  • Accuray Inc.
  • Best Medical International Inc.
  • Brainlab AG
  • C RAD AB
  • Elekta AB
  • Fluke Corp.
  • GE Healthcare Technologies
  • Koninklijke Philips NV
  • LAP GmbH
  • Modus Medical Devices Inc.
  • Orfit Industries NV
  • RaySearch Laboratories
  • ScandiDos AB
  • Siemens Healthineers AG
  • Thermo Fisher Scientific Inc.
  • Varian Medical Systems Inc.
  • Vision RT Ltd.

Qualitative and quantitative analysis of companies has been conducted to help clients understand the wider business environment as well as the strengths and weaknesses of key industry players. Data is qualitatively analyzed to categorize companies as pure play, category-focused, industry-focused, and diversified; it is quantitatively analyzed to categorize companies as dominant, leading, strong, tentative, and weak.

Recent Development and News in Radiotherapy monitoring devices market

  • In August 2024, Sun Nuclear released a new patient QA platform that utilizes deep learning to identify potential errors in dose delivery before treatment commences.
  • In September 2024, the European Society for Radiotherapy and Oncology updated its guidelines for surface guided radiation therapy, recommending continuous monitoring for all patients undergoing stereotactic procedures.
  • In January 2025, HCA Healthcare reported a substantial expansion of its oncology services, incorporating state-of-the-art dosimetry and patient positioning systems across fifty of its locations.
  • In April 2025, the US Food and Drug Administration issued a safety communication urging healthcare providers to adopt enhanced verification systems for radiation treatment planning and delivery software to mitigate risks from interoperability issues.

Dive into Technavio’s robust research methodology, blending expert interviews, extensive data synthesis, and validated models for unparalleled Radiotherapy Monitoring Devices Market insights. See full methodology.

Market Scope
Page number 292
Base year 2025
Historic period 2020-2024
Forecast period 2026-2030
Growth momentum & CAGR Accelerate at a CAGR of 6.7%
Market growth 2026-2030 USD 1259.3 million
Market structure Fragmented
YoY growth 2025-2026(%) 6.2%
Key countries US, Canada, Mexico, Germany, UK, France, Italy, The Netherlands, Spain, Russia, China, Japan, India, South Korea, Indonesia, Thailand, Singapore, Brazil, Australia, UAE, Saudi Arabia, South Africa and Turkey
Competitive landscape Leading Companies, Market Positioning of Companies, Competitive Strategies, and Industry Risks

Request Free Sample

Research Analyst Overview

  • The competitive landscape of the radiotherapy monitoring devices market is increasingly defined by the integration of hardware and intelligent software, compelling providers to make critical boardroom decisions on technology strategy. The convergence of image-guided radiation therapy (IGRT) and real-time motion management has shifted the focus toward comprehensive, end-to-end radiotherapy testing solutions.
  • This trend pressures companies to offer integrated platforms that can reduce setup times by over 25% compared to disjointed, multi-vendor systems. A key strategic consideration is whether to invest heavily in developing proprietary technologies, such as MR-compatible dosimetry hardware and tools for proton therapy beam monitoring, or to form partnerships that accelerate time-to-market.
  • The industry-wide push for higher precision in modalities like stereotactic body radiation therapy (SBRT) and deep inspiration breath hold (DIBH) techniques necessitates robust patient positioning systems and advanced dosimetric verification tools.
  • Ultimately, market leadership will depend on a company’s ability to deliver a seamless, automated workflow that enhances both safety and operational efficiency through technologies like VMAT and dose accumulation monitoring.

What are the Key Data Covered in this Radiotherapy Monitoring Devices Market Research and Growth Report?

  • What is the expected growth of the Radiotherapy Monitoring Devices Market between 2026 and 2030?

    • USD 1.26 billion, at a CAGR of 6.7%

  • What segmentation does the market report cover?

    • The report is segmented by Device (Imaging devices, Sensors and detectors, and Treatment planning systems), End-user (Hospitals, Diagnostic centers, and Cancer research institutes), Component (Hardware, and Software) and Geography (North America, Europe, Asia, Rest of World (ROW))

  • Which regions are analyzed in the report?

    • North America, Europe, Asia and Rest of World (ROW)

  • What are the key growth drivers and market challenges?

    • Technological advancements in real-time adaptive radiotherapy and AI Integration, High capital expenditure and budgetary constraints in healthcare

  • Who are the major players in the Radiotherapy Monitoring Devices Market?

    • Accuray Inc., Best Medical International Inc., Brainlab AG, C RAD AB, Elekta AB, Fluke Corp., GE Healthcare Technologies, Koninklijke Philips NV, LAP GmbH, Modus Medical Devices Inc., Orfit Industries NV, RaySearch Laboratories, ScandiDos AB, Siemens Healthineers AG, Thermo Fisher Scientific Inc., Varian Medical Systems Inc. and Vision RT Ltd.

Market Research Insights

  • The market is advancing toward sub-millimeter treatment accuracy, largely driven by patient demand for tattoo-less radiation therapy and protocols aimed at reducing treatment toxicity. This shift necessitates improved interoperability with linear accelerators and the adoption of AI in radiotherapy quality assurance. The clinical and financial benefits are significant; facilities using AI-enhanced monitoring have reported treatment time reductions of approximately 20%.
  • Furthermore, the move toward automated and software-based dose calculation is streamlining workflows, with some institutions achieving a 15% reduction in annual quality assurance labor costs. This focus on efficiency and safety is creating a competitive environment where integrated monitoring suites that can verify dose delivery accuracy in real time are becoming the industry standard, moving beyond basic non-invasive patient monitoring.

We can help! Our analysts can customize this radiotherapy monitoring devices market research report to meet your requirements.

Get in touch

1. Executive Summary

1.1 Market overview

Executive Summary - Chart on Market Overview
Executive Summary - Data Table on Market Overview
Executive Summary - Chart on Global Market Characteristics
Executive Summary - Chart on Market by Geography
Executive Summary - Chart on Market Segmentation by Device
Executive Summary - Chart on Market Segmentation by End-user
Executive Summary - Chart on Market Segmentation by Component
Executive Summary - Chart on Incremental Growth
Executive Summary - Data Table on Incremental Growth
Executive Summary - Chart on Company Market Positioning

2. Technavio Analysis

2.1 Analysis of price sensitivity, lifecycle, customer purchase basket, adoption rates, and purchase criteria

2.2 Criticality of inputs and Factors of differentiation

Chart on Overview on criticality of inputs and factors of differentiation

2.3 Factors of disruption

Chart on Overview on factors of disruption

2.4 Impact of drivers and challenges

Chart on Impact of drivers and challenges in 2025 and 2030

3. Market Landscape

3.1 Market ecosystem

Chart on Parent Market
Data Table on - Parent Market

3.2 Market characteristics

Chart on Market characteristics analysis

3.3 Value chain analysis

Chart on Value chain analysis

4. Market Sizing

4.1 Market definition

Data Table on Offerings of companies included in the market definition

4.2 Market segment analysis

Market segments

4.3 Market size 2025

4.4 Market outlook: Forecast for 2025-2030

Chart on Global - Market size and forecast 2025-2030 ($ million)
Data Table on Global - Market size and forecast 2025-2030 ($ million)
Chart on Global Market: Year-over-year growth 2025-2030 (%)
Data Table on Global Market: Year-over-year growth 2025-2030 (%)

5. Historic Market Size

5.1 Global Radiotherapy Monitoring Devices Market 2020 - 2024

Historic Market Size - Data Table on Global Radiotherapy Monitoring Devices Market 2020 - 2024 ($ million)

5.2 Device segment analysis 2020 - 2024

Historic Market Size - Device Segment 2020 - 2024 ($ million)

5.3 End-user segment analysis 2020 - 2024

Historic Market Size - End-user Segment 2020 - 2024 ($ million)

5.4 Component segment analysis 2020 - 2024

Historic Market Size - Component Segment 2020 - 2024 ($ million)

5.5 Geography segment analysis 2020 - 2024

Historic Market Size - Geography Segment 2020 - 2024 ($ million)

5.6 Country segment analysis 2020 - 2024

Historic Market Size - Country Segment 2020 - 2024 ($ million)

6. Qualitative Analysis

6.1 Impact of AI on the Global Radiotherapy Monitoring Devices Market

7. Five Forces Analysis

7.1 Five forces summary

Five forces analysis - Comparison between 2025 and 2030

7.2 Bargaining power of buyers

Bargaining power of buyers - Impact of key factors 2025 and 2030

7.3 Bargaining power of suppliers

Bargaining power of suppliers - Impact of key factors in 2025 and 2030

7.4 Threat of new entrants

Threat of new entrants - Impact of key factors in 2025 and 2030

7.5 Threat of substitutes

Threat of substitutes - Impact of key factors in 2025 and 2030

7.6 Threat of rivalry

Threat of rivalry - Impact of key factors in 2025 and 2030

7.7 Market condition

Chart on Market condition - Five forces 2025 and 2030

8. Market Segmentation by Device

8.1 Market segments

Chart on Device - Market share 2025-2030 (%)
Data Table on Device - Market share 2025-2030 (%)

8.2 Comparison by Device

Chart on Comparison by Device
Data Table on Comparison by Device

8.3 Imaging devices - Market size and forecast 2025-2030

Chart on Imaging devices - Market size and forecast 2025-2030 ($ million)
Data Table on Imaging devices - Market size and forecast 2025-2030 ($ million)
Chart on Imaging devices - Year-over-year growth 2025-2030 (%)
Data Table on Imaging devices - Year-over-year growth 2025-2030 (%)

8.4 Sensors and detectors - Market size and forecast 2025-2030

Chart on Sensors and detectors - Market size and forecast 2025-2030 ($ million)
Data Table on Sensors and detectors - Market size and forecast 2025-2030 ($ million)
Chart on Sensors and detectors - Year-over-year growth 2025-2030 (%)
Data Table on Sensors and detectors - Year-over-year growth 2025-2030 (%)

8.5 Treatment planning systems - Market size and forecast 2025-2030

Chart on Treatment planning systems - Market size and forecast 2025-2030 ($ million)
Data Table on Treatment planning systems - Market size and forecast 2025-2030 ($ million)
Chart on Treatment planning systems - Year-over-year growth 2025-2030 (%)
Data Table on Treatment planning systems - Year-over-year growth 2025-2030 (%)

8.6 Market opportunity by Device

Market opportunity by Device ($ million)
Data Table on Market opportunity by Device ($ million)

9. Market Segmentation by End-user

9.1 Market segments

Chart on End-user - Market share 2025-2030 (%)
Data Table on End-user - Market share 2025-2030 (%)

9.2 Comparison by End-user

Chart on Comparison by End-user
Data Table on Comparison by End-user

9.3 Hospitals - Market size and forecast 2025-2030

Chart on Hospitals - Market size and forecast 2025-2030 ($ million)
Data Table on Hospitals - Market size and forecast 2025-2030 ($ million)
Chart on Hospitals - Year-over-year growth 2025-2030 (%)
Data Table on Hospitals - Year-over-year growth 2025-2030 (%)

9.4 Diagnostic centers - Market size and forecast 2025-2030

Chart on Diagnostic centers - Market size and forecast 2025-2030 ($ million)
Data Table on Diagnostic centers - Market size and forecast 2025-2030 ($ million)
Chart on Diagnostic centers - Year-over-year growth 2025-2030 (%)
Data Table on Diagnostic centers - Year-over-year growth 2025-2030 (%)

9.5 Cancer research institutes - Market size and forecast 2025-2030

Chart on Cancer research institutes - Market size and forecast 2025-2030 ($ million)
Data Table on Cancer research institutes - Market size and forecast 2025-2030 ($ million)
Chart on Cancer research institutes - Year-over-year growth 2025-2030 (%)
Data Table on Cancer research institutes - Year-over-year growth 2025-2030 (%)

9.6 Market opportunity by End-user

Market opportunity by End-user ($ million)
Data Table on Market opportunity by End-user ($ million)

10. Market Segmentation by Component

10.1 Market segments

Chart on Component - Market share 2025-2030 (%)
Data Table on Component - Market share 2025-2030 (%)

10.2 Comparison by Component

Chart on Comparison by Component
Data Table on Comparison by Component

10.3 Hardware - Market size and forecast 2025-2030

Chart on Hardware - Market size and forecast 2025-2030 ($ million)
Data Table on Hardware - Market size and forecast 2025-2030 ($ million)
Chart on Hardware - Year-over-year growth 2025-2030 (%)
Data Table on Hardware - Year-over-year growth 2025-2030 (%)

10.4 Software - Market size and forecast 2025-2030

Chart on Software - Market size and forecast 2025-2030 ($ million)
Data Table on Software - Market size and forecast 2025-2030 ($ million)
Chart on Software - Year-over-year growth 2025-2030 (%)
Data Table on Software - Year-over-year growth 2025-2030 (%)

10.5 Market opportunity by Component

Market opportunity by Component ($ million)
Data Table on Market opportunity by Component ($ million)

11. Customer Landscape

11.1 Customer landscape overview

Analysis of price sensitivity, lifecycle, customer purchase basket, adoption rates, and purchase criteria

12. Geographic Landscape

12.1 Geographic segmentation

Chart on Market share by geography 2025-2030 (%)
Data Table on Market share by geography 2025-2030 (%)

12.2 Geographic comparison

Chart on Geographic comparison
Data Table on Geographic comparison

12.3 North America - Market size and forecast 2025-2030

Chart on North America - Market size and forecast 2025-2030 ($ million)
Data Table on North America - Market size and forecast 2025-2030 ($ million)
Chart on North America - Year-over-year growth 2025-2030 (%)
Data Table on North America - Year-over-year growth 2025-2030 (%)
Chart on Regional Comparison - North America
Data Table on Regional Comparison - North America

12.3.1 US - Market size and forecast 2025-2030

Chart on US - Market size and forecast 2025-2030 ($ million)
Data Table on US - Market size and forecast 2025-2030 ($ million)
Chart on US - Year-over-year growth 2025-2030 (%)
Data Table on US - Year-over-year growth 2025-2030 (%)

12.3.2 Canada - Market size and forecast 2025-2030

Chart on Canada - Market size and forecast 2025-2030 ($ million)
Data Table on Canada - Market size and forecast 2025-2030 ($ million)
Chart on Canada - Year-over-year growth 2025-2030 (%)
Data Table on Canada - Year-over-year growth 2025-2030 (%)

12.3.3 Mexico - Market size and forecast 2025-2030

Chart on Mexico - Market size and forecast 2025-2030 ($ million)
Data Table on Mexico - Market size and forecast 2025-2030 ($ million)
Chart on Mexico - Year-over-year growth 2025-2030 (%)
Data Table on Mexico - Year-over-year growth 2025-2030 (%)

12.4 Europe - Market size and forecast 2025-2030

Chart on Europe - Market size and forecast 2025-2030 ($ million)
Data Table on Europe - Market size and forecast 2025-2030 ($ million)
Chart on Europe - Year-over-year growth 2025-2030 (%)
Data Table on Europe - Year-over-year growth 2025-2030 (%)
Chart on Regional Comparison - Europe
Data Table on Regional Comparison - Europe

12.4.1 Germany - Market size and forecast 2025-2030

Chart on Germany - Market size and forecast 2025-2030 ($ million)
Data Table on Germany - Market size and forecast 2025-2030 ($ million)
Chart on Germany - Year-over-year growth 2025-2030 (%)
Data Table on Germany - Year-over-year growth 2025-2030 (%)

12.4.2 UK - Market size and forecast 2025-2030

Chart on UK - Market size and forecast 2025-2030 ($ million)
Data Table on UK - Market size and forecast 2025-2030 ($ million)
Chart on UK - Year-over-year growth 2025-2030 (%)
Data Table on UK - Year-over-year growth 2025-2030 (%)

12.4.3 France - Market size and forecast 2025-2030

Chart on France - Market size and forecast 2025-2030 ($ million)
Data Table on France - Market size and forecast 2025-2030 ($ million)
Chart on France - Year-over-year growth 2025-2030 (%)
Data Table on France - Year-over-year growth 2025-2030 (%)

12.4.4 Italy - Market size and forecast 2025-2030

Chart on Italy - Market size and forecast 2025-2030 ($ million)
Data Table on Italy - Market size and forecast 2025-2030 ($ million)
Chart on Italy - Year-over-year growth 2025-2030 (%)
Data Table on Italy - Year-over-year growth 2025-2030 (%)

12.4.5 The Netherlands - Market size and forecast 2025-2030

Chart on The Netherlands - Market size and forecast 2025-2030 ($ million)
Data Table on The Netherlands - Market size and forecast 2025-2030 ($ million)
Chart on The Netherlands - Year-over-year growth 2025-2030 (%)
Data Table on The Netherlands - Year-over-year growth 2025-2030 (%)

12.4.6 Spain - Market size and forecast 2025-2030

Chart on Spain - Market size and forecast 2025-2030 ($ million)
Data Table on Spain - Market size and forecast 2025-2030 ($ million)
Chart on Spain - Year-over-year growth 2025-2030 (%)
Data Table on Spain - Year-over-year growth 2025-2030 (%)

12.4.7 Russia - Market size and forecast 2025-2030

Chart on Russia - Market size and forecast 2025-2030 ($ million)
Data Table on Russia - Market size and forecast 2025-2030 ($ million)
Chart on Russia - Year-over-year growth 2025-2030 (%)
Data Table on Russia - Year-over-year growth 2025-2030 (%)

12.5 Asia - Market size and forecast 2025-2030

Chart on Asia - Market size and forecast 2025-2030 ($ million)
Data Table on Asia - Market size and forecast 2025-2030 ($ million)
Chart on Asia - Year-over-year growth 2025-2030 (%)
Data Table on Asia - Year-over-year growth 2025-2030 (%)
Chart on Regional Comparison - Asia
Data Table on Regional Comparison - Asia

12.5.1 China - Market size and forecast 2025-2030

Chart on China - Market size and forecast 2025-2030 ($ million)
Data Table on China - Market size and forecast 2025-2030 ($ million)
Chart on China - Year-over-year growth 2025-2030 (%)
Data Table on China - Year-over-year growth 2025-2030 (%)

12.5.2 Japan - Market size and forecast 2025-2030

Chart on Japan - Market size and forecast 2025-2030 ($ million)
Data Table on Japan - Market size and forecast 2025-2030 ($ million)
Chart on Japan - Year-over-year growth 2025-2030 (%)
Data Table on Japan - Year-over-year growth 2025-2030 (%)

12.5.3 India - Market size and forecast 2025-2030

Chart on India - Market size and forecast 2025-2030 ($ million)
Data Table on India - Market size and forecast 2025-2030 ($ million)
Chart on India - Year-over-year growth 2025-2030 (%)
Data Table on India - Year-over-year growth 2025-2030 (%)

12.5.4 South Korea - Market size and forecast 2025-2030

Chart on South Korea - Market size and forecast 2025-2030 ($ million)
Data Table on South Korea - Market size and forecast 2025-2030 ($ million)
Chart on South Korea - Year-over-year growth 2025-2030 (%)
Data Table on South Korea - Year-over-year growth 2025-2030 (%)

12.5.5 Indonesia - Market size and forecast 2025-2030

Chart on Indonesia - Market size and forecast 2025-2030 ($ million)
Data Table on Indonesia - Market size and forecast 2025-2030 ($ million)
Chart on Indonesia - Year-over-year growth 2025-2030 (%)
Data Table on Indonesia - Year-over-year growth 2025-2030 (%)

12.5.6 Thailand - Market size and forecast 2025-2030

Chart on Thailand - Market size and forecast 2025-2030 ($ million)
Data Table on Thailand - Market size and forecast 2025-2030 ($ million)
Chart on Thailand - Year-over-year growth 2025-2030 (%)
Data Table on Thailand - Year-over-year growth 2025-2030 (%)

12.5.7 Singapore - Market size and forecast 2025-2030

Chart on Singapore - Market size and forecast 2025-2030 ($ million)
Data Table on Singapore - Market size and forecast 2025-2030 ($ million)
Chart on Singapore - Year-over-year growth 2025-2030 (%)
Data Table on Singapore - Year-over-year growth 2025-2030 (%)

12.6 Rest of World (ROW) - Market size and forecast 2025-2030

Chart on Rest of World (ROW) - Market size and forecast 2025-2030 ($ million)
Data Table on Rest of World (ROW) - Market size and forecast 2025-2030 ($ million)
Chart on Rest of World (ROW) - Year-over-year growth 2025-2030 (%)
Data Table on Rest of World (ROW) - Year-over-year growth 2025-2030 (%)
Chart on Regional Comparison - Rest of World (ROW)
Data Table on Regional Comparison - Rest of World (ROW)

12.6.1 Brazil - Market size and forecast 2025-2030

Chart on Brazil - Market size and forecast 2025-2030 ($ million)
Data Table on Brazil - Market size and forecast 2025-2030 ($ million)
Chart on Brazil - Year-over-year growth 2025-2030 (%)
Data Table on Brazil - Year-over-year growth 2025-2030 (%)

12.6.2 Australia - Market size and forecast 2025-2030

Chart on Australia - Market size and forecast 2025-2030 ($ million)
Data Table on Australia - Market size and forecast 2025-2030 ($ million)
Chart on Australia - Year-over-year growth 2025-2030 (%)
Data Table on Australia - Year-over-year growth 2025-2030 (%)

12.6.3 UAE - Market size and forecast 2025-2030

Chart on UAE - Market size and forecast 2025-2030 ($ million)
Data Table on UAE - Market size and forecast 2025-2030 ($ million)
Chart on UAE - Year-over-year growth 2025-2030 (%)
Data Table on UAE - Year-over-year growth 2025-2030 (%)

12.6.4 Saudi Arabia - Market size and forecast 2025-2030

Chart on Saudi Arabia - Market size and forecast 2025-2030 ($ million)
Data Table on Saudi Arabia - Market size and forecast 2025-2030 ($ million)
Chart on Saudi Arabia - Year-over-year growth 2025-2030 (%)
Data Table on Saudi Arabia - Year-over-year growth 2025-2030 (%)

12.6.5 South Africa - Market size and forecast 2025-2030

Chart on South Africa - Market size and forecast 2025-2030 ($ million)
Data Table on South Africa - Market size and forecast 2025-2030 ($ million)
Chart on South Africa - Year-over-year growth 2025-2030 (%)
Data Table on South Africa - Year-over-year growth 2025-2030 (%)

12.6.6 Turkey - Market size and forecast 2025-2030

Chart on Turkey - Market size and forecast 2025-2030 ($ million)
Data Table on Turkey - Market size and forecast 2025-2030 ($ million)
Chart on Turkey - Year-over-year growth 2025-2030 (%)
Data Table on Turkey - Year-over-year growth 2025-2030 (%)

12.7 Market opportunity by geography

Market opportunity by geography ($ million)
Data Tables on Market opportunity by geography ($ million)

13. Drivers, Challenges, and Opportunity

13.1 Market drivers

Technological advancements in real-time adaptive radiotherapy and AI Integration
Rising global incidence of cancer and shift toward precision oncology
Stringent regulatory standards and emphasis on quality assurance protocols

13.2 Market challenges

High capital expenditure and budgetary constraints in healthcare
Shortage of qualified medical physicists and technical expertise
Interoperability issues and integration complexities with legacy systems

13.3 Impact of drivers and challenges

Impact of drivers and challenges in 2025 and 2030

13.4 Market opportunities

Integration of artificial intelligence for real-time adaptive quality assurance
Standardization of surface guided radiation therapy (SGRT)
Expansion of cloud-based centralized dosimetry management

14. Competitive Landscape

14.1 Overview

14.2

Overview on criticality of inputs and factors of differentiation

14.3 Landscape disruption

Overview on factors of disruption

14.4 Industry risks

Impact of key risks on business

15. Competitive Analysis

15.1 Companies profiled

Companies covered

15.2 Company ranking index

15.3 Market positioning of companies

Matrix on companies position and classification

15.4 Accuray Inc.

Accuray Inc. - Overview
Accuray Inc. - Product / Service
Accuray Inc. - Key offerings
SWOT

15.5 Brainlab AG

Brainlab AG - Overview
Brainlab AG - Product / Service
Brainlab AG - Key offerings
SWOT

15.6 C RAD AB

C RAD AB - Overview
C RAD AB - Product / Service
C RAD AB - Key offerings
SWOT

15.7 Elekta AB

Elekta AB - Overview
Elekta AB - Business segments
Elekta AB - Key offerings
Elekta AB - Segment focus
SWOT

15.8 Fluke Corp.

Fluke Corp. - Overview
Fluke Corp. - Product / Service
Fluke Corp. - Key offerings
SWOT

15.9 GE Healthcare Technologies

GE Healthcare Technologies - Overview
GE Healthcare Technologies - Business segments
GE Healthcare Technologies - Key news
GE Healthcare Technologies - Key offerings
GE Healthcare Technologies - Segment focus
SWOT

15.10 Koninklijke Philips NV

Koninklijke Philips NV - Overview
Koninklijke Philips NV - Business segments
Koninklijke Philips NV - Key news
Koninklijke Philips NV - Key offerings
Koninklijke Philips NV - Segment focus
SWOT

15.11 LAP GmbH

LAP GmbH - Overview
LAP GmbH - Product / Service
LAP GmbH - Key offerings
SWOT

15.12 Orfit Industries NV

Orfit Industries NV - Overview
Orfit Industries NV - Product / Service
Orfit Industries NV - Key offerings
SWOT

15.13 RaySearch Laboratories

RaySearch Laboratories - Overview
RaySearch Laboratories - Product / Service
RaySearch Laboratories - Key offerings
SWOT

15.14 ScandiDos AB

ScandiDos AB - Overview
ScandiDos AB - Product / Service
ScandiDos AB - Key offerings
SWOT

15.15 Siemens Healthineers AG

Siemens Healthineers AG - Overview
Siemens Healthineers AG - Business segments
Siemens Healthineers AG - Key news
Siemens Healthineers AG - Key offerings
Siemens Healthineers AG - Segment focus
SWOT

15.16 Thermo Fisher Scientific Inc.

Thermo Fisher Scientific Inc. - Overview
Thermo Fisher Scientific Inc. - Business segments
Thermo Fisher Scientific Inc. - Key news
Thermo Fisher Scientific Inc. - Key offerings
Thermo Fisher Scientific Inc. - Segment focus
SWOT

15.17 Varian Medical Systems Inc.

Varian Medical Systems Inc. - Overview
Varian Medical Systems Inc. - Product / Service
Varian Medical Systems Inc. - Key offerings
SWOT

15.18 Vision RT Ltd.

Vision RT Ltd. - Overview
Vision RT Ltd. - Product / Service
Vision RT Ltd. - Key offerings
SWOT

16. Appendix

16.1 Scope of the report

Market definition
Objectives
Notes and caveats

16.2 Inclusions and exclusions checklist

Inclusions checklist
Exclusions checklist

16.3 Currency conversion rates for US$

16.4 Research methodology

16.5 Data procurement

Information sources

16.6 Data validation

16.7 Validation techniques employed for market sizing

16.8 Data synthesis

16.9 360 degree market analysis

16.10 List of abbreviations

Research Methodology

Technavio presents a detailed picture of the market by way of study, synthesis, and summation of data from multiple sources. The analysts have presented the various facets of the market with a particular focus on identifying the key industry influencers. The data thus presented is comprehensive, reliable, and the result of extensive research, both primary and secondary.

INFORMATION SOURCES

Primary sources

  • Manufacturers and suppliers
  • Channel partners
  • Industry experts
  • Strategic decision makers

Secondary sources

  • Industry journals and periodicals
  • Government data
  • Financial reports of key industry players
  • Historical data
  • Press releases

DATA ANALYSIS

Data Synthesis

  • Collation of data
  • Estimation of key figures
  • Analysis of derived insights

Data Validation

  • Triangulation with data models
  • Reference against proprietary databases
  • Corroboration with industry experts

REPORT WRITING

Qualitative

  • Market drivers
  • Market challenges
  • Market trends
  • Five forces analysis

Quantitative

  • Market size and forecast
  • Market segmentation
  • Geographical insights
  • Competitive landscape

Interested in this report?

Get your sample now to see our research methodology and insights!

Download Now

Frequently Asked Questions

Radiotherapy Monitoring Devices market growth will increase by USD 1259.3 million during 2026-2030 .

The Radiotherapy Monitoring Devices market is expected to grow at a CAGR of 6.7% during 2026-2030 .

Radiotherapy Monitoring Devices market is segmented by Device (Imaging devices, Sensors and detectors, Treatment planning systems) End-user (Hospitals, Diagnostic centers, Cancer research institutes) Component (Hardware, Software)

Accuray Inc., Best Medical International Inc., Brainlab AG, C RAD AB, Elekta AB, Fluke Corp., GE Healthcare Technologies, Koninklijke Philips NV, LAP GmbH, Modus Medical Devices Inc., Orfit Industries NV, RaySearch Laboratories, ScandiDos AB, Siemens Healthineers AG, Thermo Fisher Scientific Inc., Varian Medical Systems Inc., Vision RT Ltd. are a few of the key vendors in the Radiotherapy Monitoring Devices market.

North America will register the highest growth rate of 33.1% among the other regions. Therefore, the Radiotherapy Monitoring Devices market in North America is expected to garner significant business opportunities for the vendors during the forecast period.

US, Canada, Mexico, Germany, UK, France, Italy, The Netherlands, Spain, Russia, China, Japan, India, South Korea, Indonesia, Thailand, Singapore, Brazil, Australia, UAE, Saudi Arabia, South Africa, Turkey

  • Technological advancements in real-time adaptive radiotherapy and AI Integration is the driving factor this market.

The Radiotherapy Monitoring Devices market vendors should focus on grabbing business opportunities from the Device segment as it accounted for the largest market share in the base year.