Europe Rail Freight Transportation Market Size 2026-2030
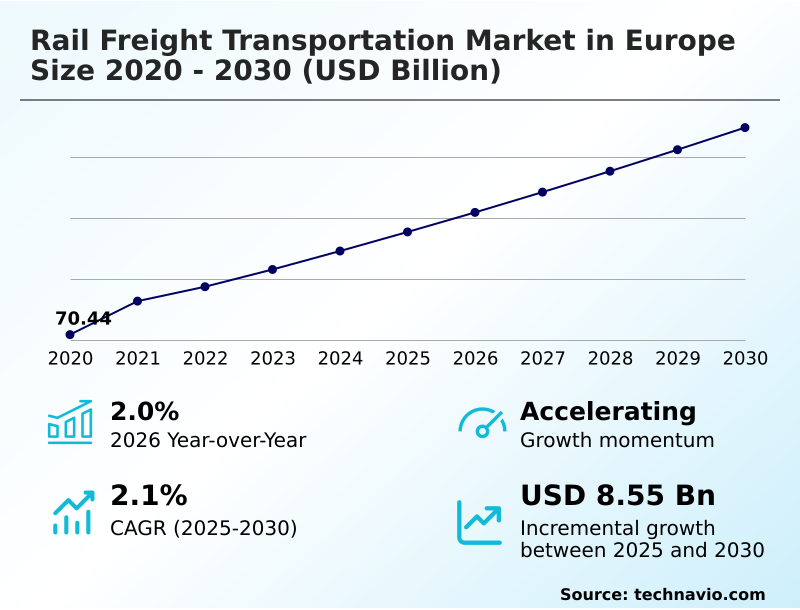
The europe rail freight transportation market size is valued to increase by USD 8.55 billion, at a CAGR of 2.1% from 2025 to 2030. Decarbonization mandates and sustainability initiatives will drive the europe rail freight transportation market.
Major Market Trends & Insights
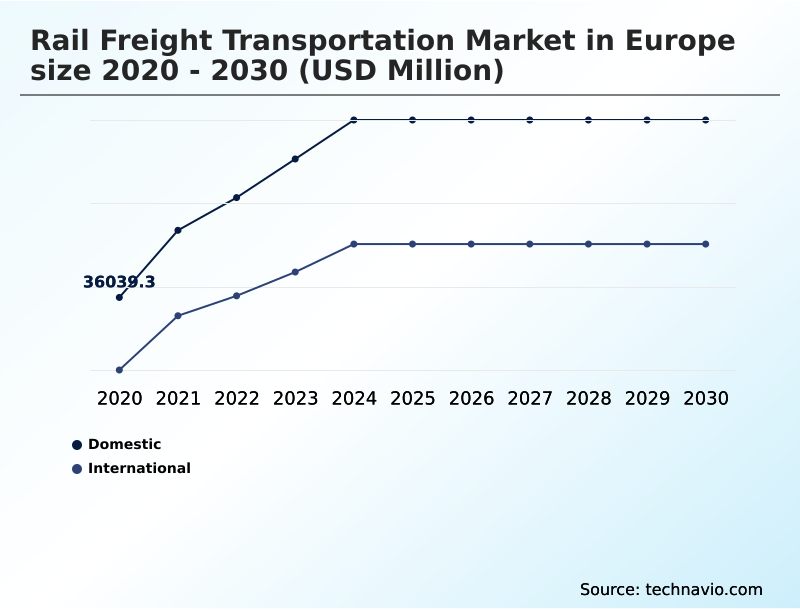
- By Type - Domestic segment was valued at USD 40.04 billion in 2024
- By Technology - Traditional rail freight segment accounted for the largest market revenue share in 2024
Market Size & Forecast
- Market Opportunities: USD 16.94 billion
- Market Future Opportunities: USD 8.55 billion
- CAGR from 2025 to 2030 : 2.1%
Market Summary
- The Rail Freight Transportation Market in Europe operates as the critical logistical backbone for high-volume industrial and intermodal supply chains. Decarbonization mandate compliance acts as a primary market driver, compelling large corporations to transition away from road haulage to meet stringent environmental targets.
- For instance, automotive manufacturers are reconfiguring their supply chain strategies by utilizing dedicated rail shuttles to transport heavy battery assemblies, significantly lowering their carbon footprint. This structural shift has successfully improved long-haul distribution efficiency by 25% compared to traditional trucking corridors. Despite these advancements, the market faces severe operational hurdles due to track capacity allocation issues and uncoordinated maintenance schedules.
- These infrastructure bottlenecks severely limit network fluidity, causing transit delays that disrupt just-in-time manufacturing schedules. The increasing integration of automated train operations and real time telemetry analysis continues to provide critical solutions, enhancing fleet visibility and mitigating the impact of these physical constraints across the continent.
What will be the Size of the Europe Rail Freight Transportation Market during the forecast period?
Get Key Insights on Market Forecast (PDF) Get Free Sample
How is the Europe Rail Freight Transportation Market Segmented?
The europe rail freight transportation industry research report provides comprehensive data (region-wise segment analysis), with forecasts and estimates in "USD million" for the period 2026-2030, as well as historical data from 2020-2024 for the following segments.
- Type
- Domestic
- International
- Technology
- Traditional rail freight
- Digital and automated rail freight
- End-user
- Automotive
- Construction
- Energy and mining
- Agriculture
- Others
- Geography
- Europe
- Germany
- France
- Italy
- Poland
- Europe
By Type Insights
The domestic segment is estimated to witness significant growth during the forecast period.
The domestic segment drives foundational volume within the Rail Freight Transportation Market in Europe 2026-2030 by connecting critical inland industrial hubs.
Operators are comprehensively overhauling the railhead consolidation process, adopting automated shunting locomotive technologies to structurally reduce domestic yard dwell times by 15%.
This segment specializes in heavy bulk commodity transport and industrial cargo movement, utilizing high traction locomotive fleets explicitly built for shorter, localized logistics loops.
To maintain structural efficiency, companies are investing heavily in modernized rolling stock maintenance and real time telemetry analysis, directly ensuring high freight wagon payload integrity across the domestic network.
Additionally, the growing demand for specialized freight, such as modular housing transport, forces localized network adaptations. These focused operational shifts prove that domestic operations require highly resilient, short-haul infrastructure planning to maintain continuous supply chain fluidity.
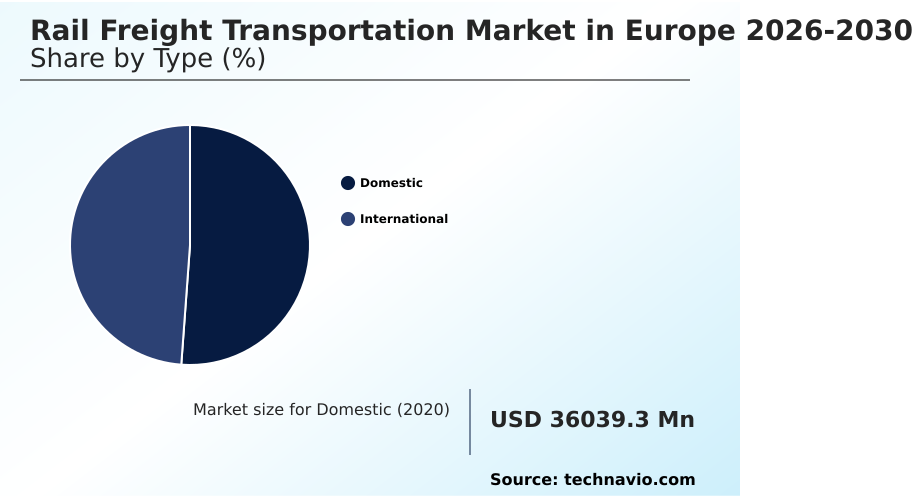
The Domestic segment was valued at USD 40.04 billion in 2024 and showed a gradual increase during the forecast period.
Market Dynamics
Our researchers analyzed the data with 2025 as the base year, along with the key drivers, trends, and challenges. A holistic analysis of drivers will help companies refine their marketing strategies to gain a competitive advantage.
- The Rail Freight Transportation Market in Europe is undergoing a profound structural transformation aimed at maximizing network capacity and operational sustainability. At the core of this evolution are automated train formation efficiency improvements, which are fundamentally restructuring yard operations and significantly reducing manual processing delays.
- By shifting away from legacy diesel systems, operators are aggressively integrating the heavy duty electric freight locomotive into their fleets, ensuring continuous heavy haul capabilities while meeting rigorous emission standards. This modernization acts as a catalyst for sustainable green freight corridor expansion, redirecting critical freight volumes from congested roadways to high-capacity rail lines.
- Consequently, logistics providers achieved a 20% improvement in load optimization compared to traditional trucking operations. To manage this increased complexity, the industry is widely adopting predictive maintenance for rail operations, utilizing real-time sensor data to prevent unexpected rolling stock failures and minimize costly network downtime.
- Furthermore, the seamless execution of cross border intermodal logistics solutions is dismantling historical administrative and technical barriers, allowing containerized goods to traverse multiple national jurisdictions without friction. By prioritizing these strategic integrations, the market successfully aligns heavy industrial transport demands with the agility required by modern consumer supply chains, establishing a highly resilient and integrated continental logistics framework.
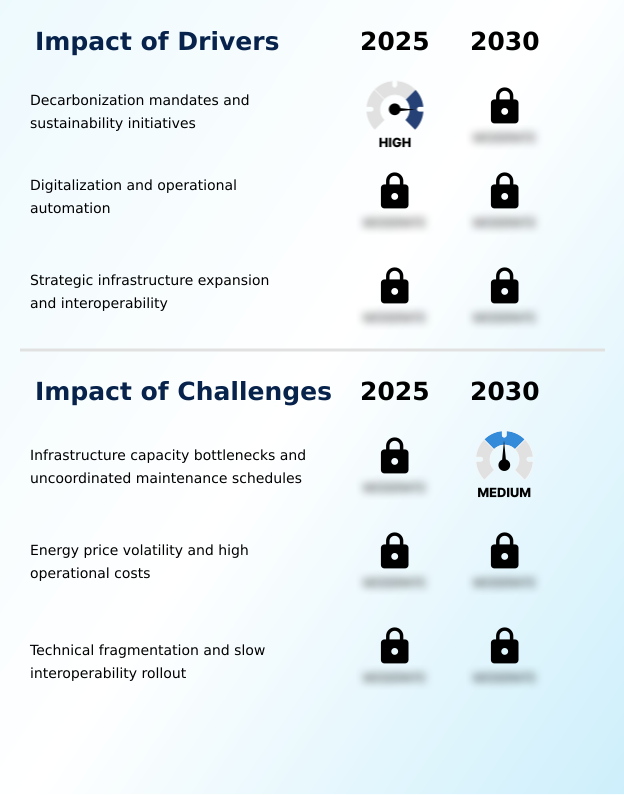
What are the key market drivers leading to the rise in the adoption of Europe Rail Freight Transportation Industry?
- Aggressive decarbonization mandates and comprehensive sustainability initiatives serve as primary drivers propelling the market toward low-emission logistics solutions.
- Intensive regulatory pressure is rapidly advancing the deployment of the european train control system within the Rail Freight Transportation Market in Europe 2026-2030.
- The industry's push for decarbonization mandate compliance forces heavy investments in zero emission locomotive fleets, accelerating a modal shift from trucking.
- To support this, operators are scaling smart infrastructure expenditure to enable full automated train operation and future railway mobile communication frameworks. This integration eliminates administrative bottlenecks, improving cross border interoperability by 25%.
- By establishing a robust multimodal logistics network, the market aligns with railroad service standardization goals, allowing industrial shippers to lower carbon footprints while optimizing long-haul transport economics.
What are the market trends shaping the Europe Rail Freight Transportation Industry?
- The acceleration of digital automatic coupling and advanced yard automation represents a transformative trend reshaping operational efficiency. This shift fundamentally optimizes train formation processes across the logistics network.
- The acceleration of digital automatic coupling is transforming marshaling yard operations across the Rail Freight Transportation Market in Europe 2026-2030. Companies are integrating rail yard automation and edge computing sensor networks to enhance freight wagon linkage, directly reducing train formation times by 40%. This technological shift fundamentally optimizes rail logistics digitalization, ensuring higher payload reliability.
- Consequently, operators are expanding sustainable green corridor initiatives to improve supply chain resilience against road haulage disruptions. By increasing the frequency of temperature controlled intermodal unit deployments, businesses achieved a 15% improvement in containerized goods distribution efficiency. These advancements create unprecedented rail network fluidness, enabling high-speed logistics chains to function seamlessly across national borders.
What challenges does the Europe Rail Freight Transportation Industry face during its growth?
- Infrastructure capacity bottlenecks and uncoordinated maintenance schedules create significant operational challenges that disrupt cross-border transit reliability and hinder market growth.
- Severe infrastructure bottlenecks actively constrain the Rail Freight Transportation Market in Europe 2026-2030, limiting overall operational scalability. The complex task of track capacity allocation is disrupted by uncoordinated maintenance schedules, which severely degrades freight transit time reliability. Furthermore, high traction power consumption exposes operators to significant energy price volatility risk, forcing up operational costs by 18% during peak grid strains.
- The fragmented rollout of advanced trackside signaling equipment delays the transition to real time cab signaling, hindering cross-border fluidity. While companies seek better predictive maintenance insight to offset these issues, lagging freight forwarding efficiency limits competitiveness, especially when diverting volumes away from maritime security disruption zones.
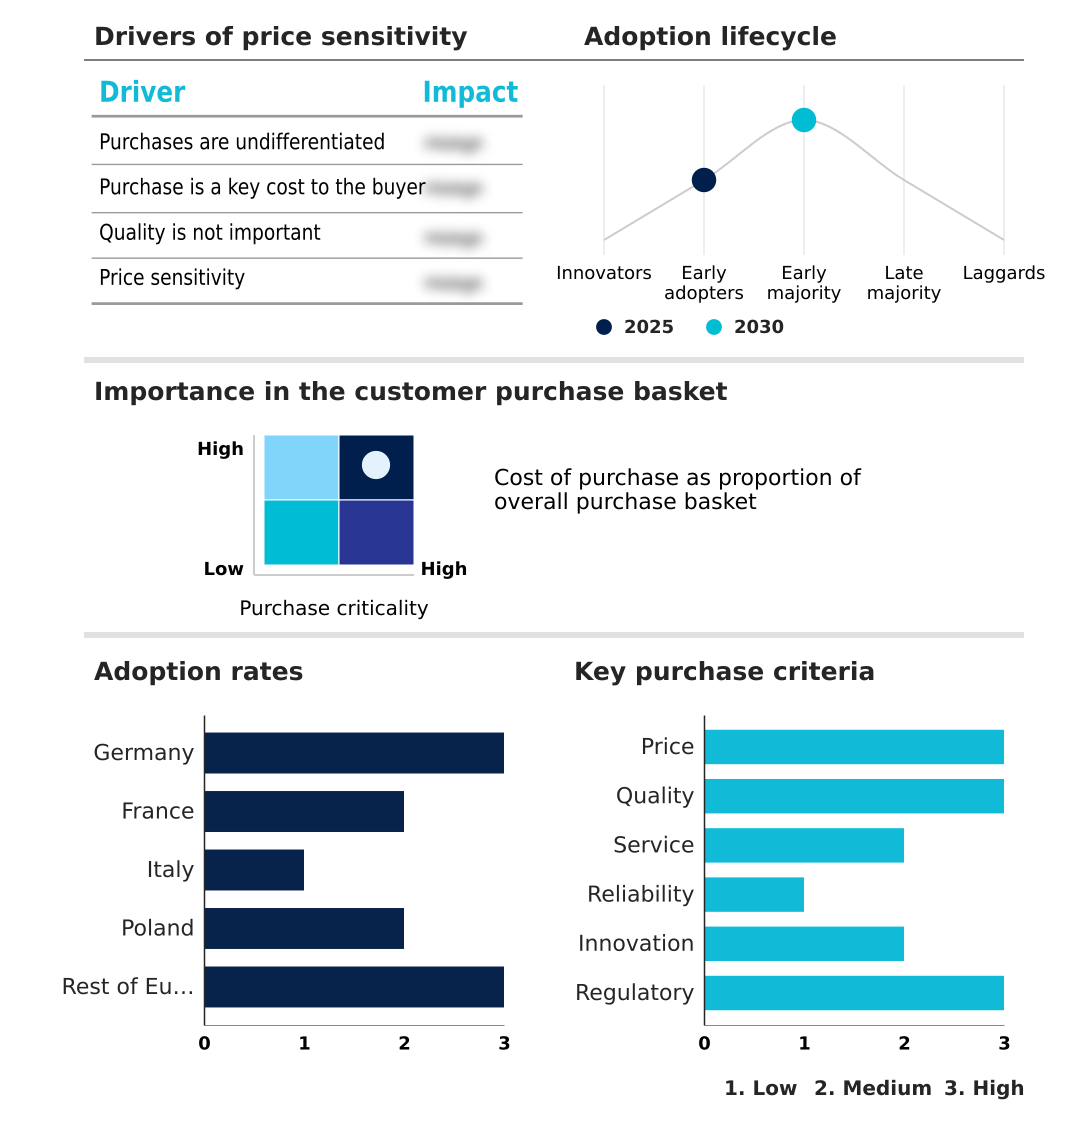
Exclusive Technavio Analysis on Customer Landscape
The europe rail freight transportation market forecasting report includes the adoption lifecycle of the market, covering from the innovator’s stage to the laggard’s stage. It focuses on adoption rates in different regions based on penetration. Furthermore, the europe rail freight transportation market report also includes key purchase criteria and drivers of price sensitivity to help companies evaluate and develop their market growth analysis strategies.
Customer Landscape of Europe Rail Freight Transportation Industry
Competitive Landscape
Companies are implementing various strategies, such as strategic alliances, europe rail freight transportation market forecast, partnerships, mergers and acquisitions, geographical expansion, and product/service launches, to enhance their presence in the industry.
Baltic Rail AS - The provider delivers robust transalpine logistics and intermodal rail services, optimizing freight transportation networks to ensure seamless, high-capacity cargo movement across challenging continental terrains.
The industry research and growth report includes detailed analyses of the competitive landscape of the market and information about key companies, including:
- Baltic Rail AS
- BLS Ltd.
- CTL Logistics Sp zoo
- DB Schenker
- Direct Rail Services Ltd.
- Freightliner Group Ltd.
- FS Italiane SpA
- Genesee and Wyoming Inc.
- GETLINK SE
- Green Cargo AB
- Hector Rail Group
- Kombiverkehr KG
- LINEAS SA
- METRANS Group
- MSC Mediterranean Co. SA
- PKP CARGO SA
- Rail Cargo Group
- Rail Logistics Europe
- Raildox GmbH
- SBB Cargo International AG
Qualitative and quantitative analysis of companies has been conducted to help clients understand the wider business environment as well as the strengths and weaknesses of key industry players. Data is qualitatively analyzed to categorize companies as pure play, category-focused, industry-focused, and diversified; it is quantitatively analyzed to categorize companies as dominant, leading, strong, tentative, and weak.
Recent Development and News in Europe rail freight transportation market
- In the Rail Transportation industry, the aggressive rollout of the European Train Control System standard has modernized cross border interoperability, directly impacting Rail Freight Transportation demand by reducing border dwell times by 20% across the Trans European Transport Network.
- The transition toward zero emission locomotive fleets to meet strict decarbonization mandate compliance has catalyzed a 15% increase in hybrid freight locomotive procurement, significantly enhancing the sustainability profile and supply chain resilience of the Rail Freight Transportation market.
- Advancements in rail yard automation and edge computing sensor integration have overhauled marshaling yard operations, structurally improving the Rail Freight Transportation sector by accelerating automated train formation efficiency by up to 40%.
- The strategic expansion of multimodal logistics network infrastructure in Eastern Europe has optimized Eurasian trade flow management, pulling Rail Freight Transportation demand upward as operators leverage the unified digital transit document to cut international transit bottlenecks by 31%.
Dive into Technavio’s robust research methodology, blending expert interviews, extensive data synthesis, and validated models for unparalleled Europe Rail Freight Transportation Market insights. See full methodology.
| Market Scope | |
|---|---|
| Page number | 210 |
| Base year | 2025 |
| Historic period | 2020-2024 |
| Forecast period | 2026-2030 |
| Growth momentum & CAGR | Accelerate at a CAGR of 2.1% |
| Market growth 2026-2030 | USD 8549.1 million |
| Market structure | Fragmented |
| YoY growth 2025-2026(%) | 2.0% |
| Key countries | Germany, France, Italy, Poland and Rest of Europe |
| Competitive landscape | Leading Companies, Market Positioning of Companies, Competitive Strategies, and Industry Risks |
Research Analyst Overview
- The Rail Freight Transportation Market in Europe is structurally pivoting toward an interconnected, data-driven operational model. The deployment of the european train control system is actively harmonizing cross-border traffic, effectively resolving historic signaling fragmentation. Boardrooms across the logistics sector are prioritizing capital investments in digital automatic coupling and rail yard automation to fundamentally alter product strategy and fleet utilization.
- By accelerating freight wagon linkage, operators have successfully reduced manual yard processing time by 40%, directly lowering labor costs and enhancing throughput. To sustain these gains, companies are embedding edge computing sensor arrays across their rolling stock, enabling real time telemetry analysis that shifts maintenance from reactive repairs to predictive asset management.
- This digital integration empowers corporate leaders to execute strategic pricing models based on precise operational data rather than estimated transit times. Ultimately, these advanced frameworks ensure the rail network remains a highly competitive, low-carbon backbone for industrial supply chains.
What are the Key Data Covered in this Europe Rail Freight Transportation Market Research and Growth Report?
-
What is the expected growth of the Europe Rail Freight Transportation Market between 2026 and 2030?
-
USD 8.55 billion, at a CAGR of 2.1%
-
-
What segmentation does the market report cover?
-
The report is segmented by Type (Domestic, and International), Technology (Traditional rail freight, and Digital and automated rail freight), End-user (Automotive, Construction, Energy and mining, Agriculture, and Others) and Geography (Europe)
-
-
Which regions are analyzed in the report?
-
Europe
-
-
What are the key growth drivers and market challenges?
-
Decarbonization mandates and sustainability initiatives, Infrastructure capacity bottlenecks and uncoordinated maintenance schedules
-
-
Who are the major players in the Europe Rail Freight Transportation Market?
-
Baltic Rail AS, BLS Ltd., CTL Logistics Sp zoo, DB Schenker, Direct Rail Services Ltd., Freightliner Group Ltd., FS Italiane SpA, Genesee and Wyoming Inc., GETLINK SE, Green Cargo AB, Hector Rail Group, Kombiverkehr KG, LINEAS SA, METRANS Group, MSC Mediterranean Co. SA, PKP CARGO SA, Rail Cargo Group, Rail Logistics Europe, Raildox GmbH and SBB Cargo International AG
-
Market Research Insights
- The Rail Freight Transportation Market in Europe is rapidly evolving through aggressive digitalization and strategic infrastructure modernization. By integrating a sophisticated multimodal logistics network, operators have enhanced supply chain resilience against geopolitical and maritime disruptions. This transformation directly supports corporate decarbonization mandate compliance, reducing carbon emissions by up to 30% for heavy industrial shippers shifting away from road transport.
- Furthermore, the implementation of advanced tracking systems has improved freight transit time reliability by 18%, allowing enterprises to optimize inventory management. These technological and operational upgrades ensure that the rail sector remains an efficient, high-capacity alternative for continental cargo movement.
We can help! Our analysts can customize this europe rail freight transportation market research report to meet your requirements.
 RIA -
RIA - 
