Rare Earth Metals Market Analysis APAC, North America, Europe, Middle East and Africa, South America - China, Japan, US, India, South Korea, Vietnam, Germany, UK, Canada - Size and Forecast 2025-2029

Rare Earth Metals Market Analysis APAC, North America, Europe, Middle East and Africa, South America - China, Japan, US, India, South Korea, Vietnam, Germany, UK, Canada - Size and Forecast 2025-2029

Published: Mar 2025 231 Pages SKU: IRTNTR43187

Market Overview at a Glance

$3.78 B
Market Opportunity
9.1%
CAGR
8.6
YoY growth 2024-2025(%)

Rare Earth Metals Market Size 2025-2029

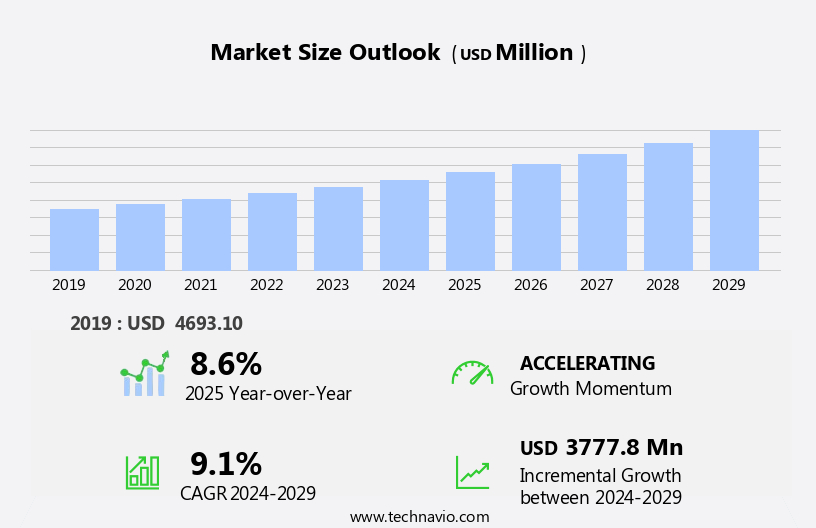
The rare earth metals market size is forecast to increase by USD 3.78 billion at a CAGR of 9.1% between 2024 and 2029.

  • The market is experiencing significant growth due to the increasing demand for electronic appliances and personal equipment, driven by global consumer trends and technological advancements. This demand is further fueled by the expansion of production capacities and the emergence of alternative suppliers, which are aiming to reduce dependence on traditional sources. However, market growth is not without challenges. Demand-supply imbalances persist due to the complex and often unpredictable nature of rare earth metal mining and production. Moreover, the rise of substitutes, such as recycling and the development of new technologies, is posing a threat to market players.
  • Companies seeking to capitalize on market opportunities must stay abreast of these trends and navigate challenges effectively by investing in research and development, exploring alternative supply chains, and collaborating with industry partners to ensure a stable and sustainable supply of rare earth metals.

What will be the Size of the Rare Earth Metals Market during the forecast period?

Rare Earth Metals Market Size

 Request Free Sample

  • Rare earth metals, a group of 17 elements on the periodic table, play a crucial role in various industries, particularly in consumer equipment, catalyst systems, and green technology. These metals are essential for catalyst systems in industrial processes and are key components in magnets used in applications such as permanent magnets in gadolinium magnets and neodymium magnets. The demand for rare earth metals is driven by their use in electric vehicles, electronic appliances, and battery production. The supply chain for these metals is complex, with a significant portion extracted from concentrated deposits. However, resource scarcity and the environmental impact of metal extraction have led to increased focus on recycling efforts.
  • Industrial uses of rare earth metals extend beyond magnets, with applications in battery production, wind turbines, and various other industries. The market dynamics for rare earth metals are influenced by production capacities, demand for specific metals, and the challenges of extracting them from the earth's crust. Catalyst systems, magnet applications, and green technology are just a few areas where rare earth metals contribute significantly. As the world transitions to more sustainable energy sources and electric vehicles become more prevalent, the demand for these metals is expected to grow.

How is this Rare Earth Metals Industry segmented?

The rare earth metals industry research report provides comprehensive data (region-wise segment analysis), with forecasts and estimates in "USD million" for the period 2025-2029, as well as historical data from 2019-2023 for the following segments.

  • Application
    • Permanent magnets
    • Metal alloys
    • Catalysts
    • Polishing powder
    • Others
  • Type
    • Light rare earth elements
    • Heavy rare earth elements
    • Others
  • Product
    • Cerium
    • Dysprosium
    • Erbium
    • Others
  • Geography
    • APAC
      • China
      • India
      • Japan
      • South Korea
      • Vietnam
    • North America
      • US
      • Canada
    • Europe
      • Germany
      • UK
    • Middle East and Africa
      • South America

      By Application Insights

      The permanent magnets segment is estimated to witness significant growth during the forecast period.

      Rare earth metals, primarily including neodymium, pradymium, dysprosium, gadolinium, terbium, and samarium, are essential components for producing rare earth magnets. These magnets are integral to various high-tech technologies, such as military equipment, consumer electronics, automotive industries, and renewable energy solutions like wind turbines. Neodymium oxide, a rare earth oxide, is a significant component of Neodymium-iron-boron (NdFeB) magnets, which are widely used in applications ranging from audio and video components to automobiles and electric vehicles. China, as a leading consumer and supplier, dominates the market for NdFeB magnets and exports a substantial amount of these magnets. The environmental impacts of rare earth mining, including water contamination and habitat destruction, as well as air contamination, have raised concerns regarding the sustainability of this industry.

      However, the increasing demand for clean energy and renewable energy sources, such as LED lamps and wind turbines, necessitates the continued production and capacity expansion. Geopolitical factors and the concentration of rare earth deposits in specific regions contribute to supply chain complexities. Furthermore, rare earth magnets play a crucial role in catalyst systems, glass & ceramics, and various other industries. The evolving market dynamics and trends necessitate a comprehensive of the market and its implications on various industries.

      Rare Earth Metals Market Size

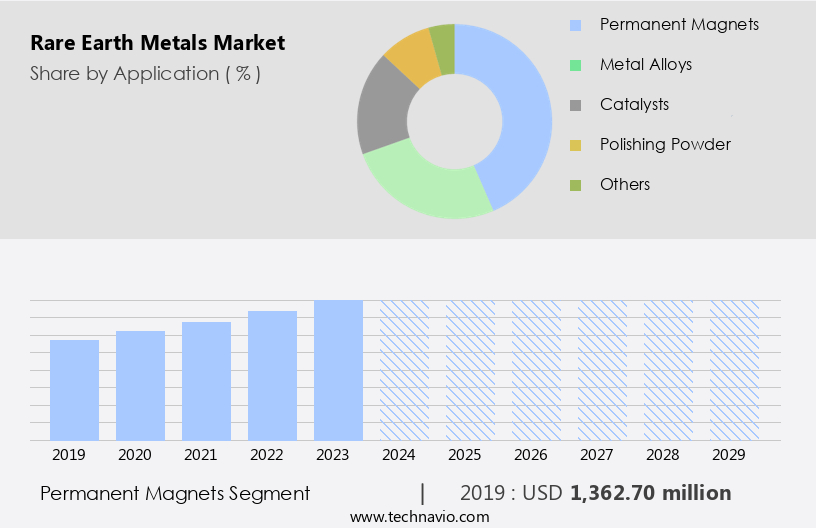
      Get a glance at the market report of share of various segments Request Free Sample

      The Permanent magnets segment was valued at USD 1.36 billion in 2019 and showed a gradual increase during the forecast period.

      Regional Analysis

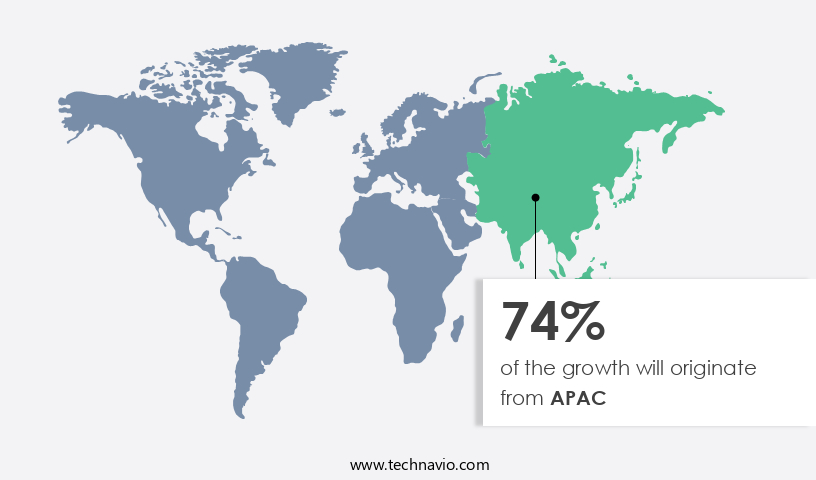
      APAC is estimated to contribute 74% to the growth of the global market during the forecast period.Technavio’s analysts have elaborately explained the regional trends and drivers that shape the market during the forecast period.

      Rare Earth Metals Market Share by Geography

      For more insights on the market size of various regions, Request Free Sample

      The market in Asia Pacific is experiencing significant growth due to the escalating demand from the automotive and technology sectors in the region. The region's rapid economic expansion and increasing standard of living are driving the desire for personal technology and advanced appliances, such as mobile phones, televisions, and computers. China has been a dominant player in the production of rare earth oxides since the 1980s, exporting these materials at competitive prices and forcing many emerging production capacities to cease operations. However, China's gradual reduction of export quotas has disrupted global supplies and driven up the prices of rare earth metals.

      These metals, located on the periodic table, are essential components of high-tech technologies, including neodymium oxide used in rare earth magnets, which are integral to wind turbines and electric vehicles. The mining of these metals, however, poses environmental challenges, including water contamination and habitat destruction, as well as air contamination. Despite these concerns, the demand for rare earth metals continues to grow due to their role in clean energy and renewable technologies, such as LED lamps, glass and ceramics, and catalyst systems. The geopolitical factors surrounding the production and distribution of rare earth metals add complexity to the market dynamics.

      Concentrated deposits of these metals are found in a few countries, making supply chain vulnerabilities a significant concern. The mining of rare earth metals also raises ethical considerations, as it can lead to human rights violations and labor exploitation. In , the market is characterized by increasing demand, supply chain vulnerabilities, and environmental and ethical concerns. The market's evolution is shaped by the interplay of technological advancements, geopolitical factors, and the demand for clean energy and renewable technologies.

      Market Dynamics

      Our researchers analyzed the data with 2024 as the base year, along with the key drivers, trends, and challenges. A holistic analysis of drivers will help companies refine their marketing strategies to gain a competitive advantage.

      What are the key market drivers leading to the rise in the adoption of Rare Earth Metals Industry?

      • Growing demand for electronic appliances and personal equipment is the key driver of the market. 

      • Rare earth metals, specifically compounds of yttrium, terbium, cerium, and gadolinium, play a crucial role in the manufacturing of various electronic appliances, including liquid crystal displays (LCDs) and smartphones. These elements exhibit electro phosphorescence, which results in color variations upon electric discharge. Apart from their use in electronics, rare earth metals are also employed in energy-efficient lighting and magnetic refrigeration. The latter is predominantly used for industrial applications, with consumer adoption yet to gain significant traction. The global market for rare earth metals is driven by several factors, including rising disposable incomes, technological advancements, and decreasing microprocessor prices.
      • These trends have led to an increased demand for personal gadgets such as laptops, mobile phones, and tablets worldwide. As a result, the demand for rare earth metals, which are essential components in the production of these devices, is expected to grow. In , the market is poised for growth due to the increasing demand for electronic appliances and technological advancements. The use of these metals in energy-efficient lighting and magnetic refrigeration is also expanding, although consumer adoption in the latter application is still in its infancy. The global market dynamics are driven by factors such as rising disposable incomes, technological advancements, and falling microprocessor prices.

      What are the market trends shaping the Rare Earth Metals Industry?

      • Rise in production capacities and emergence of alternative suppliers is the upcoming market trend. 

      • Rare earth metals have gained significant importance in global trade due to their extensive usage in various industries, including electronics, defense, and renewable energy. The increasing demand for these metals, which are essential for the production of high-tech products, has led several countries to explore and exploit their domestic reserves. India, South Africa, Brazil, Australia, Canada, Vietnam, and Malaysia are among the countries investing heavily in this sector. These nations aim to reduce their reliance on China, the world's largest rare earth metals producer and exporter, and emerge as reliable alternative suppliers. In June 2022, Lynas Rare Earths secured a USD120m contract from the US Department of Defense (DoD) for constructing a commercial heavy rare earths (HRE) separation facility in Texas.
      • This development underscores the strategic importance of these metals for defense applications and the efforts being made to secure a stable supply chain. The new rare earth element resources in North America, Australia, and Africa are also contributing to the sector's growth. This trend is expected to continue, as the demand for rare earth metals continues to rise due to their indispensable role in modern technology.

      What challenges does the Rare Earth Metals Industry face during its growth?

      • Demand-supply outages and the rise of substitutes is a key challenge affecting the industry growth. 

      • The market is characterized by a significant imbalance between supply and demand. With the demand for rare earth elements (REEs) doubling over the past 15 years to reach 125,000 tons, the market faces challenges in ensuring a consistent and secure supply. REEs, including neodymium (Nd), pradymium (Pr), dysprosium (Dy), and terbium (Tb), are essential raw materials for clean technologies, such as electric vehicles and wind turbines. However, the supply of REEs is heavily concentrated in a few countries, leading to concerns about supply security and potential trade friction. This geographical concentration intensifies international competition and geopolitical risks.
      • Consequently, trade plays a crucial role in the distribution of rare earth oxides to various end-use industries worldwide. The uneven distribution of REEs necessitates a focus on strategic partnerships and alternative supply sources to mitigate risks and ensure a stable supply chain. Despite these challenges, the market for rare earth metals is expected to grow, driven by the increasing adoption of clean technologies and the global transition towards a low-carbon economy.

      Exclusive Customer Landscape

      The rare earth metals market forecasting report includes the adoption lifecycle of the market, covering from the innovator’s stage to the laggard’s stage. It focuses on adoption rates in different regions based on penetration. Furthermore, the rare earth metals market report also includes key purchase criteria and drivers of price sensitivity to help companies evaluate and develop their market growth analysis strategies.

      Rare Earth Metals Market Share by Geography

       Customer Landscape

      Key Companies & Market Insights

      Companies are implementing various strategies, such as strategic alliances, rare earth metals market forecast, partnerships, mergers and acquisitions, geographical expansion, and product/service launches, to enhance their presence in the industry.

      Alkane Resources Ltd. - The company specializes in providing comprehensive mining and exploration services for the extraction of rare earth metals, leveraging advanced techniques and industry expertise to maximize resource potential and ensure sustainable operations. Our offerings encompass the entire mining value chain, from initial prospecting and exploration to mine development, production, and reclamation. By combining technical proficiency with a commitment to environmental stewardship, we deliver innovative solutions that meet the evolving demands of the global market for rare earth metals.

      The industry research and growth report includes detailed analyses of the competitive landscape of the market and information about key companies, including:

      • Alkane Resources Ltd.
      • Arafura Rare Earths Ltd.
      • Arnold Magnetic Technologies Corp.
      • Avalon Advanced Materials Inc.
      • Canada Rare Earth Corp.
      • Energy Transition Minerals Ltd.
      • Frontier Rare Earths Ltd.
      • HEFA Rare Earth Canada Co. Ltd.
      • Hitachi Ltd.
      • Iluka Resources Ltd.
      • IREL India Ltd.
      • Lynas Rare Earths Ltd.
      • Montero Mining and Exploration Ltd.
      • Namibia Critical Metals Inc.
      • Neo Performance Materials Inc.
      • Northern Minerals Ltd.
      • Rare Element Resources Ltd.
      • Shin Etsu Chemical Co. Ltd.
      • Resonac Holdings Corp.

      Qualitative and quantitative analysis of companies has been conducted to help clients understand the wider business environment as well as the strengths and weaknesses of key industry players. Data is qualitatively analyzed to categorize companies as pure play, category-focused, industry-focused, and diversified; it is quantitatively analyzed to categorize companies as dominant, leading, strong, tentative, and weak.

      Research Analyst Overview

      Rare earth metals, a group of 17 elements located at the bottom of the periodic table, play a crucial role in various high-tech technologies. These metals, including neodymium oxide and pradymium oxide, are essential components in the production of rare earth magnets, which are integral to the functioning of wind turbines and electric vehicles. The global market for rare earth metals has experienced significant fluctuations in recent years due to various factors. One major concern is the environmental impact of their extraction and processing. Water contamination and habitat destruction are among the most pressing environmental issues associated with rare earth mining.

      Air contamination is also a concern, as the production of rare earth oxides releases harmful gases. Despite these challenges, the demand for rare earth metals continues to grow due to their use in clean energy technologies. Rare earth magnets are a critical component of wind turbines, which are becoming increasingly popular as a source of renewable energy. In addition, the growing market for electric vehicles is driving up the demand for rare earth metals, particularly neodymium and dysprosium, which are used in the production of batteries. The supply chain for rare earth metals is complex, with China being the largest producer and exporter of these metals.

      However, geopolitical factors, such as trade tensions and export restrictions, have disrupted the supply chain and led to price volatility. Raw material prices for rare earth metals have been on the rise due to increasing demand and supply constraints. Neodymium oxide, for instance, has seen a significant price increase in recent years, making it a costly raw material for manufacturers of rare earth magnets. The production and capacity of rare earth metals are concentrated in a few countries, with China accounting for over 80% of global production. This concentration poses a risk to the supply chain, as any disruption in China's production could have a significant impact on the global market.

      Rare earth metals are also used in various industries beyond clean energy, such as glass and ceramics, catalyst systems, and high-tech technologies. Their versatility and unique properties make them indispensable in various applications, from LED lamps to catalysts. In , the market for rare earth metals is dynamic and complex, with various factors influencing its supply and demand. Environmental concerns, geopolitical risks, and increasing demand from clean energy technologies are some of the key drivers shaping the market. Producers and consumers of rare earth metals must navigate these challenges to ensure a sustainable and reliable supply of these critical raw materials.

      Market Scope

      Report Coverage

      Details

      Page number

      231

      Base year

      2024

      Historic period

      2019-2023

      Forecast period

      2025-2029

      Growth momentum & CAGR

      Accelerate at a CAGR of 9.1%

      Market growth 2025-2029

      USD 3777.8 million

      Market structure

      Fragmented

      YoY growth 2024-2025(%)

      8.6

      Key countries

      China, Japan, US, India, South Korea, Vietnam, Germany, UK, and Canada

      Competitive landscape

      Leading Companies, Market Positioning of Companies, Competitive Strategies, and Industry Risks

      Request Free Sample

      What are the Key Data Covered in this Rare Earth Metals Market Research and Growth Report?

      • CAGR of the Rare Earth Metals industry during the forecast period
      • Detailed information on factors that will drive the growth and forecasting between 2025 and 2029
      • Precise estimation of the size of the market and its contribution of the industry in focus to the parent market
      • Accurate predictions about upcoming growth and trends and changes in consumer behaviour
      • Growth of the market across APAC, North America, Europe, Middle East and Africa, and South America
      • Thorough analysis of the market’s competitive landscape and detailed information about companies
      • Comprehensive analysis of factors that will challenge the rare earth metals market growth of industry companies

      We can help! Our analysts can customize this rare earth metals market research report to meet your requirements.

      Get in touch


      1 Executive Summary

      • 1.1 Market overview
        • Executive Summary - Chart on Market Overview
        • Executive Summary - Data Table on Market Overview
        • Executive Summary - Chart on Global Market Characteristics
        • Executive Summary - Chart on Market by Geography
        • Executive Summary - Chart on Market Segmentation by Application
        • Executive Summary - Chart on Market Segmentation by Type
        • Executive Summary - Chart on Market Segmentation by Product
        • Executive Summary - Chart on Incremental Growth
        • Executive Summary - Data Table on Incremental Growth
        • Executive Summary - Chart on Company Market Positioning

      2 Technavio Analysis

      • 2.1 Analysis of price sensitivity, lifecycle, customer purchase basket, adoption rates, and purchase criteria
        • Analysis of price sensitivity, lifecycle, customer purchase basket, adoption rates, and purchase criteria
      • 2.2 Criticality of inputs and Factors of differentiation
        • Overview on criticality of inputs and factors of differentiation
      • 2.3 Factors of disruption
        • Overview on factors of disruption
      • 2.4 Impact of drivers and challenges
        • Impact of drivers and challenges in 2024 and 2029

      3 Market Landscape

      • 3.1 Market ecosystem
        • Parent Market
        • Data Table on - Parent Market
      • 3.2 Market characteristics
        • Market characteristics analysis
      • 3.3 Value chain analysis
        • Value chain analysis

      4 Market Sizing

      • 4.1 Market definition
        • Offerings of companies included in the market definition
      • 4.2 Market segment analysis
        • Market segments
      • 4.3 Market size 2024
        • 4.4 Market outlook: Forecast for 2024-2029
          • Chart on Global - Market size and forecast 2024-2029 ($ million)
          • Data Table on Global - Market size and forecast 2024-2029 ($ million)
          • Chart on Global Market: Year-over-year growth 2024-2029 (%)
          • Data Table on Global Market: Year-over-year growth 2024-2029 (%)

        5 Historic Market Size

        • 5.1 Global Rare Earth Metals Market 2019 - 2023
          • Historic Market Size - Data Table on Global Rare Earth Metals Market 2019 - 2023 ($ million)
        • 5.2 Application segment analysis 2019 - 2023
          • Historic Market Size - Application Segment 2019 - 2023 ($ million)
        • 5.3 Type segment analysis 2019 - 2023
          • Historic Market Size - Type Segment 2019 - 2023 ($ million)
        • 5.4 Product segment analysis 2019 - 2023
          • Historic Market Size - Product Segment 2019 - 2023 ($ million)
        • 5.5 Geography segment analysis 2019 - 2023
          • Historic Market Size - Geography Segment 2019 - 2023 ($ million)
        • 5.6 Country segment analysis 2019 - 2023
          • Historic Market Size - Country Segment 2019 - 2023 ($ million)

        6 Qualitative Analysis

        • 6.1 Impact of AI in Global Rare Earth Metals Market

          7 Five Forces Analysis

          • 7.1 Five forces summary
            • Five forces analysis - Comparison between 2024 and 2029
          • 7.2 Bargaining power of buyers
            • Bargaining power of buyers - Impact of key factors 2024 and 2029
          • 7.3 Bargaining power of suppliers
            • Bargaining power of suppliers - Impact of key factors in 2024 and 2029
          • 7.4 Threat of new entrants
            • Threat of new entrants - Impact of key factors in 2024 and 2029
          • 7.5 Threat of substitutes
            • Threat of substitutes - Impact of key factors in 2024 and 2029
          • 7.6 Threat of rivalry
            • Threat of rivalry - Impact of key factors in 2024 and 2029
          • 7.7 Market condition
            • Chart on Market condition - Five forces 2024 and 2029

          8 Market Segmentation by Application

          • 8.1 Market segments
            • Chart on Application - Market share 2024-2029 (%)
            • Data Table on Application - Market share 2024-2029 (%)
          • 8.2 Comparison by Application
            • Chart on Comparison by Application
            • Data Table on Comparison by Application
          • 8.3 Permanent magnets - Market size and forecast 2024-2029
            • Chart on Permanent magnets - Market size and forecast 2024-2029 ($ million)
            • Data Table on Permanent magnets - Market size and forecast 2024-2029 ($ million)
            • Chart on Permanent magnets - Year-over-year growth 2024-2029 (%)
            • Data Table on Permanent magnets - Year-over-year growth 2024-2029 (%)
          • 8.4 Metal alloys - Market size and forecast 2024-2029
            • Chart on Metal alloys - Market size and forecast 2024-2029 ($ million)
            • Data Table on Metal alloys - Market size and forecast 2024-2029 ($ million)
            • Chart on Metal alloys - Year-over-year growth 2024-2029 (%)
            • Data Table on Metal alloys - Year-over-year growth 2024-2029 (%)
          • 8.5 Catalysts - Market size and forecast 2024-2029
            • Chart on Catalysts - Market size and forecast 2024-2029 ($ million)
            • Data Table on Catalysts - Market size and forecast 2024-2029 ($ million)
            • Chart on Catalysts - Year-over-year growth 2024-2029 (%)
            • Data Table on Catalysts - Year-over-year growth 2024-2029 (%)
          • 8.6 Polishing powder - Market size and forecast 2024-2029
            • Chart on Polishing powder - Market size and forecast 2024-2029 ($ million)
            • Data Table on Polishing powder - Market size and forecast 2024-2029 ($ million)
            • Chart on Polishing powder - Year-over-year growth 2024-2029 (%)
            • Data Table on Polishing powder - Year-over-year growth 2024-2029 (%)
          • 8.7 Others - Market size and forecast 2024-2029
            • Chart on Others - Market size and forecast 2024-2029 ($ million)
            • Data Table on Others - Market size and forecast 2024-2029 ($ million)
            • Chart on Others - Year-over-year growth 2024-2029 (%)
            • Data Table on Others - Year-over-year growth 2024-2029 (%)
          • 8.8 Market opportunity by Application
            • Market opportunity by Application ($ million)
            • Data Table on Market opportunity by Application ($ million)

          9 Market Segmentation by Type

          • 9.1 Market segments
            • Chart on Type - Market share 2024-2029 (%)
            • Data Table on Type - Market share 2024-2029 (%)
          • 9.2 Comparison by Type
            • Chart on Comparison by Type
            • Data Table on Comparison by Type
          • 9.3 Light rare earth elements - Market size and forecast 2024-2029
            • Chart on Light rare earth elements - Market size and forecast 2024-2029 ($ million)
            • Data Table on Light rare earth elements - Market size and forecast 2024-2029 ($ million)
            • Chart on Light rare earth elements - Year-over-year growth 2024-2029 (%)
            • Data Table on Light rare earth elements - Year-over-year growth 2024-2029 (%)
          • 9.4 Heavy rare earth elements - Market size and forecast 2024-2029
            • Chart on Heavy rare earth elements - Market size and forecast 2024-2029 ($ million)
            • Data Table on Heavy rare earth elements - Market size and forecast 2024-2029 ($ million)
            • Chart on Heavy rare earth elements - Year-over-year growth 2024-2029 (%)
            • Data Table on Heavy rare earth elements - Year-over-year growth 2024-2029 (%)
          • 9.5 Others - Market size and forecast 2024-2029
            • Chart on Others - Market size and forecast 2024-2029 ($ million)
            • Data Table on Others - Market size and forecast 2024-2029 ($ million)
            • Chart on Others - Year-over-year growth 2024-2029 (%)
            • Data Table on Others - Year-over-year growth 2024-2029 (%)
          • 9.6 Market opportunity by Type
            • Market opportunity by Type ($ million)
            • Data Table on Market opportunity by Type ($ million)

          10 Market Segmentation by Product

          • 10.1 Market segments
            • Chart on Product - Market share 2024-2029 (%)
            • Data Table on Product - Market share 2024-2029 (%)
          • 10.2 Comparison by Product
            • Chart on Comparison by Product
            • Data Table on Comparison by Product
          • 10.3 Cerium - Market size and forecast 2024-2029
            • Chart on Cerium - Market size and forecast 2024-2029 ($ million)
            • Data Table on Cerium - Market size and forecast 2024-2029 ($ million)
            • Chart on Cerium - Year-over-year growth 2024-2029 (%)
            • Data Table on Cerium - Year-over-year growth 2024-2029 (%)
          • 10.4 Dysprosium - Market size and forecast 2024-2029
            • Chart on Dysprosium - Market size and forecast 2024-2029 ($ million)
            • Data Table on Dysprosium - Market size and forecast 2024-2029 ($ million)
            • Chart on Dysprosium - Year-over-year growth 2024-2029 (%)
            • Data Table on Dysprosium - Year-over-year growth 2024-2029 (%)
          • 10.5 Erbium - Market size and forecast 2024-2029
            • Chart on Erbium - Market size and forecast 2024-2029 ($ million)
            • Data Table on Erbium - Market size and forecast 2024-2029 ($ million)
            • Chart on Erbium - Year-over-year growth 2024-2029 (%)
            • Data Table on Erbium - Year-over-year growth 2024-2029 (%)
          • 10.6 Others - Market size and forecast 2024-2029
            • Chart on Others - Market size and forecast 2024-2029 ($ million)
            • Data Table on Others - Market size and forecast 2024-2029 ($ million)
            • Chart on Others - Year-over-year growth 2024-2029 (%)
            • Data Table on Others - Year-over-year growth 2024-2029 (%)
          • 10.7 Market opportunity by Product
            • Market opportunity by Product ($ million)
            • Data Table on Market opportunity by Product ($ million)

          11 Customer Landscape

          • 11.1 Customer landscape overview
            • Analysis of price sensitivity, lifecycle, customer purchase basket, adoption rates, and purchase criteria

          12 Geographic Landscape

          • 12.1 Geographic segmentation
            • Chart on Market share by geography 2024-2029 (%)
            • Data Table on Market share by geography 2024-2029 (%)
          • 12.2 Geographic comparison
            • Chart on Geographic comparison
            • Data Table on Geographic comparison
          • 12.3 APAC - Market size and forecast 2024-2029
            • Chart on APAC - Market size and forecast 2024-2029 ($ million)
            • Data Table on APAC - Market size and forecast 2024-2029 ($ million)
            • Chart on APAC - Year-over-year growth 2024-2029 (%)
            • Data Table on APAC - Year-over-year growth 2024-2029 (%)
          • 12.4 North America - Market size and forecast 2024-2029
            • Chart on North America - Market size and forecast 2024-2029 ($ million)
            • Data Table on North America - Market size and forecast 2024-2029 ($ million)
            • Chart on North America - Year-over-year growth 2024-2029 (%)
            • Data Table on North America - Year-over-year growth 2024-2029 (%)
          • 12.5 Europe - Market size and forecast 2024-2029
            • Chart on Europe - Market size and forecast 2024-2029 ($ million)
            • Data Table on Europe - Market size and forecast 2024-2029 ($ million)
            • Chart on Europe - Year-over-year growth 2024-2029 (%)
            • Data Table on Europe - Year-over-year growth 2024-2029 (%)
          • 12.6 Middle East and Africa - Market size and forecast 2024-2029
            • Chart on Middle East and Africa - Market size and forecast 2024-2029 ($ million)
            • Data Table on Middle East and Africa - Market size and forecast 2024-2029 ($ million)
            • Chart on Middle East and Africa - Year-over-year growth 2024-2029 (%)
            • Data Table on Middle East and Africa - Year-over-year growth 2024-2029 (%)
          • 12.7 South America - Market size and forecast 2024-2029
            • Chart on South America - Market size and forecast 2024-2029 ($ million)
            • Data Table on South America - Market size and forecast 2024-2029 ($ million)
            • Chart on South America - Year-over-year growth 2024-2029 (%)
            • Data Table on South America - Year-over-year growth 2024-2029 (%)
          • 12.8 China - Market size and forecast 2024-2029
            • Chart on China - Market size and forecast 2024-2029 ($ million)
            • Data Table on China - Market size and forecast 2024-2029 ($ million)
            • Chart on China - Year-over-year growth 2024-2029 (%)
            • Data Table on China - Year-over-year growth 2024-2029 (%)
          • 12.9 Japan - Market size and forecast 2024-2029
            • Chart on Japan - Market size and forecast 2024-2029 ($ million)
            • Data Table on Japan - Market size and forecast 2024-2029 ($ million)
            • Chart on Japan - Year-over-year growth 2024-2029 (%)
            • Data Table on Japan - Year-over-year growth 2024-2029 (%)
          • 12.10 US - Market size and forecast 2024-2029
            • Chart on US - Market size and forecast 2024-2029 ($ million)
            • Data Table on US - Market size and forecast 2024-2029 ($ million)
            • Chart on US - Year-over-year growth 2024-2029 (%)
            • Data Table on US - Year-over-year growth 2024-2029 (%)
          • 12.11 India - Market size and forecast 2024-2029
            • Chart on India - Market size and forecast 2024-2029 ($ million)
            • Data Table on India - Market size and forecast 2024-2029 ($ million)
            • Chart on India - Year-over-year growth 2024-2029 (%)
            • Data Table on India - Year-over-year growth 2024-2029 (%)
          • 12.12 South Korea - Market size and forecast 2024-2029
            • Chart on South Korea - Market size and forecast 2024-2029 ($ million)
            • Data Table on South Korea - Market size and forecast 2024-2029 ($ million)
            • Chart on South Korea - Year-over-year growth 2024-2029 (%)
            • Data Table on South Korea - Year-over-year growth 2024-2029 (%)
          • 12.13 Vietnam - Market size and forecast 2024-2029
            • Chart on Vietnam - Market size and forecast 2024-2029 ($ million)
            • Data Table on Vietnam - Market size and forecast 2024-2029 ($ million)
            • Chart on Vietnam - Year-over-year growth 2024-2029 (%)
            • Data Table on Vietnam - Year-over-year growth 2024-2029 (%)
          • 12.14 Germany - Market size and forecast 2024-2029
            • Chart on Germany - Market size and forecast 2024-2029 ($ million)
            • Data Table on Germany - Market size and forecast 2024-2029 ($ million)
            • Chart on Germany - Year-over-year growth 2024-2029 (%)
            • Data Table on Germany - Year-over-year growth 2024-2029 (%)
          • 12.15 UK - Market size and forecast 2024-2029
            • Chart on UK - Market size and forecast 2024-2029 ($ million)
            • Data Table on UK - Market size and forecast 2024-2029 ($ million)
            • Chart on UK - Year-over-year growth 2024-2029 (%)
            • Data Table on UK - Year-over-year growth 2024-2029 (%)
          • 12.16 Canada - Market size and forecast 2024-2029
            • Chart on Canada - Market size and forecast 2024-2029 ($ million)
            • Data Table on Canada - Market size and forecast 2024-2029 ($ million)
            • Chart on Canada - Year-over-year growth 2024-2029 (%)
            • Data Table on Canada - Year-over-year growth 2024-2029 (%)
          • 12.17 Market opportunity by geography
            • Market opportunity by geography ($ million)
            • Data Tables on Market opportunity by geography ($ million)

          13 Drivers, Challenges, and Opportunity/Restraints

          • 13.1 Market drivers
            • 13.2 Market challenges
              • 13.3 Impact of drivers and challenges
                • Impact of drivers and challenges in 2024 and 2029
              • 13.4 Market opportunities/restraints

                14 Competitive Landscape

                • 14.1 Overview
                  • 14.2 Competitive Landscape
                    • Overview on criticality of inputs and factors of differentiation
                  • 14.3 Landscape disruption
                    • Overview on factors of disruption
                  • 14.4 Industry risks
                    • Impact of key risks on business

                  15 Competitive Analysis

                  • 15.1 Companies profiled
                    • Companies covered
                  • 15.2 Company ranking index
                    • Company ranking index
                  • 15.3 Market positioning of companies
                    • Matrix on companies position and classification
                  • 15.4 Alkane Resources Ltd.
                    • Alkane Resources Ltd. - Overview
                    • Alkane Resources Ltd. - Product / Service
                    • Alkane Resources Ltd. - Key offerings
                    • SWOT
                  • 15.5 Arafura Rare Earths Ltd.
                    • Arafura Rare Earths Ltd. - Overview
                    • Arafura Rare Earths Ltd. - Product / Service
                    • Arafura Rare Earths Ltd. - Key offerings
                    • SWOT
                  • 15.6 Avalon Advanced Materials Inc.
                    • Avalon Advanced Materials Inc. - Overview
                    • Avalon Advanced Materials Inc. - Product / Service
                    • Avalon Advanced Materials Inc. - Key news
                    • Avalon Advanced Materials Inc. - Key offerings
                    • SWOT
                  • 15.7 Canada Rare Earth Corp.
                    • Canada Rare Earth Corp. - Overview
                    • Canada Rare Earth Corp. - Product / Service
                    • Canada Rare Earth Corp. - Key offerings
                    • SWOT
                  • 15.8 Energy Transition Minerals Ltd.
                    • Energy Transition Minerals Ltd. - Overview
                    • Energy Transition Minerals Ltd. - Product / Service
                    • Energy Transition Minerals Ltd. - Key offerings
                    • SWOT
                  • 15.9 Frontier Rare Earths Ltd.
                    • Frontier Rare Earths Ltd. - Overview
                    • Frontier Rare Earths Ltd. - Product / Service
                    • Frontier Rare Earths Ltd. - Key offerings
                    • SWOT
                  • 15.10 HEFA Rare Earth Canada Co. Ltd.
                    • HEFA Rare Earth Canada Co. Ltd. - Overview
                    • HEFA Rare Earth Canada Co. Ltd. - Product / Service
                    • HEFA Rare Earth Canada Co. Ltd. - Key offerings
                    • SWOT
                  • 15.11 Hitachi Ltd.
                    • Hitachi Ltd. - Overview
                    • Hitachi Ltd. - Business segments
                    • Hitachi Ltd. - Key news
                    • Hitachi Ltd. - Key offerings
                    • Hitachi Ltd. - Segment focus
                    • SWOT
                  • 15.12 Iluka Resources Ltd.
                    • Iluka Resources Ltd. - Overview
                    • Iluka Resources Ltd. - Business segments
                    • Iluka Resources Ltd. - Key offerings
                    • Iluka Resources Ltd. - Segment focus
                    • SWOT
                  • 15.13 IREL India Ltd.
                    • IREL India Ltd. - Overview
                    • IREL India Ltd. - Product / Service
                    • IREL India Ltd. - Key offerings
                    • SWOT
                  • 15.14 Lynas Rare Earths Ltd.
                    • Lynas Rare Earths Ltd. - Overview
                    • Lynas Rare Earths Ltd. - Product / Service
                    • Lynas Rare Earths Ltd. - Key offerings
                    • SWOT
                  • 15.15 Neo Performance Materials Inc.
                    • Neo Performance Materials Inc. - Overview
                    • Neo Performance Materials Inc. - Business segments
                    • Neo Performance Materials Inc. - Key offerings
                    • Neo Performance Materials Inc. - Segment focus
                    • SWOT
                  • 15.16 Northern Minerals Ltd.
                    • Northern Minerals Ltd. - Overview
                    • Northern Minerals Ltd. - Product / Service
                    • Northern Minerals Ltd. - Key offerings
                    • SWOT
                  • 15.17 Shin Etsu Chemical Co. Ltd.
                    • Shin Etsu Chemical Co. Ltd. - Overview
                    • Shin Etsu Chemical Co. Ltd. - Business segments
                    • Shin Etsu Chemical Co. Ltd. - Key offerings
                    • Shin Etsu Chemical Co. Ltd. - Segment focus
                    • SWOT
                  • 15.18 Resonac Holdings Corp.
                    • Resonac Holdings Corp. - Overview
                    • Resonac Holdings Corp. - Business segments
                    • Resonac Holdings Corp. - Key news
                    • Resonac Holdings Corp. - Key offerings
                    • Resonac Holdings Corp. - Segment focus
                    • SWOT

                  16 Appendix

                  • 16.1 Scope of the report
                    • 16.2 Inclusions and exclusions checklist
                      • Inclusions checklist
                      • Exclusions checklist
                    • 16.3 Currency conversion rates for US$
                      • Currency conversion rates for US$
                    • 16.4 Research methodology
                      • Research methodology
                    • 16.5 Data procurement
                      • Information sources
                    • 16.6 Data validation
                      • Data validation
                    • 16.7 Validation techniques employed for market sizing
                      • Validation techniques employed for market sizing
                    • 16.8 Data synthesis
                      • Data synthesis
                    • 16.9 360 degree market analysis
                      • 360 degree market analysis
                    • 16.10 List of abbreviations
                      • List of abbreviations

                    Research Methodology

                    Technavio presents a detailed picture of the market by way of study, synthesis, and summation of data from multiple sources. The analysts have presented the various facets of the market with a particular focus on identifying the key industry influencers. The data thus presented is comprehensive, reliable, and the result of extensive research, both primary and secondary.

                    INFORMATION SOURCES

                    Primary sources

                    • Manufacturers and suppliers
                    • Channel partners
                    • Industry experts
                    • Strategic decision makers

                    Secondary sources

                    • Industry journals and periodicals
                    • Government data
                    • Financial reports of key industry players
                    • Historical data
                    • Press releases

                    DATA ANALYSIS

                    Data Synthesis

                    • Collation of data
                    • Estimation of key figures
                    • Analysis of derived insights

                    Data Validation

                    • Triangulation with data models
                    • Reference against proprietary databases
                    • Corroboration with industry experts

                    REPORT WRITING

                    Qualitative

                    • Market drivers
                    • Market challenges
                    • Market trends
                    • Five forces analysis

                    Quantitative

                    • Market size and forecast
                    • Market segmentation
                    • Geographical insights
                    • Competitive landscape

                    Interested in this report?

                    Get your sample now to see our research methodology and insights!

                    Download Now

                    Frequently Asked Questions

                    Rare Earth Metals market growth will increase by $ 3777.8 mn during 2025-2029.

                    The Rare Earth Metals market is expected to grow at a CAGR of 9.1% during 2025-2029.

                    Rare Earth Metals market is segmented by Application( Permanent magnets, Metal alloys, Catalysts, Polishing powder, Others) Type( Light rare earth elements, Heavy rare earth elements, Others, polishing powder, others) Product( Cerium, Dysprosium, Erbium, Others, South America)

                    Alkane Resources Ltd., Arafura Rare Earths Ltd., Arnold Magnetic Technologies Corp., Avalon Advanced Materials Inc., Canada Rare Earth Corp., Energy Transition Minerals Ltd., Frontier Rare Earths Ltd., HEFA Rare Earth Canada Co. Ltd., Hitachi Ltd., Iluka Resources Ltd., IREL India Ltd., Lynas Rare Earths Ltd., Montero Mining and Exploration Ltd., Namibia Critical Metals Inc., Neo Performance Materials Inc., Northern Minerals Ltd., Rare Element Resources Ltd., Shin Etsu Chemical Co. Ltd., Resonac Holdings Corp. are a few of the key vendors in the Rare Earth Metals market.

                    APAC will register the highest growth rate of 74% among the other regions. Therefore, the Rare Earth Metals market in APAC is expected to garner significant business opportunities for the vendors during the forecast period.

                    China, Japan, US, India, South Korea, Vietnam, Germany, UK, Canada

                    • Growing demand for electronic appliances and personal equipmentRare earth compounds of yttrium is the driving factor this market.
                    • terbium is the driving factor this market.
                    • cerium is the driving factor this market.
                    • and gadolinium are used as phosphors in various electronic appliances such as liquid crystal displays (LCDs) and smartphones. These rare earth metal compounds exhibit electro phosphorescence is the driving factor this market.
                    • wherein an electric discharge in the compound results in color variations. In addition is the driving factor this market.
                    • these elements are also used in energy-efficient lighting and magnetic refrigeration. However is the driving factor this market.
                    • the latter still needs to make inroads into the consumer segment. Magnetic refrigeration is now predominantly being used for industrial purposes.A rise in disposable incomes is the driving factor this market.
                    • technology breakthroughs is the driving factor this market.
                    • and falling microprocessor prices are propelling the demand for personal gadgets such as laptops is the driving factor this market.
                    • mobile phones is the driving factor this market.
                    • and tablets across the world. Rapidly expanding mobile networks and internet penetration in India is the driving factor this market.
                    • Bangladesh is the driving factor this market.
                    • Indonesia is the driving factor this market.
                    • Thailand is the driving factor this market.
                    • and other countries in Southeast Asia are aiding the demand for mobile gadgets and personal equipment. There is a significant untapped market in these regions is the driving factor this market.
                    • which presents an immense growth opportunity for the sale of personal equipment. This is expected to pose a demand for rare earth phosphors for use in their manufacture is the driving factor this market.
                    • which would influence the market during the forecast period. is the driving factor this market.

                    The Rare Earth Metals market vendors should focus on grabbing business opportunities from the Permanent magnets segment as it accounted for the largest market share in the base year.
                    RIA - Research AI Assistant
                    Ask RIA