Rare Hematology Market Analysis North America, Europe, Asia, Rest of World (ROW) - US, China, UK, Germany, Japan, India, France, Italy, South Korea, Singapore - Size and Forecast 2024-2028

Rare Hematology Market Analysis North America, Europe, Asia, Rest of World (ROW) - US, China, UK, Germany, Japan, India, France, Italy, South Korea, Singapore - Size and Forecast 2024-2028

Published: Oct 2024 210 Pages SKU: IRTNTR80228

Market Overview at a Glance

$4.59 B
Market Opportunity
5.7%
CAGR
5.1
YoY growth 2023-2024(%)

Rare Hematology Market Size 2024-2028 

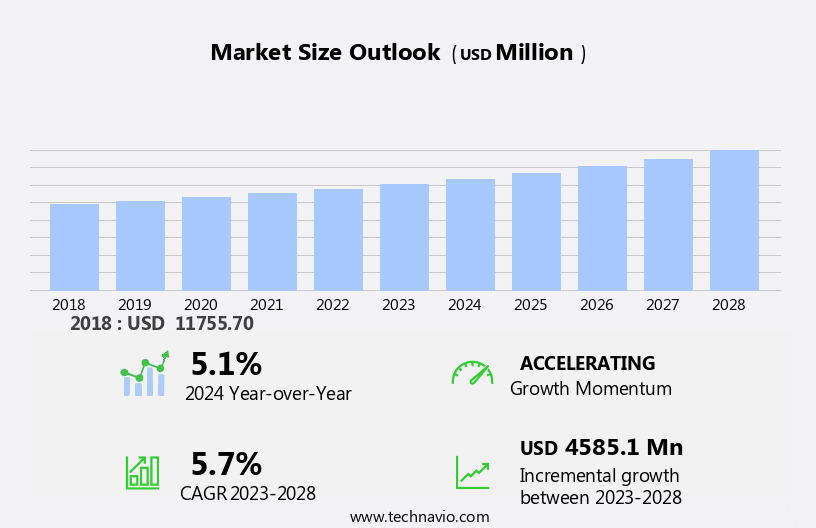
The rare hematology market size is forecast to increase by USD 4.59 billion at a CAGR of 5.7% between 2023 and 2028. In the realm of rare hematology, patient-centric approaches continue to dominate the landscape, with a focus on addressing the unique needs of individuals afflicted by hematologic diseases and plasma disorders. The increasing prevalence of blood diseases such as Anemia, Myeloma, Leukemia, and Sickle cell anemia necessitates the development of innovative treatments.  Therapeutic avenues for conditions such as hemophilia are expanding, driven by the approval of innovative treatments by regulatory bodies like the FDA. However, the high costs associated with these advanced therapies pose a significant challenge. The healthcare infrastructure must adapt to accommodate the complexities of treating these conditions, ensuring efficient clinical trial processes and optimizing blood clotting treatments for optimal patient outcomes. This dynamic market requires ongoing analysis to stay abreast of emerging trends and address the evolving needs of patients and healthcare providers.

What will be the Size of the Market During the Forecast Period?

Rare Hematology Market Size

 Request Free Sample

The field of hematology encompasses the study of various blood disorders and their underlying causes. These conditions, including anemia, myeloma, leukemia, sickle cell anemia, and plasma disorders, can significantly impact patients' quality of life. The diagnostic process and subsequent treatment plans for these rare hematologic diseases require specialized knowledge and expertise from healthcare professionals, particularly hematologists. Diagnostic techniques are crucial in identifying the root cause of hematologic diseases. Traditional methods, such as complete blood count (CBC) and bone marrow aspiration, have been the cornerstone of diagnosis for decades.

However, advancements in genetic testing technologies have enabled the identification of genetic mutations associated with these disorders, leading to earlier and more accurate diagnoses. Genetic testing is a vital component of personalized medicine, as it allows for the development of targeted therapies tailored to individual patients. Gene and innovative therapies offer hope for effective and affordable treatments for rare hematologic diseases. Orphan drug designation, a special status granted by regulatory agencies for drugs intended to treat rare diseases, has accelerated the development and approval of these therapies. Clinical trial data plays a significant role in advancing our understanding of these complex diseases and their treatments.

Furthermore, pharmaceutical companies invest heavily in research and development to bring new, effective treatments to market. The focus on patient-centric approaches and therapeutic avenues ensures that patients receive the best possible care while contributing to the advancement of medical knowledge. Early intervention is essential in managing hematologic diseases, as timely diagnosis and treatment can significantly improve patient outcomes. The diagnostic capabilities of hematologists are crucial in identifying these conditions, enabling prompt intervention and personalized treatment plans. Targeted therapies, such as monoclonal antibodies and small molecule inhibitors, have revolutionized the treatment landscape for various hematologic diseases. These therapies, often administered in the form of infusions or oral medications, offer targeted interventions with minimal side effects compared to traditional chemotherapy.

Market Segmentation

The market research report provides comprehensive data (region-wise segment analysis), with forecasts and estimates in "USD billion" for the period 2024-2028, as well as historical data from 2018-2022 for the following segments.
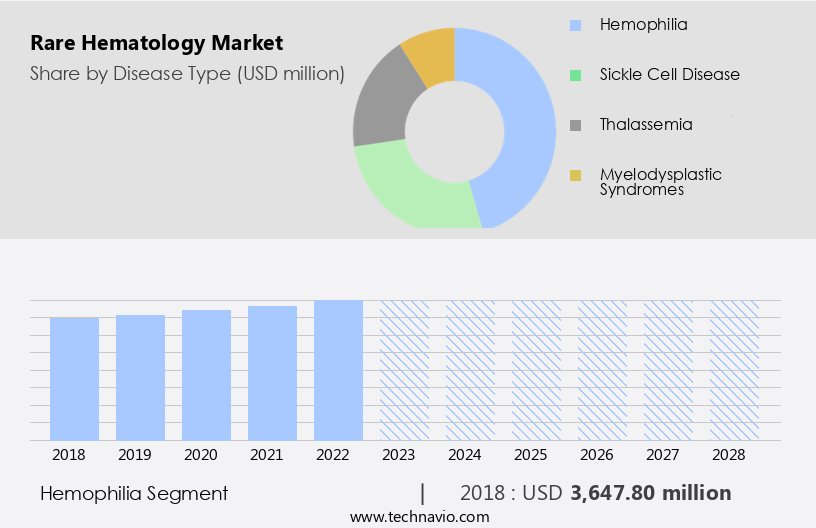
  • Disease Type
    • Hemophilia
    • Sickle cell disease
    • Thalassemia
    • Myelodysplastic syndromes
  • End-user
    • Hospitals
    • Specialty clinics
    • Research institutes
    • Pharmaceutical companies
  • Geography
    • North America
      • US
    • Europe
      • Germany
      • UK
      • France
      • Italy
    • Asia
      • China
      • India
      • Japan
      • South Korea
      • Singapore
    • Rest of World (ROW)

By Disease Type Insights

The hemophilia segment is estimated to witness significant growth during the forecast period. The market, specifically concerning hemophilia, is experiencing substantial progress and innovation. Hemophilia, an inherited condition that results in a deficiency of clotting factors, predominantly impacts males and is classified into hemophilia A (factor VIII deficiency) and hemophilia B (factor IX deficiency).  A significant hurdle in managing hemophilia is the emergence of inhibitors to factor VIII and factor IX, which affects approximately 25% to 30% of hemophilia A patients and 3% to 5% of hemophilia B patients. These inhibitors make conventional factor replacement therapies ineffective. Healthcare Solutions for various blood diseases, including anemia, myeloma, leukemia, and sickle cell anemia, are undergoing transformative changes to address the unique challenges posed by rare hematological conditions.

Furthermore, hematologists are at the forefront of these advancements, utilizing the latest detection processes to diagnose and treat these complex diseases. The global market for these solutions is expected to grow significantly in the coming years, offering promising opportunities for stakeholders.

Rare Hematology Market Size

Get a glance at the market share of various segments Request Free Sample

The hemophilia segment accounted for USD 3.65 billion in 2018 and showed a gradual increase during the forecast period.

Regional Insights

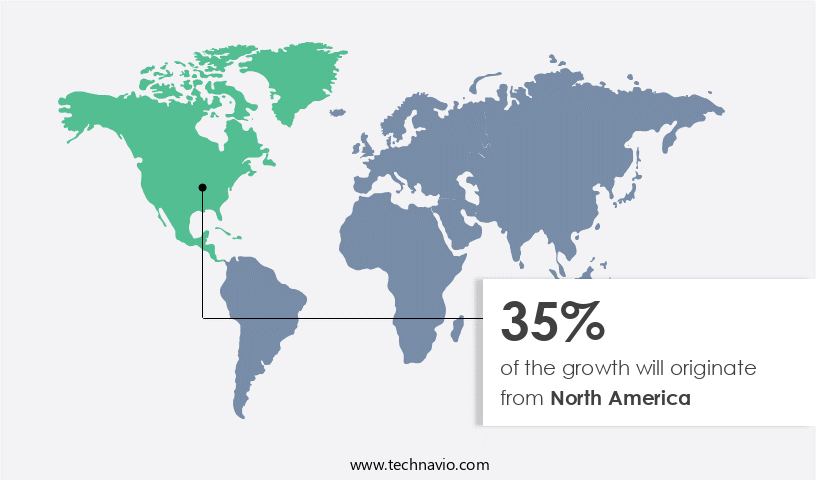
North America is estimated to contribute 35% to the growth of the global market during the forecast period. Technavio's analysts have elaborately explained the regional trends and drivers that shape the market during the forecast period.

Rare Hematology Market Share by Geography

For more insights on the market share of various regions Request Free Sample

In North America, the market holds a significant role due to advanced healthcare facilities, intensive research and development activities, and strong regulatory support. For instance, the Texas Children's Cancer and Hematology Center in the United States is renowned for its expertise in diagnosing and treating pediatric sarcomas, which are among the rarest and most intricate cancer in children. This center attracts referrals from pediatricians due to its extensive experience and multidisciplinary team, consisting of specialists in oncology, surgery, diagnostic imaging, and molecular pathology. This team not only focuses on the medical aspects of rare hematological disorders but also addresses the psychosocial and emotional needs of each child and their family, ensuring holistic care.

Furthermore, diagnostic techniques in rare hematology include genetic testing, which plays a crucial role in identifying the root cause of various blood disorders. Moreover, personalized medicine and gene therapies, which have received orphan drug Designation, are transforming the treatment landscape for rare hematological conditions.

Our researchers analyzed the data with 2023 as the base year, along with the key drivers, trends, and challenges. A holistic analysis of drivers will help companies refine their marketing strategies to gain a competitive advantage.

Market Driver

Enhancement of strategic portfolios is the key driver of the market. The market experiences continuous growth as pharmaceutical companies invest in developing effective treatments for various diseases, including sickle cell disease. Innovative approaches such as gene editing and targeted therapies utilizing novel drugs and biotechnologies are at the forefront of this advancement.

Furthermore, the orphan drug designation of these products enables companies to focus on developing treatments for rare diseases with limited therapeutic options, making a substantial impact on patient care. The market is further driven by the increasing demand for personalized medicine and the development of advanced diagnostic techniques and treatments. This strategic focus on rare hematology not only addresses unmet medical needs but also drives growth for pharmaceutical companies.

Market Trends

Approvals from Food and Drug Administration (FDA) is the upcoming trend in the market. The market in the United States is driven by the FDA's approval of innovative therapies for various hematologic diseases and plasma disorders, particularly hemophilia. The expedited approval underscores the urgency to bring advanced treatments to patients with rare blood disorders.

Furthermore, diagnostic techniques, including genetic testing, play a vital role in identifying these disorders and guiding personalized medicine approaches. Furthermore, the development of gene therapies and orphan drug designations continues to fuel market growth in the rare hematology sector. Thus, such trends will shape the growth of the market during the forecast period.

Market Challenge

High treatment costs is a key challenge affecting the market growth. The market faces a substantial hurdle in the form of high treatment costs, especially with the emergence of advanced cell and gene therapies. These innovative therapies present curative solutions for various rare blood disorders but come with substantial price tags. For instance, Libmeldy, a recently FDA-approved gene therapy, has a wholesale acquisition cost of USD 4.25 million, making it one of the most expensive drugs worldwide. Other pricey therapies include Hemgenix at USD3.5 million, Zynteglo at USD2.8 million, and Skysona at USD3 million per dose. The lifetime cost for Vyjuvek, a topical gene therapy for dystrophic epidermolysis bullosa, may range between USD 15 million and USD 22 million per patient.

Furthermore, genetic testing technologies play a crucial role in the early identification and intervention of hereditary cancers and rare hematological disorders. Personalized treatment plans based on genetic testing solutions can significantly improve patient outcomes. The diagnostic capabilities of these tests enable the identification of specific genetic mutations, paving the way for targeted therapies. As the demand for early intervention and personalized treatment grows, the market for genetic testing solutions in rare hematology is expected to expand.

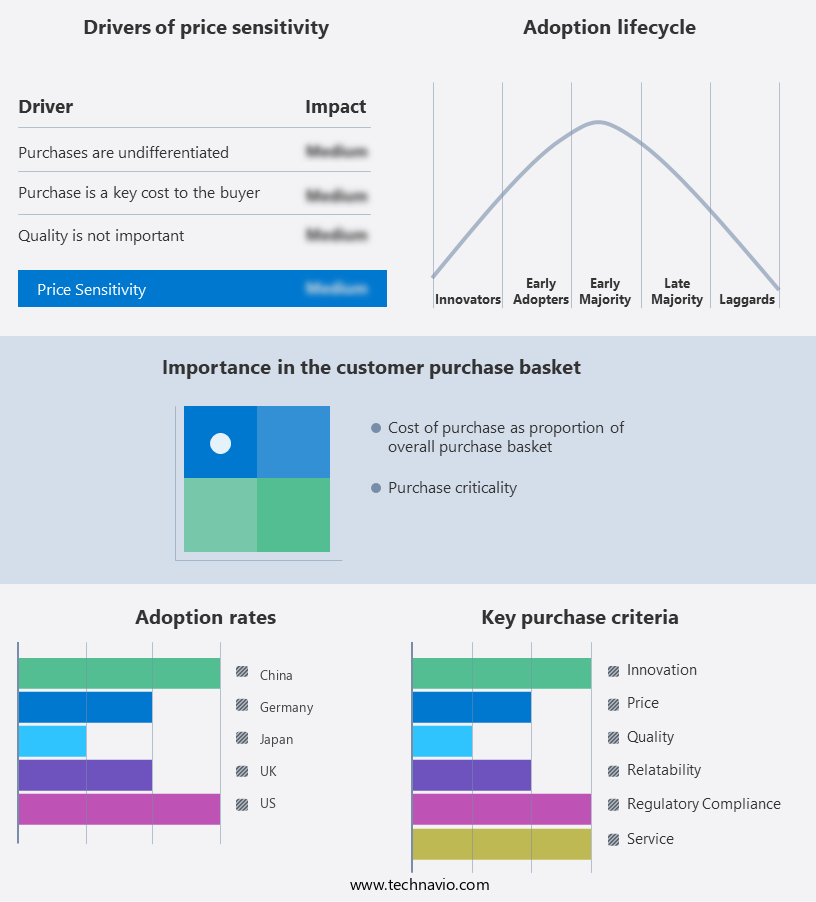
Exclusive Customer Landscape

The market forecasting report includes the adoption lifecycle of the market, covering from the innovator's stage to the laggard's stage. It focuses on adoption rates in different regions based on penetration. Furthermore, the report also includes key purchase criteria and drivers of price sensitivity to help companies evaluate and develop their market growth analysis strategies.

Rare Hematology Market Share by Geography

 Customer Landscape

Key Companies & Market Insights

Companies are implementing various strategies, such as strategic alliances, partnerships, mergers and acquisitions, geographical expansion, and product/service launches, to enhance their presence in the market.

AbbVie Inc. - The company focuses on researching medicines for blood cancer and solid malignancies.

The market research and growth report includes detailed analyses of the competitive landscape of the market and information about key companies, including:

  • AbbVie Inc.
  • AstraZeneca Plc
  • Bayer AG
  • Biogen Inc.
  • bluebird bio Inc.
  • Bristol Myers Squibb Co.
  • CSL Ltd.
  • Emmaus Medical Inc.
  • F. Hoffmann La Roche Ltd.
  • GlaxoSmithKline Plc
  • Grifols SA
  • Jazz Pharmaceuticals Plc
  • Johnson and Johnson Services Inc.
  • Merck and Co. Inc.
  • Novartis AG
  • Novo Nordisk AS
  • Octapharma AG
  • Pfizer Inc.
  • Sanofi SA
  • Takeda Pharmaceutical Co. Ltd.

Qualitative and quantitative analysis of companies has been conducted to help clients understand the wider business environment as well as the strengths and weaknesses of key market players. Data is qualitatively analyzed to categorize companies as pure play, category-focused, industry-focused, and diversified; it is quantitatively analyzed to categorize companies as dominant, leading, strong, tentative, and weak.

Research Analyst Overview

Rare hematology refers to the branch of medicine that deals with the diagnosis and treatment of various uncommon blood disorders. These conditions, which include sickle cell disease, hemophilia, myeloma, leukemia, anemia, and other hematologic diseases, can significantly impact patients' quality of life and, in some cases, be life-threatening. Hematologists rely on their diagnostic skills to navigate the intricacies of the medical diagnosis process and provide patient-centric approaches to treatment. Diagnostic techniques in rare hematology rely on genetic testing and molecular biology to identify the underlying causes of these disorders. Effective treatments for rare hematology conditions are essential, with a focus on affordable and personalized medicine. Gene therapies, targeted therapies, and novel drugs are some of the innovative therapeutic avenues being explored.

Furthermore, orphan drug designation provides incentives for pharmaceutical companies to develop treatments for rare diseases. Genetic testing technologies play a crucial role in early intervention and personalized treatment. These solutions enable healthcare providers to detect and diagnose rare hematologic diseases at an early stage, leading to better patient outcomes. Hematologists employ advanced diagnostic capabilities to navigate the complexities of the diagnosis process and provide patient-centric approaches. Biotechnologies, such as gene editing, are revolutionizing the field of rare hematology, offering curative treatments for previously untreatable conditions. Clinical trials are ongoing to evaluate the safety and efficacy of these therapies. The healthcare infrastructure must adapt to accommodate the unique needs of patients with rare hematologic diseases, providing comprehensive healthcare solutions. Blood clotting disorders, such as hemophilia A and B, are a significant focus in rare hematology. Patient management and treatment processes are continually evolving to improve outcomes and ensure the best possible care for those affected by these conditions.

Market Scope

Report Coverage

Details

Page number

210

Base year

2023

Historic period

2018-2022

Forecast period

2024-2028

Growth momentum & CAGR

Accelerate at a CAGR of 5.7%

Market Growth 2024-2028

USD 4.59 billion

Market structure

Fragmented

YoY growth 2023-2024(%)

5.1

Regional analysis

North America, Europe, Asia, and Rest of World (ROW)

Performing market contribution

North America at 35%

Key countries

US, China, UK, Germany, Japan, India, France, Italy, South Korea, and Singapore

Competitive landscape

Leading Companies, Market Positioning of Companies, Competitive Strategies, and Industry Risks

Key companies profiled

AbbVie Inc., AstraZeneca Plc, Bayer AG, Biogen Inc., bluebird bio Inc., Bristol Myers Squibb Co., CSL Ltd., Emmaus Medical Inc., F. Hoffmann La Roche Ltd., GlaxoSmithKline Plc, Grifols SA, Jazz Pharmaceuticals Plc, Johnson and Johnson Services Inc., Merck and Co. Inc., Novartis AG, Novo Nordisk AS, Octapharma AG, Pfizer Inc., Sanofi SA, and Takeda Pharmaceutical Co. Ltd.

Market dynamics

Parent market analysis, market growth inducers and obstacles, market forecast, fast-growing and slow-growing segment analysis, COVID-19 impact and recovery analysis and future consumer dynamics, market condition analysis for the forecast period

Customization purview

If our market report has not included the data that you are looking for, you can reach out to our analysts and get segments customized.

Request Free Sample

What are the Key Data Covered in this Market Research and Growth Report?

  • CAGR of the market during the forecast period
  • Detailed information on factors that will drive the market growth and forecasting between 2024 and 2028
  • Precise estimation of the size of the market  and its contribution of the market in focus to the parent market
  • Accurate predictions about upcoming market growth and trends and changes in consumer behaviour
  • Growth of the market across North America, Europe, Asia, and Rest of World (ROW)
  • Thorough analysis of the market's competitive landscape and detailed information about companies
  • Comprehensive analysis of factors that will challenge the growth of market companies

We can help! Our analysts can customize this market research report to meet your requirements. Get in touch

1 Executive Summary

  • 1.1 Market overview
    • Executive Summary - Chart on Market Overview
    • Executive Summary - Data Table on Market Overview
    • Executive Summary - Chart on Global Market Characteristics
    • Executive Summary - Chart on Market by Geography
    • Executive Summary - Chart on Market Segmentation by Disease Type
    • Executive Summary - Chart on Market Segmentation by End-user
    • Executive Summary - Chart on Incremental Growth
    • Executive Summary - Data Table on Incremental Growth
    • Executive Summary - Chart on Company Market Positioning

2 Technavio Analysis

  • 2.1 Analysis of price sensitivity, lifecycle, customer purchase basket, adoption rates, and purchase criteria
    • Analysis of price sensitivity, lifecycle, customer purchase basket, adoption rates, and purchase criteria
  • 2.2 Criticality of inputs and Factors of differentiation
    • Overview on criticality of inputs and factors of differentiation
  • 2.3 Factors of disruption
    • Overview on factors of disruption
  • 2.4 Impact of drivers and challenges
    • Impact of drivers and challenges in 2023 and 2028

3 Market Landscape

  • 3.1 Market ecosystem
    • Parent Market
    • Data Table on - Parent Market
  • 3.2 Market characteristics
    • Market characteristics analysis
  • 3.3 Value chain analysis
    • Value Chain Analysis

4 Market Sizing

  • 4.1 Market definition
    • Offerings of companies included in the market definition
  • 4.2 Market segment analysis
    • Market segments
  • 4.3 Market size 2023
    • 4.4 Market outlook: Forecast for 2023-2028
      • Chart on Global - Market size and forecast 2023-2028 ($ million)
      • Data Table on Global - Market size and forecast 2023-2028 ($ million)
      • Chart on Global Market: Year-over-year growth 2023-2028 (%)
      • Data Table on Global Market: Year-over-year growth 2023-2028 (%)

    5 Historic Market Size

    • 5.1 Global Rare Hematology Market 2018 - 2022
      • Historic Market Size - Data Table on Global Rare Hematology Market 2018 - 2022 ($ million)
    • 5.2 Disease Type segment analysis 2018 - 2022
      • Historic Market Size - Disease Type Segment 2018 - 2022 ($ million)
    • 5.3 End-user segment analysis 2018 - 2022
      • Historic Market Size - End-user Segment 2018 - 2022 ($ million)
    • 5.4 Geography segment analysis 2018 - 2022
      • Historic Market Size - Geography Segment 2018 - 2022 ($ million)
    • 5.5 Country segment analysis 2018 - 2022
      • Historic Market Size - Country Segment 2018 - 2022 ($ million)

    6 Qualitative Analysis

    • 6.1 Impact of Artificial Intelligence (AI) in the global rare hematology market

      7 Five Forces Analysis

      • 7.1 Five forces summary
        • Five forces analysis - Comparison between 2023 and 2028
      • 7.2 Bargaining power of buyers
        • Bargaining power of buyers - Impact of key factors 2023 and 2028
      • 7.3 Bargaining power of suppliers
        • Bargaining power of suppliers - Impact of key factors in 2023 and 2028
      • 7.4 Threat of new entrants
        • Threat of new entrants - Impact of key factors in 2023 and 2028
      • 7.5 Threat of substitutes
        • Threat of substitutes - Impact of key factors in 2023 and 2028
      • 7.6 Threat of rivalry
        • Threat of rivalry - Impact of key factors in 2023 and 2028
      • 7.7 Market condition
        • Chart on Market condition - Five forces 2023 and 2028

      8 Market Segmentation by Disease Type

      • 8.1 Market segments
        • Chart on Disease Type - Market share 2023-2028 (%)
        • Data Table on Disease Type - Market share 2023-2028 (%)
      • 8.2 Comparison by Disease Type
        • Chart on Comparison by Disease Type
        • Data Table on Comparison by Disease Type
      • 8.3 Hemophilia - Market size and forecast 2023-2028
        • Chart on Hemophilia - Market size and forecast 2023-2028 ($ million)
        • Data Table on Hemophilia - Market size and forecast 2023-2028 ($ million)
        • Chart on Hemophilia - Year-over-year growth 2023-2028 (%)
        • Data Table on Hemophilia - Year-over-year growth 2023-2028 (%)
      • 8.4 Sickle cell disease - Market size and forecast 2023-2028
        • Chart on Sickle cell disease - Market size and forecast 2023-2028 ($ million)
        • Data Table on Sickle cell disease - Market size and forecast 2023-2028 ($ million)
        • Chart on Sickle cell disease - Year-over-year growth 2023-2028 (%)
        • Data Table on Sickle cell disease - Year-over-year growth 2023-2028 (%)
      • 8.5 Thalassemia - Market size and forecast 2023-2028
        • Chart on Thalassemia - Market size and forecast 2023-2028 ($ million)
        • Data Table on Thalassemia - Market size and forecast 2023-2028 ($ million)
        • Chart on Thalassemia - Year-over-year growth 2023-2028 (%)
        • Data Table on Thalassemia - Year-over-year growth 2023-2028 (%)
      • 8.6 Myelodysplastic syndromes - Market size and forecast 2023-2028
        • Chart on Myelodysplastic syndromes - Market size and forecast 2023-2028 ($ million)
        • Data Table on Myelodysplastic syndromes - Market size and forecast 2023-2028 ($ million)
        • Chart on Myelodysplastic syndromes - Year-over-year growth 2023-2028 (%)
        • Data Table on Myelodysplastic syndromes - Year-over-year growth 2023-2028 (%)
      • 8.7 Market opportunity by Disease Type
        • Market opportunity by Disease Type ($ million)
        • Data Table on Market opportunity by Disease Type ($ million)

      9 Market Segmentation by End-user

      • 9.1 Market segments
        • Chart on End-user - Market share 2023-2028 (%)
        • Data Table on End-user - Market share 2023-2028 (%)
      • 9.2 Comparison by End-user
        • Chart on Comparison by End-user
        • Data Table on Comparison by End-user
      • 9.3 Hospitals - Market size and forecast 2023-2028
        • Chart on Hospitals - Market size and forecast 2023-2028 ($ million)
        • Data Table on Hospitals - Market size and forecast 2023-2028 ($ million)
        • Chart on Hospitals - Year-over-year growth 2023-2028 (%)
        • Data Table on Hospitals - Year-over-year growth 2023-2028 (%)
      • 9.4 Specialty clinics - Market size and forecast 2023-2028
        • Chart on Specialty clinics - Market size and forecast 2023-2028 ($ million)
        • Data Table on Specialty clinics - Market size and forecast 2023-2028 ($ million)
        • Chart on Specialty clinics - Year-over-year growth 2023-2028 (%)
        • Data Table on Specialty clinics - Year-over-year growth 2023-2028 (%)
      • 9.5 Research institutes - Market size and forecast 2023-2028
        • Chart on Research institutes - Market size and forecast 2023-2028 ($ million)
        • Data Table on Research institutes - Market size and forecast 2023-2028 ($ million)
        • Chart on Research institutes - Year-over-year growth 2023-2028 (%)
        • Data Table on Research institutes - Year-over-year growth 2023-2028 (%)
      • 9.6 Pharmaceutical companies - Market size and forecast 2023-2028
        • Chart on Pharmaceutical companies - Market size and forecast 2023-2028 ($ million)
        • Data Table on Pharmaceutical companies - Market size and forecast 2023-2028 ($ million)
        • Chart on Pharmaceutical companies - Year-over-year growth 2023-2028 (%)
        • Data Table on Pharmaceutical companies - Year-over-year growth 2023-2028 (%)
      • 9.7 Market opportunity by End-user
        • Market opportunity by End-user ($ million)
        • Data Table on Market opportunity by End-user ($ million)

      10 Customer Landscape

      • 10.1 Customer landscape overview
        • Analysis of price sensitivity, lifecycle, customer purchase basket, adoption rates, and purchase criteria

      11 Geographic Landscape

      • 11.1 Geographic segmentation
        • Chart on Market share by geography 2023-2028 (%)
        • Data Table on Market share by geography 2023-2028 (%)
      • 11.2 Geographic comparison
        • Chart on Geographic comparison
        • Data Table on Geographic comparison
      • 11.3 North America - Market size and forecast 2023-2028
        • Chart on North America - Market size and forecast 2023-2028 ($ million)
        • Data Table on North America - Market size and forecast 2023-2028 ($ million)
        • Chart on North America - Year-over-year growth 2023-2028 (%)
        • Data Table on North America - Year-over-year growth 2023-2028 (%)
      • 11.4 Europe - Market size and forecast 2023-2028
        • Chart on Europe - Market size and forecast 2023-2028 ($ million)
        • Data Table on Europe - Market size and forecast 2023-2028 ($ million)
        • Chart on Europe - Year-over-year growth 2023-2028 (%)
        • Data Table on Europe - Year-over-year growth 2023-2028 (%)
      • 11.5 Asia - Market size and forecast 2023-2028
        • Chart on Asia - Market size and forecast 2023-2028 ($ million)
        • Data Table on Asia - Market size and forecast 2023-2028 ($ million)
        • Chart on Asia - Year-over-year growth 2023-2028 (%)
        • Data Table on Asia - Year-over-year growth 2023-2028 (%)
      • 11.6 Rest of World (ROW) - Market size and forecast 2023-2028
        • Chart on Rest of World (ROW) - Market size and forecast 2023-2028 ($ million)
        • Data Table on Rest of World (ROW) - Market size and forecast 2023-2028 ($ million)
        • Chart on Rest of World (ROW) - Year-over-year growth 2023-2028 (%)
        • Data Table on Rest of World (ROW) - Year-over-year growth 2023-2028 (%)
      • 11.7 US - Market size and forecast 2023-2028
        • Chart on US - Market size and forecast 2023-2028 ($ million)
        • Data Table on US - Market size and forecast 2023-2028 ($ million)
        • Chart on US - Year-over-year growth 2023-2028 (%)
        • Data Table on US - Year-over-year growth 2023-2028 (%)
      • 11.8 China - Market size and forecast 2023-2028
        • Chart on China - Market size and forecast 2023-2028 ($ million)
        • Data Table on China - Market size and forecast 2023-2028 ($ million)
        • Chart on China - Year-over-year growth 2023-2028 (%)
        • Data Table on China - Year-over-year growth 2023-2028 (%)
      • 11.9 UK - Market size and forecast 2023-2028
        • Chart on UK - Market size and forecast 2023-2028 ($ million)
        • Data Table on UK - Market size and forecast 2023-2028 ($ million)
        • Chart on UK - Year-over-year growth 2023-2028 (%)
        • Data Table on UK - Year-over-year growth 2023-2028 (%)
      • 11.10 Germany - Market size and forecast 2023-2028
        • Chart on Germany - Market size and forecast 2023-2028 ($ million)
        • Data Table on Germany - Market size and forecast 2023-2028 ($ million)
        • Chart on Germany - Year-over-year growth 2023-2028 (%)
        • Data Table on Germany - Year-over-year growth 2023-2028 (%)
      • 11.11 Japan - Market size and forecast 2023-2028
        • Chart on Japan - Market size and forecast 2023-2028 ($ million)
        • Data Table on Japan - Market size and forecast 2023-2028 ($ million)
        • Chart on Japan - Year-over-year growth 2023-2028 (%)
        • Data Table on Japan - Year-over-year growth 2023-2028 (%)
      • 11.12 India - Market size and forecast 2023-2028
        • Chart on India - Market size and forecast 2023-2028 ($ million)
        • Data Table on India - Market size and forecast 2023-2028 ($ million)
        • Chart on India - Year-over-year growth 2023-2028 (%)
        • Data Table on India - Year-over-year growth 2023-2028 (%)
      • 11.13 France - Market size and forecast 2023-2028
        • Chart on France - Market size and forecast 2023-2028 ($ million)
        • Data Table on France - Market size and forecast 2023-2028 ($ million)
        • Chart on France - Year-over-year growth 2023-2028 (%)
        • Data Table on France - Year-over-year growth 2023-2028 (%)
      • 11.14 Italy - Market size and forecast 2023-2028
        • Chart on Italy - Market size and forecast 2023-2028 ($ million)
        • Data Table on Italy - Market size and forecast 2023-2028 ($ million)
        • Chart on Italy - Year-over-year growth 2023-2028 (%)
        • Data Table on Italy - Year-over-year growth 2023-2028 (%)
      • 11.15 South Korea - Market size and forecast 2023-2028
        • Chart on South Korea - Market size and forecast 2023-2028 ($ million)
        • Data Table on South Korea - Market size and forecast 2023-2028 ($ million)
        • Chart on South Korea - Year-over-year growth 2023-2028 (%)
        • Data Table on South Korea - Year-over-year growth 2023-2028 (%)
      • 11.16 Singapore - Market size and forecast 2023-2028
        • Chart on Singapore - Market size and forecast 2023-2028 ($ million)
        • Data Table on Singapore - Market size and forecast 2023-2028 ($ million)
        • Chart on Singapore - Year-over-year growth 2023-2028 (%)
        • Data Table on Singapore - Year-over-year growth 2023-2028 (%)
      • 11.17 Market opportunity by geography
        • Market opportunity by geography ($ million)
        • Data Tables on Market opportunity by geography ($ million)

      12 Drivers, Challenges, and Opportunity/Restraints

      • 12.1 Market drivers
        • 12.2 Market challenges
          • 12.3 Impact of drivers and challenges
            • Impact of drivers and challenges in 2023 and 2028
          • 12.4 Market opportunities/restraints

            13 Competitive Landscape

            • 13.1 Overview
              • 13.2 Competitive Landscape
                • Overview on criticality of inputs and factors of differentiation
              • 13.3 Landscape disruption
                • Overview on factors of disruption
              • 13.4 Industry risks
                • Impact of key risks on business

              14 Competitive Analysis

              • 14.1 Companies profiled
                • Companies covered
              • 14.2 Company ranking index
                • Company ranking index
              • 14.3 Market positioning of companies
                • Matrix on companies position and classification
              • 14.4 AbbVie Inc.
                • AbbVie Inc. - Overview
                • AbbVie Inc. - Product / Service
                • AbbVie Inc. - Key news
                • AbbVie Inc. - Key offerings
                • SWOT
              • 14.5 AstraZeneca Plc
                • AstraZeneca Plc - Overview
                • AstraZeneca Plc - Product / Service
                • AstraZeneca Plc - Key news
                • AstraZeneca Plc - Key offerings
                • SWOT
              • 14.6 Bayer AG
                • Bayer AG - Overview
                • Bayer AG - Business segments
                • Bayer AG - Key news
                • Bayer AG - Key offerings
                • Bayer AG - Segment focus
                • SWOT
              • 14.7 bluebird bio Inc.
                • bluebird bio Inc. - Overview
                • bluebird bio Inc. - Product / Service
                • bluebird bio Inc. - Key offerings
                • SWOT
              • 14.8 Bristol Myers Squibb Co.
                • Bristol Myers Squibb Co. - Overview
                • Bristol Myers Squibb Co. - Product / Service
                • Bristol Myers Squibb Co. - Key news
                • Bristol Myers Squibb Co. - Key offerings
                • SWOT
              • 14.9 CSL Ltd.
                • CSL Ltd. - Overview
                • CSL Ltd. - Business segments
                • CSL Ltd. - Key news
                • CSL Ltd. - Key offerings
                • CSL Ltd. - Segment focus
                • SWOT
              • 14.10 F. Hoffmann La Roche Ltd.
                • F. Hoffmann La Roche Ltd. - Overview
                • F. Hoffmann La Roche Ltd. - Business segments
                • F. Hoffmann La Roche Ltd. - Key news
                • F. Hoffmann La Roche Ltd. - Key offerings
                • F. Hoffmann La Roche Ltd. - Segment focus
                • SWOT
              • 14.11 Jazz Pharmaceuticals Plc
                • Jazz Pharmaceuticals Plc - Overview
                • Jazz Pharmaceuticals Plc - Product / Service
                • Jazz Pharmaceuticals Plc - Key news
                • Jazz Pharmaceuticals Plc - Key offerings
                • SWOT
              • 14.12 Johnson and Johnson Services Inc.
                • Johnson and Johnson Services Inc. - Overview
                • Johnson and Johnson Services Inc. - Business segments
                • Johnson and Johnson Services Inc. - Key news
                • Johnson and Johnson Services Inc. - Key offerings
                • Johnson and Johnson Services Inc. - Segment focus
                • SWOT
              • 14.13 Merck and Co. Inc.
                • Merck and Co. Inc. - Overview
                • Merck and Co. Inc. - Business segments
                • Merck and Co. Inc. - Key news
                • Merck and Co. Inc. - Key offerings
                • Merck and Co. Inc. - Segment focus
                • SWOT
              • 14.14 Novartis AG
                • Novartis AG - Overview
                • Novartis AG - Business segments
                • Novartis AG - Key news
                • Novartis AG - Key offerings
                • Novartis AG - Segment focus
                • SWOT
              • 14.15 Novo Nordisk AS
                • Novo Nordisk AS - Overview
                • Novo Nordisk AS - Business segments
                • Novo Nordisk AS - Key offerings
                • Novo Nordisk AS - Segment focus
                • SWOT
              • 14.16 Pfizer Inc.
                • Pfizer Inc. - Overview
                • Pfizer Inc. - Product / Service
                • Pfizer Inc. - Key news
                • Pfizer Inc. - Key offerings
                • SWOT
              • 14.17 Sanofi SA
                • Sanofi SA - Overview
                • Sanofi SA - Business segments
                • Sanofi SA - Key news
                • Sanofi SA - Key offerings
                • Sanofi SA - Segment focus
                • SWOT
              • 14.18 Takeda Pharmaceutical Co. Ltd.
                • Takeda Pharmaceutical Co. Ltd. - Overview
                • Takeda Pharmaceutical Co. Ltd. - Product / Service
                • Takeda Pharmaceutical Co. Ltd. - Key news
                • Takeda Pharmaceutical Co. Ltd. - Key offerings
                • SWOT

              15 Appendix

              • 15.1 Scope of the report
                • 15.2 Inclusions and exclusions checklist
                  • Inclusions checklist
                  • Exclusions checklist
                • 15.3 Currency conversion rates for US$
                  • Currency conversion rates for US$
                • 15.4 Research methodology
                  • Research methodology
                • 15.5 Data procurement
                  • Information sources
                • 15.6 Data validation
                  • Data validation
                • 15.7 Validation techniques employed for market sizing
                  • Validation techniques employed for market sizing
                • 15.8 Data synthesis
                  • Data synthesis
                • 15.9 360 degree market analysis
                  • 360 degree market analysis
                • 15.10 List of abbreviations
                  • List of abbreviations

                Research Methodology

                Technavio presents a detailed picture of the market by way of study, synthesis, and summation of data from multiple sources. The analysts have presented the various facets of the market with a particular focus on identifying the key industry influencers. The data thus presented is comprehensive, reliable, and the result of extensive research, both primary and secondary.

                INFORMATION SOURCES

                Primary sources

                • Manufacturers and suppliers
                • Channel partners
                • Industry experts
                • Strategic decision makers

                Secondary sources

                • Industry journals and periodicals
                • Government data
                • Financial reports of key industry players
                • Historical data
                • Press releases

                DATA ANALYSIS

                Data Synthesis

                • Collation of data
                • Estimation of key figures
                • Analysis of derived insights

                Data Validation

                • Triangulation with data models
                • Reference against proprietary databases
                • Corroboration with industry experts

                REPORT WRITING

                Qualitative

                • Market drivers
                • Market challenges
                • Market trends
                • Five forces analysis

                Quantitative

                • Market size and forecast
                • Market segmentation
                • Geographical insights
                • Competitive landscape

                Interested in this report?

                Get your sample now to see our research methodology and insights!

                Download Now

                Frequently Asked Questions

                Rare Hematology market growth will increase by 4585.1 million during 2024-2028 .

                The Rare Hematology market is expected to grow at a CAGR of 5.7% during 2024-2028 .

                Rare Hematology market is segmented by Disease Type( Hemophilia, Sickle cell disease, Thalassemia, Myelodysplastic syndromes) End-user( Hospitals, Specialty clinics, Research institutes, Pharmaceutical companies)

                AbbVie Inc., AstraZeneca Plc, Bayer AG, Biogen Inc., bluebird bio Inc., Bristol Myers Squibb Co., CSL Ltd., Emmaus Medical Inc., F. Hoffmann La Roche Ltd., GlaxoSmithKline Plc, Grifols SA, Jazz Pharmaceuticals Plc, Johnson and Johnson Services Inc., Merck and Co. Inc., Novartis AG, Novo Nordisk AS, Octapharma AG, Pfizer Inc., Sanofi SA, Takeda Pharmaceutical Co. Ltd. are a few of the key vendors in the Rare Hematology market.

                North America will register the highest growth rate of 35.4% among the other regions. Therefore, the Rare Hematology market in North America is expected to garner significant business opportunities for the vendors during the forecast period.

                US, China, UK, Germany, Japan, India, France, Italy, South Korea, Singapore

                • Enhancement of strategic portfoliosThe enhancement of strategic portfolios is a significant driver in the global rare hematology market is the driving factor this market.
                • as companies focus on expanding their product offerings to address unmet medical needs and drive growth. A prime example of this trend is the recent performance of the Swedish drugmaker Sobi is the driving factor this market.
                • which reported substantial growth in its hematology profile during the second quarter of 2024.Sobi's hematology segment saw a 13% year-over-year increase in sales is the driving factor this market.
                • reaching $363 million (3.86 billion Swedish krona). This growth was a key contributor to the company's overall performance is the driving factor this market.
                • highlighting the importance of a robust hematology portfolio. Additionally is the driving factor this market.
                • Sobi's immunology franchise experienced a 7% sales growth is the driving factor this market.
                • while its specialty care segment grew by 12% compared to the same period in 2023.A significant portion of Sobi's quarterly revenue is the driving factor this market.
                • over 40% is the driving factor this market.
                • was derived from its strategic portfolio of growth drivers. This portfolio includes several high-impact brands such as Empaveli is the driving factor this market.
                • developed in partnership with Apellis is the driving factor this market.
                • which targets rare blood disorders. Other notable products in this portfolio are Doptelet is the driving factor this market.
                • a medication for blood clotting disorders; Gamifant is the driving factor this market.
                • used to treat ultra-rare hyperinflammation conditions; and Vonjo is the driving factor this market.
                • a recently acquired treatment for myelofibrosis.The strategic enhancement of portfolios allows companies like Sobi to diversify their product offerings and strengthen their market position. By focusing on high-growth areas and acquiring or partnering on innovative therapies is the driving factor this market.
                • these companies can better meet the needs of patients with rare hematologic conditions. This approach not only drives revenue growth but also positions the company as a leader in the global rare hematology market.In conclusion is the driving factor this market.
                • the enhancement of strategic portfolios is a crucial driver in the global rare hematology market. Companies that successfully expand and diversify their product offerings can achieve significant growth and improve patient outcomes. As the market continues to evolve is the driving factor this market.
                • the focus on strategic portfolio enhancement will remain a key factor in driving innovation and addressing the complex needs of patients with rare blood disorders. is the driving factor this market.

                The Rare Hematology market vendors should focus on grabbing business opportunities from the Hemophilia segment as it accounted for the largest market share in the base year.