Reach Stacker Market Analysis, Size, and Forecast 2026-2030: APAC (China, Japan, and India), Europe (Germany, UK, and France), Middle East and Africa (Saudi Arabia, UAE, and South Africa), North America (US, Canada, and Mexico), South America (Brazil, Argentina, and Chile), and Rest of World (ROW)

Reach Stacker Market Analysis, Size, and Forecast 2026-2030:
APAC (China, Japan, and India), Europe (Germany, UK, and France), Middle East and Africa (Saudi Arabia, UAE, and South Africa), North America (US, Canada, and Mexico), South America (Brazil, Argentina, and Chile), and Rest of World (ROW)

Published: May 2026 283 Pages SKU: IRTNTR77621

Market Overview at a Glance

$326.5 Mn
Market Opportunity
5.4%
CAGR 2025 - 2030
50.3%
APAC Growth
$839 Mn
IC engine segment 2024

Reach Stacker Market Size and Growth Forecast 2026-2030

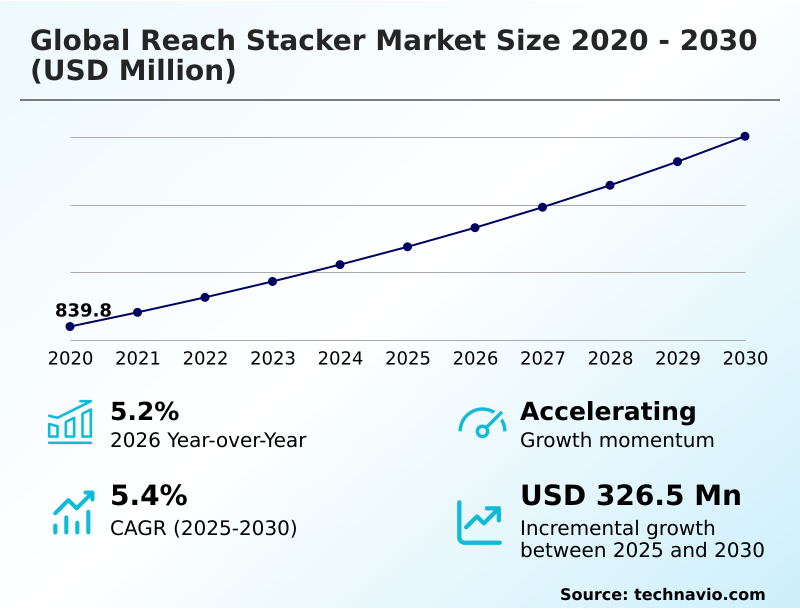
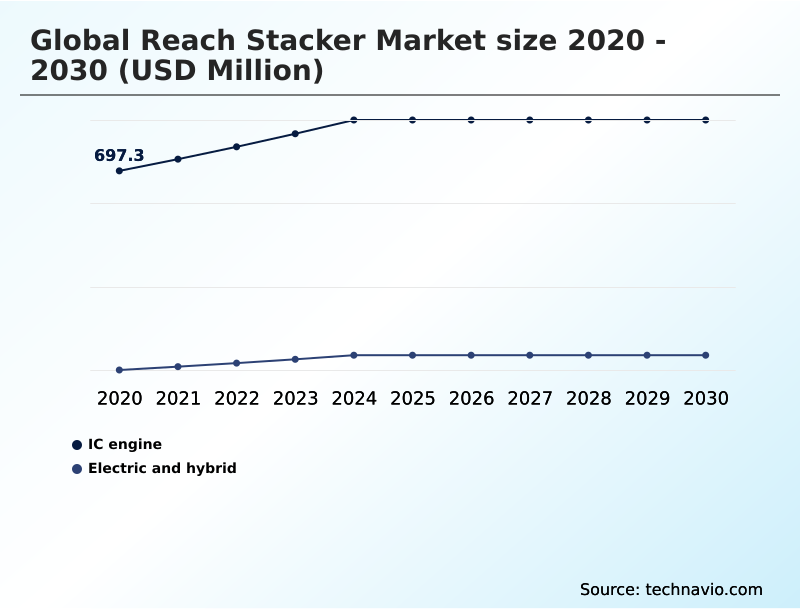
The Reach Stacker Market size was valued at USD 1.08 billion in 2025 growing at a CAGR of 5.4% during the forecast period 2026-2030.

APAC accounts for 50.3% of incremental growth during the forecast period. The IC engine segment by Type was valued at USD 839 million in 2024, while the Sea port segment holds the largest revenue share by Application.

The market is projected to grow by USD 562.1 million from 2020 to 2030, with USD 326.5 million of the growth expected during the forecast period of 2025 to 2030.

Get Key Insights on Market Forecast (PDF) Request Free Sample

Reach Stacker Market Overview

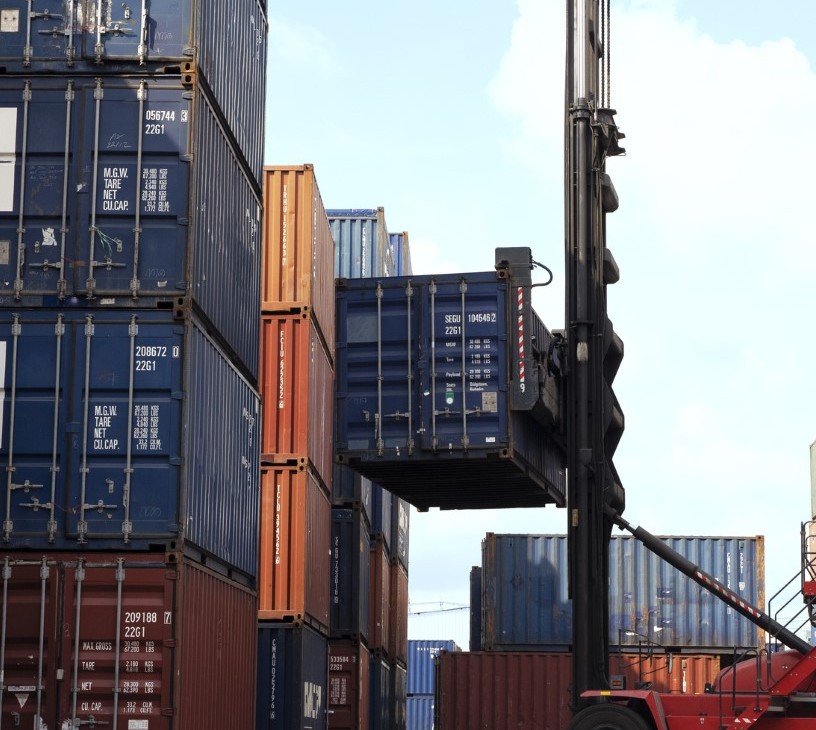
The reach stacker market is integral to global logistics, characterized by a persistent year-over-year growth of 5.2% driven by expanding port infrastructure and the demands of intermodal freight. At its core, the market revolves around equipment defined by its telescopic boom and specialized spreader attachment, designed for high-density container stacking. A key trend is the integration of fleet management software and telematics to enhance container handling efficiency, a direct response to the pressures of the e-commerce boom. For instance, a modern intermodal terminal deploying a network of reach stackers linked to a central terminal operating system can optimize container movements in real-time, reducing idle time and improving overall yard productivity. This digital transformation is critical for maintaining supply chain resilience, especially as the APAC region, which accounts for over 50% of the market's incremental growth, continues to modernize its port operations. The industry's evolution is shaped by the dual needs for higher throughput and sustainable, zero-emission port solutions.

Drivers, Trends, and Challenges in the Reach Stacker Market

Strategic decisions in the reach stacker market are increasingly influenced by a complex interplay of operational economics and regulatory compliance. The impact of Stage V emissions on reach stacker design, for example, has forced OEMs to innovate, leading to a critical debate around electric reach stacker TCO vs diesel models.

While electric variants offer lower operating expenses and align with corporate sustainability goals, the upfront investment and charging infrastructure requirements remain significant considerations for procurement managers. In practice, a high-throughput port facility implementing reach stacker automation in high-throughput ports leverages telematics data for optimizing container handling, which can improve cycle times by over 15% compared to manual dispatching.

These systems provide the granular data needed to justify investments in automation and electrification. Beyond maritime terminals, the demand for heavy-duty reach stackers for industrial applications, such as in steel mills and manufacturing plants, is creating new growth avenues.

This diversification underscores a market where incremental growth, valued at over USD 326 million, is driven by both technological advancement and expansion into adjacent industrial segments.

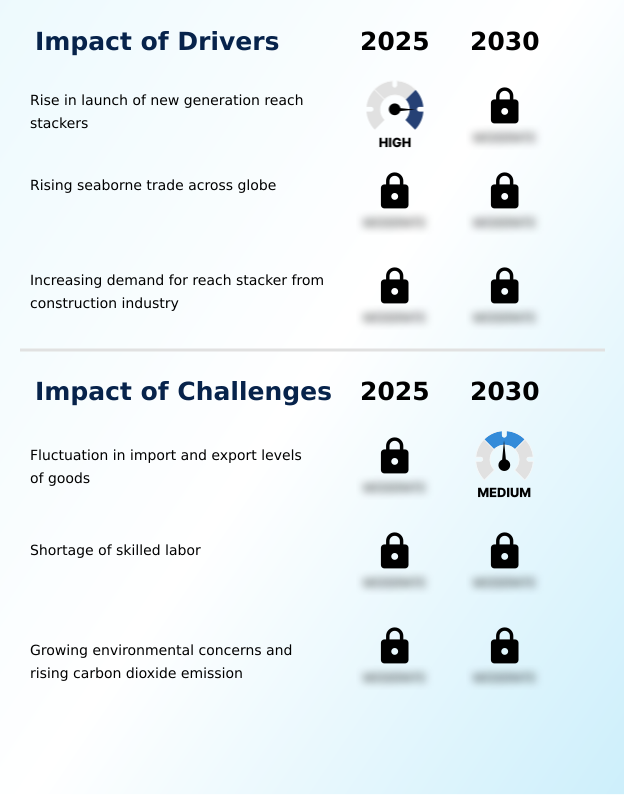
Primary Growth Driver: The market's growth is primarily driven by the continuous launch of new-generation reach stackers equipped with advanced technologies, higher lifting capacities, and eco-efficient power systems.

A key market driver is the continuous innovation in reach stacker design, particularly the launch of next-generation models with advanced power systems.

The industry is seeing a pronounced shift toward equipment featuring an electric powertrain or a hybrid drivetrain, responding to global pressures for decarbonization.

These new machines incorporate sophisticated features like energy recovery modules, which capture and reuse energy during braking and lowering operations, significantly improving efficiency.

Furthermore, the integration of digital monitoring systems and intelligent control systems enhances performance for critical tasks like laden container handling.

This technological evolution provides a compelling value proposition for operators, as it promises not only compliance with stricter emissions regulations but also lower operational costs and improved uptime, accelerating fleet replacement cycles.

Emerging Market Trend: The market's trajectory is significantly influenced by the growth of the e-commerce industry. This trend is compelling a redesign of logistics hubs to meet escalating demands for faster delivery and near-zero latency in container sorting.

The rapid expansion of e-commerce is fundamentally reshaping port and terminal logistics, creating a primary market trend centered on speed and efficiency. This shift is compelling operators to move beyond traditional manual processes toward automated, data-driven workflows to achieve higher yard productivity.

The integration of reach stackers with terminal operating systems is becoming critical for cargo management optimization, allowing for real-time dispatching and minimized container search times. To support this, new equipment is increasingly outfitted with automated positioning sensors that enable precise, semi-autonomous movements.

This trend is not just about speed but also about maximizing spatial efficiency, as e-commerce fulfillment centers and inland depots require solutions for high-density stacking to manage fluctuating inventory levels with precision.

Key Industry Challenge: Fluctuations in global import and export levels for goods present a key challenge, directly impacting equipment procurement cycles and overall market stability.

A primary market challenge stems from the inherent volatility in global trade, which creates uncertainty in equipment demand and complicates capital expenditure planning for port operators. These fluctuations directly impact procurement cycles for high-value assets like reach stackers.

In response, many operators are shifting their focus from new acquisitions to extending the life of their existing fleets, intensifying the need for effective fleet management software and robust predictive maintenance schedules. This cautious investment climate puts pressure on manufacturers, who must contend with unpredictable order volumes.

The challenge is to offer flexible financing or service models that help customers manage economic downturns while ensuring long-term supply chain resilience and managing the total cost of ownership of their material handling assets.

Explore Full Market Dynamics Analysis Request Free Sample

Reach Stacker Market Segmentation

The reach stacker industry research report provides comprehensive data including region-wise segment analysis, with forecasts and analysis for the period 2026-2030, as well as historical data from 2020-2024 for the following segments.

Market Segment by Type
  • IC engine
  • Electric and hybrid
Market Segment by Application
  • Sea port
  • Industrial
Market Segment by Capacity
  • Between 30 - 45 tons
  • Above 45 tons
  • Below 30 tons
Market Segment by Geography
APAC
China, Japan, India, South Korea, Australia, Indonesia
Europe
Germany, UK, France, Italy, Spain, The Netherlands
Middle East and Africa
Saudi Arabia, UAE, South Africa, Israel, Turkey
North America
US, Canada, Mexico
South America
Brazil, Argentina, Chile

Type Segment Analysis

The ic engine segment is estimated to witness significant growth during the forecast period.

The Internal Combustion (IC) engine segment remains the foundation of the reach stacker market, prized for its reliability in 24/7 terminal operations.

This dominance is rooted in superior power density for laden container handling and operational flexibility in areas lacking charging infrastructure.

However, the segment is evolving; to comply with EU Stage V and Tier 4 Final emissions standards, new models integrate IC engine technology with selective catalytic reduction and diesel particulate filters.

Procurement decisions now evaluate how advanced hydraulic systems and variable displacement hydraulics contribute to fuel efficiency.

Representing a market size of over USD 879 million in 2025, these advanced IC-powered machines, featuring sophisticated energy recovery modules, offer a compelling total cost of ownership for operators balancing performance with tightening environmental mandates.

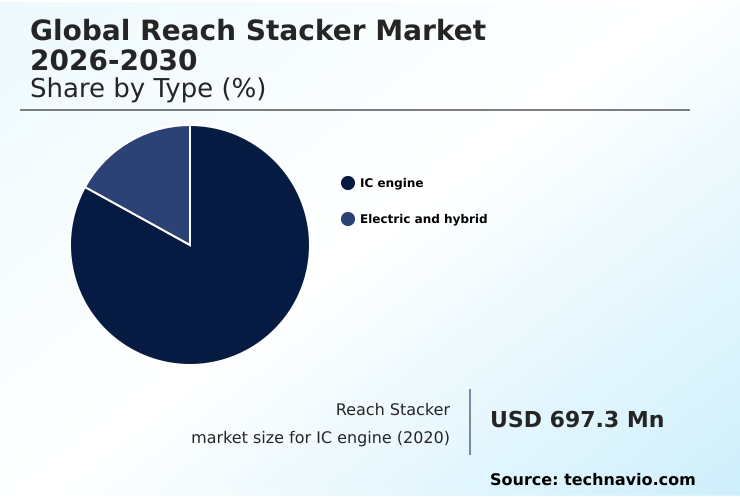
The IC engine segment was valued at USD 839 million in 2024 and showed a gradual increase during the forecast period.

Reach Stacker Market by Region: APAC Leads with 50.3% Growth Share

APAC is estimated to contribute 50.3% to the growth of the global market during the forecast period.

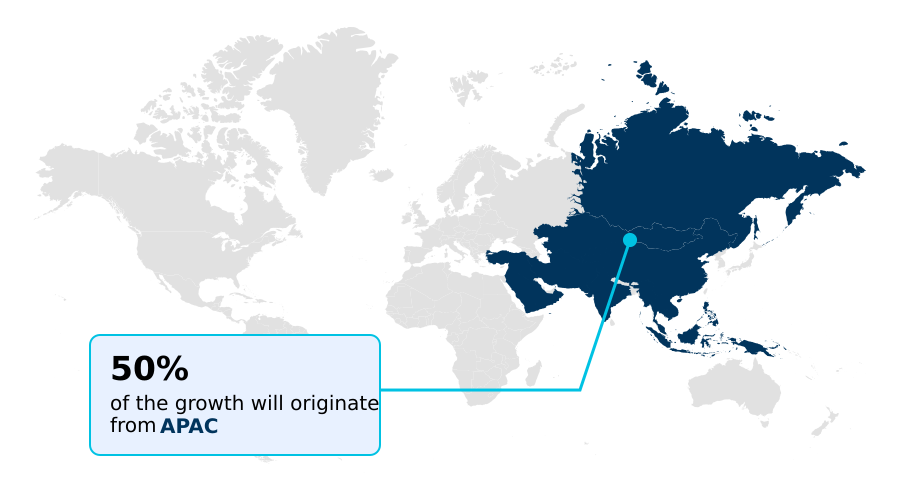
The geographic landscape of the reach stacker market is dominated by APAC, which is projected to grow at a CAGR of 6.7% and contribute approximately 50.32% of the total market's incremental growth.

This expansion is fueled by massive investments in port infrastructure and intermodal freight logistics across the region.

Countries like China, with a market value of around USD 114.9 million in 2025, are at the forefront of adopting technologies for high-density stacking and automated yard operations to manage immense trade volumes.

The region is also a key battleground for decarbonization goals, with a visible shift toward zero-emission port solutions and electric-powered equipment in nations with stringent urban pollution regulations, solidifying APAC's role as a benchmark for innovation in the sector.

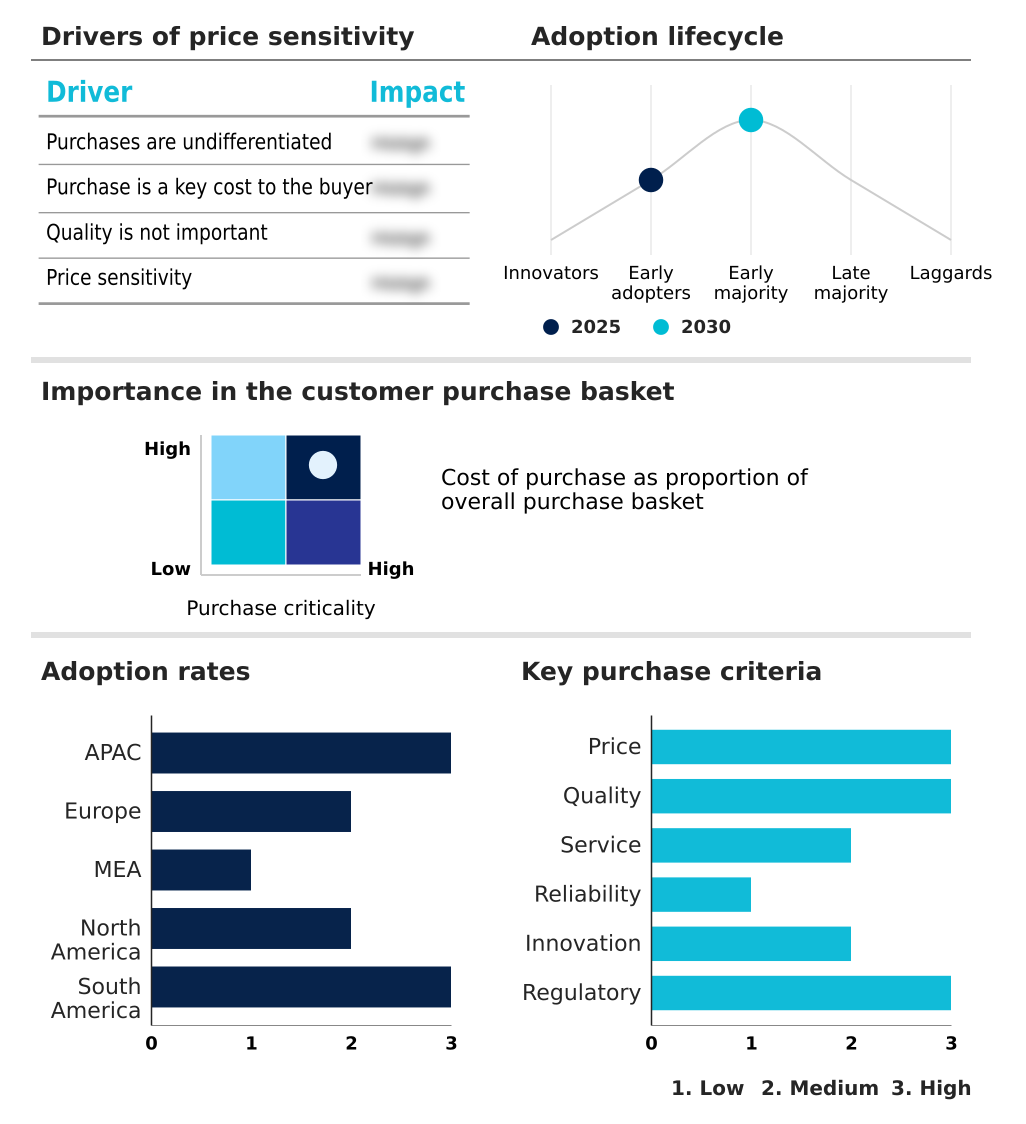
Customer Landscape Analysis for the Reach Stacker Market

The reach stacker market forecasting report includes the adoption lifecycle of the market, covering from the innovator’s stage to the laggard’s stage. It focuses on adoption rates in different regions based on penetration. Furthermore, the reach stacker market report also includes key purchase criteria and drivers of price sensitivity to help companies evaluate and develop their market growth analysis strategies.

Competitive Landscape of the Reach Stacker Market

Companies are implementing various strategies, such as strategic alliances, partnerships, mergers and acquisitions, geographical expansion, and product/service launches, to enhance their presence in the reach stacker market industry.

Anhui Heli Co. Ltd. - Offerings include high-performance reach stackers and heavy-duty forklifts, engineered for demanding container handling and material transport applications in port and industrial environments.

The industry research and growth report includes detailed analyses of the competitive landscape of the market and information about key companies, including:

  • Anhui Heli Co. Ltd.
  • CVS Ferrari SpA
  • Dalian Forklift Co. Ltd.
  • Hangcha Group Co. Ltd.
  • Hyster Yale Materials Handling
  • Kalmar Corp.
  • KION Group AG
  • Konecranes plc
  • Liebherr International AG
  • Liugong Machinery Co. Ltd.
  • Lonking Holdings Ltd.
  • Meclift Oy
  • Sany Heavy Industry Co. Ltd.
  • Svetruck AB
  • Taylor Machine Works Inc.
  • Toyota Motor Corp.
  • XCMG Group
  • Zhenhua Heavy Industries Co.
  • Zoomlion Industry Co. Ltd.

Qualitative and quantitative analysis of companies has been conducted to help clients understand the wider business environment as well as the strengths and weaknesses of key industry players. Data is qualitatively analyzed to categorize companies as pure play, category-focused, industry-focused, and diversified; it is quantitatively analyzed to categorize companies as dominant, leading, strong, tentative, and weak.

Recent Developments in the Reach Stacker Market

  • In February 2025, Kalmar Corp. confirmed in a strategic market update that fluctuating global trade patterns are leading major terminal operators to prioritize equipment life extension and more selective procurement over new acquisitions.
  • In August 2025, Sany Heavy Industry Co. Ltd. unveiled its 50-ton Energy Storage Reach Stacker, designed with integrated energy storage technology to support high-throughput e-commerce fulfillment centers by enabling longer operational hours with reduced emissions.
  • In November 2025, Konecranes plc introduced its upgraded E-Ver electric reach stacker, which features fast charging capabilities and smart digital controls to enhance operational efficiency and support decarbonization goals in environmentally sensitive ports.
  • In December 2025, Ashok Leyland debuted its next-generation H6 engines at EXCON 2025, engineered with advanced combustion systems and improved turbocharging to deliver higher fuel efficiency and lower emissions for construction machinery.

Research Analyst Overview: Reach Stacker Market

The operational value of reach stackers is evolving beyond mere lifting capacity, with a decisive shift towards intelligent, connected machinery. Boardroom decisions on fleet acquisition now center on the integration of advanced technologies like telematics integration and automated positioning sensors, which are becoming standard.

While IC engine technology, now enhanced with diesel particulate filters and selective catalytic reduction systems, still commands the majority of the market, the business case for models with an electric powertrain or hybrid drivetrain is strengthening. The debate weighs the long-term benefits of lithium-ion battery technology against the proven durability of conventional engines.

Core components such as the telescopic boom, spreader attachment, and advanced hydraulic systems are being optimized for efficiency, governed by intelligent control systems. This technological layer, which includes variable displacement hydraulics and energy recovery modules, is crucial for reducing fuel consumption and is managed through sophisticated fleet management software.

The strategic focus is on leveraging these advancements to improve productivity and comply with emissions standards like EU Stage V.

Dive into Technavio’s robust research methodology, blending expert interviews, extensive data synthesis, and validated models for unparalleled Reach Stacker Market insights. See full methodology.

Request Free Sample

Market Scope
Page number 283
Base year 2025
Historic period 2020-2024
Forecast period 2026-2030
Growth momentum & CAGR Accelerate at a CAGR of 5.4%
Market growth 2026-2030 USD 326.5 million
Market structure Fragmented
YoY growth 2025-2026(%) 5.2%
Key countries China, Japan, India, South Korea, Australia, Indonesia, Germany, UK, France, Italy, Spain, The Netherlands, Saudi Arabia, UAE, South Africa, Israel, Turkey, US, Canada, Mexico, Brazil, Argentina and Chile
Competitive landscape Leading Companies, Market Positioning of Companies, Competitive Strategies, and Industry Risks

Reach Stacker Market: Key Questions Answered in This Report

  • What is the expected growth of the Reach Stacker Market between 2026 and 2030?

    • The Reach Stacker Market is expected to grow by USD 326.5 million during 2026-2030, registering a CAGR of 5.4%. Year-over-year growth in 2026 is estimated at 5.2%%. This acceleration is shaped by rise in launch of new generation reach stackers, which is intensifying demand across multiple end-use verticals covered in the report.

  • What segmentation does the market report cover?

    • The report is segmented by Type (IC engine, and Electric and hybrid), Application (Sea port, and Industrial), Capacity (Between 30 - 45 tons, Above 45 tons, and Below 30 tons) and Geography (APAC, Europe, Middle East and Africa, North America, South America). Among these, the IC engine segment is estimated to witness significant growth during the forecast period, driven by rising adoption across key application areas. Each segment includes detailed qualitative and quantitative analysis, along with historical data from 2020-2024 and forecasts through 2030 with year-over-year growth rates.

  • Which regions are analyzed in the report?

    • The report covers APAC, Europe, Middle East and Africa, North America and South America. APAC is estimated to contribute 50.3% to market growth during the forecast period. Country-level analysis includes China, Japan, India, South Korea, Australia, Indonesia, Germany, UK, France, Italy, Spain, The Netherlands, Saudi Arabia, UAE, South Africa, Israel, Turkey, US, Canada, Mexico, Brazil, Argentina and Chile, with dedicated market size tables and year-over-year growth for each.

  • What are the key growth drivers and market challenges?

    • The primary driver is rise in launch of new generation reach stackers, which is accelerating investment and industry demand. The main challenge is fluctuation in import and export levels of goods, creating operational barriers for key market participants. The report quantifies the impact of each driver and challenge across 2026 and 2030 with comparative analysis.

  • Who are the major players in the Reach Stacker Market?

    • Key vendors include Anhui Heli Co. Ltd., CVS Ferrari SpA, Dalian Forklift Co. Ltd., Hangcha Group Co. Ltd., Hyster Yale Materials Handling, Kalmar Corp., KION Group AG, Konecranes plc, Liebherr International AG, Liugong Machinery Co. Ltd., Lonking Holdings Ltd., Meclift Oy, Sany Heavy Industry Co. Ltd., Svetruck AB, Taylor Machine Works Inc., Toyota Motor Corp., XCMG Group, Zhenhua Heavy Industries Co. and Zoomlion Industry Co. Ltd.. The report provides qualitative and quantitative analysis categorizing companies as dominant, leading, strong, tentative, and weak based on their market positioning. Company profiles include business segment analysis, SWOT assessment, key offerings, and recent strategic developments.

Reach Stacker Market Research Insights

Market dynamics are increasingly shaped by sustainability mandates and the focus on total cost of ownership. While conventional diesel models remain prevalent, the push toward decarbonization goals, guided by regulations like the EU Stage V emission standards, is accelerating the adoption of zero-emission port solutions.

Port operators are meticulously evaluating the long-term operational savings of electric models against the initial capital outlay. This strategic shift involves integrating equipment with terminal operating systems for enhanced cargo management optimization.

The adoption of predictive maintenance schedules, informed by real-time data from digital monitoring systems, is becoming standard practice to maximize uptime and extend asset life, reflecting a more sophisticated approach to fleet investment and operational efficiency in a competitive global trade environment.

We can help! Our analysts can customize this reach stacker market research report to meet your requirements.

Get in touch

1. Executive Summary

1.1 Market overview

Executive Summary - Chart on Market Overview
Executive Summary - Data Table on Market Overview
Executive Summary - Chart on Global Market Characteristics
Executive Summary - Chart on Market by Geography
Executive Summary - Chart on Market Segmentation by Type
Executive Summary - Chart on Market Segmentation by Application
Executive Summary - Chart on Market Segmentation by Capacity
Executive Summary - Chart on Incremental Growth
Executive Summary - Data Table on Incremental Growth
Executive Summary - Chart on Company Market Positioning

2. Technavio Analysis

2.1 Analysis of price sensitivity, lifecycle, customer purchase basket, adoption rates, and purchase criteria

2.2 Criticality of inputs and Factors of differentiation

Chart on Overview on criticality of inputs and factors of differentiation

2.3 Factors of disruption

Chart on Overview on factors of disruption

2.4 Impact of drivers and challenges

Chart on Impact of drivers and challenges in 2025 and 2030

3. Market Landscape

3.1 Market ecosystem

Chart on Parent Market
Data Table on - Parent Market

3.2 Market characteristics

Chart on Market characteristics analysis

3.3 Value chain analysis

Chart on Value chain analysis

4. Market Sizing

4.1 Market definition

Data Table on Offerings of companies included in the market definition

4.2 Market segment analysis

Market segments

4.3 Market size 2025

4.4 Market outlook: Forecast for 2025-2030

Chart on Global - Market size and forecast 2025-2030 ($ million)
Data Table on Global - Market size and forecast 2025-2030 ($ million)
Chart on Global Market: Year-over-year growth 2025-2030 (%)
Data Table on Global Market: Year-over-year growth 2025-2030 (%)

5. Historic Market Size

5.1 Global Reach Stacker Market 2020 - 2024

Historic Market Size - Data Table on Global Reach Stacker Market 2020 - 2024 ($ million)

5.2 Type segment analysis 2020 - 2024

Historic Market Size - Type Segment 2020 - 2024 ($ million)

5.3 Application segment analysis 2020 - 2024

Historic Market Size - Application Segment 2020 - 2024 ($ million)

5.4 Capacity segment analysis 2020 - 2024

Historic Market Size - Capacity Segment 2020 - 2024 ($ million)

5.5 Geography segment analysis 2020 - 2024

Historic Market Size - Geography Segment 2020 - 2024 ($ million)

5.6 Country segment analysis 2020 - 2024

Historic Market Size - Country Segment 2020 - 2024 ($ million)

6. Qualitative Analysis

6.1 Impact of AI on Global Reach Stacker Market

7. Five Forces Analysis

7.1 Five forces summary

Five forces analysis - Comparison between 2025 and 2030

7.2 Bargaining power of buyers

Bargaining power of buyers - Impact of key factors 2025 and 2030

7.3 Bargaining power of suppliers

Bargaining power of suppliers - Impact of key factors in 2025 and 2030

7.4 Threat of new entrants

Threat of new entrants - Impact of key factors in 2025 and 2030

7.5 Threat of substitutes

Threat of substitutes - Impact of key factors in 2025 and 2030

7.6 Threat of rivalry

Threat of rivalry - Impact of key factors in 2025 and 2030

7.7 Market condition

Chart on Market condition - Five forces 2025 and 2030

8. Market Segmentation by Type

8.1 Market segments

Chart on Type - Market share 2025-2030 (%)
Data Table on Type - Market share 2025-2030 (%)

8.2 Comparison by Type

Chart on Comparison by Type
Data Table on Comparison by Type

8.3 IC engine - Market size and forecast 2025-2030

Chart on IC engine - Market size and forecast 2025-2030 ($ million)
Data Table on IC engine - Market size and forecast 2025-2030 ($ million)
Chart on IC engine - Year-over-year growth 2025-2030 (%)
Data Table on IC engine - Year-over-year growth 2025-2030 (%)

8.4 Electric and hybrid - Market size and forecast 2025-2030

Chart on Electric and hybrid - Market size and forecast 2025-2030 ($ million)
Data Table on Electric and hybrid - Market size and forecast 2025-2030 ($ million)
Chart on Electric and hybrid - Year-over-year growth 2025-2030 (%)
Data Table on Electric and hybrid - Year-over-year growth 2025-2030 (%)

8.5 Market opportunity by Type

Market opportunity by Type ($ million)
Data Table on Market opportunity by Type ($ million)

9. Market Segmentation by Application

9.1 Market segments

Chart on Application - Market share 2025-2030 (%)
Data Table on Application - Market share 2025-2030 (%)

9.2 Comparison by Application

Chart on Comparison by Application
Data Table on Comparison by Application

9.3 Sea port - Market size and forecast 2025-2030

Chart on Sea port - Market size and forecast 2025-2030 ($ million)
Data Table on Sea port - Market size and forecast 2025-2030 ($ million)
Chart on Sea port - Year-over-year growth 2025-2030 (%)
Data Table on Sea port - Year-over-year growth 2025-2030 (%)

9.4 Industrial - Market size and forecast 2025-2030

Chart on Industrial - Market size and forecast 2025-2030 ($ million)
Data Table on Industrial - Market size and forecast 2025-2030 ($ million)
Chart on Industrial - Year-over-year growth 2025-2030 (%)
Data Table on Industrial - Year-over-year growth 2025-2030 (%)

9.5 Market opportunity by Application

Market opportunity by Application ($ million)
Data Table on Market opportunity by Application ($ million)

10. Market Segmentation by Capacity

10.1 Market segments

Chart on Capacity - Market share 2025-2030 (%)
Data Table on Capacity - Market share 2025-2030 (%)

10.2 Comparison by Capacity

Chart on Comparison by Capacity
Data Table on Comparison by Capacity

10.3 Between 30 - 45 tons - Market size and forecast 2025-2030

Chart on Between 30 - 45 tons - Market size and forecast 2025-2030 ($ million)
Data Table on Between 30 - 45 tons - Market size and forecast 2025-2030 ($ million)
Chart on Between 30 - 45 tons - Year-over-year growth 2025-2030 (%)
Data Table on Between 30 - 45 tons - Year-over-year growth 2025-2030 (%)

10.4 Above 45 tons - Market size and forecast 2025-2030

Chart on Above 45 tons - Market size and forecast 2025-2030 ($ million)
Data Table on Above 45 tons - Market size and forecast 2025-2030 ($ million)
Chart on Above 45 tons - Year-over-year growth 2025-2030 (%)
Data Table on Above 45 tons - Year-over-year growth 2025-2030 (%)

10.5 Below 30 tons - Market size and forecast 2025-2030

Chart on Below 30 tons - Market size and forecast 2025-2030 ($ million)
Data Table on Below 30 tons - Market size and forecast 2025-2030 ($ million)
Chart on Below 30 tons - Year-over-year growth 2025-2030 (%)
Data Table on Below 30 tons - Year-over-year growth 2025-2030 (%)

10.6 Market opportunity by Capacity

Market opportunity by Capacity ($ million)
Data Table on Market opportunity by Capacity ($ million)

11. Customer Landscape

11.1 Customer landscape overview

Analysis of price sensitivity, lifecycle, customer purchase basket, adoption rates, and purchase criteria

12. Geographic Landscape

12.1 Geographic segmentation

Chart on Market share by geography 2025-2030 (%)
Data Table on Market share by geography 2025-2030 (%)

12.2 Geographic comparison

Chart on Geographic comparison
Data Table on Geographic comparison

12.3 APAC - Market size and forecast 2025-2030

Chart on APAC - Market size and forecast 2025-2030 ($ million)
Data Table on APAC - Market size and forecast 2025-2030 ($ million)
Chart on APAC - Year-over-year growth 2025-2030 (%)
Data Table on APAC - Year-over-year growth 2025-2030 (%)
Chart on Regional Comparison - APAC
Data Table on Regional Comparison - APAC

12.3.1 China - Market size and forecast 2025-2030

Chart on China - Market size and forecast 2025-2030 ($ million)
Data Table on China - Market size and forecast 2025-2030 ($ million)
Chart on China - Year-over-year growth 2025-2030 (%)
Data Table on China - Year-over-year growth 2025-2030 (%)

12.3.2 Japan - Market size and forecast 2025-2030

Chart on Japan - Market size and forecast 2025-2030 ($ million)
Data Table on Japan - Market size and forecast 2025-2030 ($ million)
Chart on Japan - Year-over-year growth 2025-2030 (%)
Data Table on Japan - Year-over-year growth 2025-2030 (%)

12.3.3 India - Market size and forecast 2025-2030

Chart on India - Market size and forecast 2025-2030 ($ million)
Data Table on India - Market size and forecast 2025-2030 ($ million)
Chart on India - Year-over-year growth 2025-2030 (%)
Data Table on India - Year-over-year growth 2025-2030 (%)

12.3.4 South Korea - Market size and forecast 2025-2030

Chart on South Korea - Market size and forecast 2025-2030 ($ million)
Data Table on South Korea - Market size and forecast 2025-2030 ($ million)
Chart on South Korea - Year-over-year growth 2025-2030 (%)
Data Table on South Korea - Year-over-year growth 2025-2030 (%)

12.3.5 Australia - Market size and forecast 2025-2030

Chart on Australia - Market size and forecast 2025-2030 ($ million)
Data Table on Australia - Market size and forecast 2025-2030 ($ million)
Chart on Australia - Year-over-year growth 2025-2030 (%)
Data Table on Australia - Year-over-year growth 2025-2030 (%)

12.3.6 Indonesia - Market size and forecast 2025-2030

Chart on Indonesia - Market size and forecast 2025-2030 ($ million)
Data Table on Indonesia - Market size and forecast 2025-2030 ($ million)
Chart on Indonesia - Year-over-year growth 2025-2030 (%)
Data Table on Indonesia - Year-over-year growth 2025-2030 (%)

12.4 Europe - Market size and forecast 2025-2030

Chart on Europe - Market size and forecast 2025-2030 ($ million)
Data Table on Europe - Market size and forecast 2025-2030 ($ million)
Chart on Europe - Year-over-year growth 2025-2030 (%)
Data Table on Europe - Year-over-year growth 2025-2030 (%)
Chart on Regional Comparison - Europe
Data Table on Regional Comparison - Europe

12.4.1 Germany - Market size and forecast 2025-2030

Chart on Germany - Market size and forecast 2025-2030 ($ million)
Data Table on Germany - Market size and forecast 2025-2030 ($ million)
Chart on Germany - Year-over-year growth 2025-2030 (%)
Data Table on Germany - Year-over-year growth 2025-2030 (%)

12.4.2 UK - Market size and forecast 2025-2030

Chart on UK - Market size and forecast 2025-2030 ($ million)
Data Table on UK - Market size and forecast 2025-2030 ($ million)
Chart on UK - Year-over-year growth 2025-2030 (%)
Data Table on UK - Year-over-year growth 2025-2030 (%)

12.4.3 France - Market size and forecast 2025-2030

Chart on France - Market size and forecast 2025-2030 ($ million)
Data Table on France - Market size and forecast 2025-2030 ($ million)
Chart on France - Year-over-year growth 2025-2030 (%)
Data Table on France - Year-over-year growth 2025-2030 (%)

12.4.4 Italy - Market size and forecast 2025-2030

Chart on Italy - Market size and forecast 2025-2030 ($ million)
Data Table on Italy - Market size and forecast 2025-2030 ($ million)
Chart on Italy - Year-over-year growth 2025-2030 (%)
Data Table on Italy - Year-over-year growth 2025-2030 (%)

12.4.5 Spain - Market size and forecast 2025-2030

Chart on Spain - Market size and forecast 2025-2030 ($ million)
Data Table on Spain - Market size and forecast 2025-2030 ($ million)
Chart on Spain - Year-over-year growth 2025-2030 (%)
Data Table on Spain - Year-over-year growth 2025-2030 (%)

12.4.6 The Netherlands - Market size and forecast 2025-2030

Chart on The Netherlands - Market size and forecast 2025-2030 ($ million)
Data Table on The Netherlands - Market size and forecast 2025-2030 ($ million)
Chart on The Netherlands - Year-over-year growth 2025-2030 (%)
Data Table on The Netherlands - Year-over-year growth 2025-2030 (%)

12.5 Middle East and Africa - Market size and forecast 2025-2030

Chart on Middle East and Africa - Market size and forecast 2025-2030 ($ million)
Data Table on Middle East and Africa - Market size and forecast 2025-2030 ($ million)
Chart on Middle East and Africa - Year-over-year growth 2025-2030 (%)
Data Table on Middle East and Africa - Year-over-year growth 2025-2030 (%)
Chart on Regional Comparison - Middle East and Africa
Data Table on Regional Comparison - Middle East and Africa

12.5.1 Saudi Arabia - Market size and forecast 2025-2030

Chart on Saudi Arabia - Market size and forecast 2025-2030 ($ million)
Data Table on Saudi Arabia - Market size and forecast 2025-2030 ($ million)
Chart on Saudi Arabia - Year-over-year growth 2025-2030 (%)
Data Table on Saudi Arabia - Year-over-year growth 2025-2030 (%)

12.5.2 UAE - Market size and forecast 2025-2030

Chart on UAE - Market size and forecast 2025-2030 ($ million)
Data Table on UAE - Market size and forecast 2025-2030 ($ million)
Chart on UAE - Year-over-year growth 2025-2030 (%)
Data Table on UAE - Year-over-year growth 2025-2030 (%)

12.5.3 South Africa - Market size and forecast 2025-2030

Chart on South Africa - Market size and forecast 2025-2030 ($ million)
Data Table on South Africa - Market size and forecast 2025-2030 ($ million)
Chart on South Africa - Year-over-year growth 2025-2030 (%)
Data Table on South Africa - Year-over-year growth 2025-2030 (%)

12.5.4 Israel - Market size and forecast 2025-2030

Chart on Israel - Market size and forecast 2025-2030 ($ million)
Data Table on Israel - Market size and forecast 2025-2030 ($ million)
Chart on Israel - Year-over-year growth 2025-2030 (%)
Data Table on Israel - Year-over-year growth 2025-2030 (%)

12.5.5 Turkey - Market size and forecast 2025-2030

Chart on Turkey - Market size and forecast 2025-2030 ($ million)
Data Table on Turkey - Market size and forecast 2025-2030 ($ million)
Chart on Turkey - Year-over-year growth 2025-2030 (%)
Data Table on Turkey - Year-over-year growth 2025-2030 (%)

12.6 North America - Market size and forecast 2025-2030

Chart on North America - Market size and forecast 2025-2030 ($ million)
Data Table on North America - Market size and forecast 2025-2030 ($ million)
Chart on North America - Year-over-year growth 2025-2030 (%)
Data Table on North America - Year-over-year growth 2025-2030 (%)
Chart on Regional Comparison - North America
Data Table on Regional Comparison - North America

12.6.1 US - Market size and forecast 2025-2030

Chart on US - Market size and forecast 2025-2030 ($ million)
Data Table on US - Market size and forecast 2025-2030 ($ million)
Chart on US - Year-over-year growth 2025-2030 (%)
Data Table on US - Year-over-year growth 2025-2030 (%)

12.6.2 Canada - Market size and forecast 2025-2030

Chart on Canada - Market size and forecast 2025-2030 ($ million)
Data Table on Canada - Market size and forecast 2025-2030 ($ million)
Chart on Canada - Year-over-year growth 2025-2030 (%)
Data Table on Canada - Year-over-year growth 2025-2030 (%)

12.6.3 Mexico - Market size and forecast 2025-2030

Chart on Mexico - Market size and forecast 2025-2030 ($ million)
Data Table on Mexico - Market size and forecast 2025-2030 ($ million)
Chart on Mexico - Year-over-year growth 2025-2030 (%)
Data Table on Mexico - Year-over-year growth 2025-2030 (%)

12.7 South America - Market size and forecast 2025-2030

Chart on South America - Market size and forecast 2025-2030 ($ million)
Data Table on South America - Market size and forecast 2025-2030 ($ million)
Chart on South America - Year-over-year growth 2025-2030 (%)
Data Table on South America - Year-over-year growth 2025-2030 (%)
Chart on Regional Comparison - South America
Data Table on Regional Comparison - South America

12.7.1 Brazil - Market size and forecast 2025-2030

Chart on Brazil - Market size and forecast 2025-2030 ($ million)
Data Table on Brazil - Market size and forecast 2025-2030 ($ million)
Chart on Brazil - Year-over-year growth 2025-2030 (%)
Data Table on Brazil - Year-over-year growth 2025-2030 (%)

12.7.2 Argentina - Market size and forecast 2025-2030

Chart on Argentina - Market size and forecast 2025-2030 ($ million)
Data Table on Argentina - Market size and forecast 2025-2030 ($ million)
Chart on Argentina - Year-over-year growth 2025-2030 (%)
Data Table on Argentina - Year-over-year growth 2025-2030 (%)

12.7.3 Chile - Market size and forecast 2025-2030

Chart on Chile - Market size and forecast 2025-2030 ($ million)
Data Table on Chile - Market size and forecast 2025-2030 ($ million)
Chart on Chile - Year-over-year growth 2025-2030 (%)
Data Table on Chile - Year-over-year growth 2025-2030 (%)

12.8 Market opportunity by geography

Market opportunity by geography ($ million)
Data Tables on Market opportunity by geography ($ million)

13. Drivers, Challenges, and Opportunity

13.1 Market drivers

Rise in launch of new generation reach stackers
Rising seaborne trade across globe
Increasing demand for reach stacker from construction industry

13.2 Market challenges

Fluctuation in import and export levels of goods
Shortage of skilled labor
Growing environmental concerns and rising carbon dioxide emission

13.3 Impact of drivers and challenges

Impact of drivers and challenges in 2025 and 2030

13.4 Market opportunities

Growth of e-commerce industry resulting in market expedition
Rising demand for implementing JIT concept
Growing popularity of automation of reach stacker

14. Competitive Landscape

14.1 Overview

14.2

Overview on criticality of inputs and factors of differentiation

14.3 Landscape disruption

Overview on factors of disruption

14.4 Industry risks

Impact of key risks on business

15. Competitive Analysis

15.1 Companies profiled

Companies covered

15.2 Company ranking index

15.3 Market positioning of companies

Matrix on companies position and classification

15.4 Anhui Heli Co. Ltd.

Anhui Heli Co. Ltd. - Overview
Anhui Heli Co. Ltd. - Product / Service
Anhui Heli Co. Ltd. - Key offerings
SWOT

15.5 CVS Ferrari SpA

CVS Ferrari SpA - Overview
CVS Ferrari SpA - Product / Service
CVS Ferrari SpA - Key offerings
SWOT

15.6 Hangcha Group Co. Ltd.

Hangcha Group Co. Ltd. - Overview
Hangcha Group Co. Ltd. - Product / Service
Hangcha Group Co. Ltd. - Key offerings
SWOT

15.7 Hyster Yale Materials Handling

Hyster Yale Materials Handling - Overview
Hyster Yale Materials Handling - Business segments
Hyster Yale Materials Handling - Key offerings
Hyster Yale Materials Handling - Segment focus
SWOT

15.8 Kalmar Corp.

Kalmar Corp. - Overview
Kalmar Corp. - Product / Service
Kalmar Corp. - Key offerings
SWOT

15.9 Konecranes plc

Konecranes plc - Overview
Konecranes plc - Business segments
Konecranes plc - Key news
Konecranes plc - Key offerings
Konecranes plc - Segment focus
SWOT

15.10 Liebherr International AG

Liebherr International AG - Overview
Liebherr International AG - Product / Service
Liebherr International AG - Key offerings
SWOT

15.11 Liugong Machinery Co. Ltd.

Liugong Machinery Co. Ltd. - Overview
Liugong Machinery Co. Ltd. - Business segments
Liugong Machinery Co. Ltd. - Key offerings
Liugong Machinery Co. Ltd. - Segment focus
SWOT

15.12 Lonking Holdings Ltd.

Lonking Holdings Ltd. - Overview
Lonking Holdings Ltd. - Business segments
Lonking Holdings Ltd. - Key offerings
Lonking Holdings Ltd. - Segment focus
SWOT

15.13 Meclift Oy

Meclift Oy - Overview
Meclift Oy - Product / Service
Meclift Oy - Key offerings
SWOT

15.14 Sany Heavy Industry Co. Ltd.

Sany Heavy Industry Co. Ltd. - Overview
Sany Heavy Industry Co. Ltd. - Business segments
Sany Heavy Industry Co. Ltd. - Key offerings
Sany Heavy Industry Co. Ltd. - Segment focus
SWOT

15.15 Taylor Machine Works Inc.

Taylor Machine Works Inc. - Overview
Taylor Machine Works Inc. - Product / Service
Taylor Machine Works Inc. - Key offerings
SWOT

15.16 XCMG Group

XCMG Group - Overview
XCMG Group - Business segments
XCMG Group - Key offerings
XCMG Group - Segment focus
SWOT

15.17 Zhenhua Heavy Industries Co.

Zhenhua Heavy Industries Co. - Overview
Zhenhua Heavy Industries Co. - Business segments
Zhenhua Heavy Industries Co. - Key offerings
Zhenhua Heavy Industries Co. - Segment focus
SWOT

15.18 Zoomlion Industry Co. Ltd.

Zoomlion Industry Co. Ltd. - Overview
Zoomlion Industry Co. Ltd. - Business segments
Zoomlion Industry Co. Ltd. - Key offerings
Zoomlion Industry Co. Ltd. - Segment focus
SWOT

16. Appendix

16.1 Scope of the report

Market definition
Objectives
Notes and caveats

16.2 Inclusions and exclusions checklist

Inclusions checklist
Exclusions checklist

16.3 Currency conversion rates for US$

16.4 Research methodology

16.5 Data procurement

Information sources

16.6 Data validation

16.7 Validation techniques employed for market sizing

16.8 Data synthesis

16.9 360 degree market analysis

16.10 List of abbreviations

Research Methodology

Technavio presents a detailed picture of the market by way of study, synthesis, and summation of data from multiple sources. The analysts have presented the various facets of the market with a particular focus on identifying the key industry influencers. The data thus presented is comprehensive, reliable, and the result of extensive research, both primary and secondary.

INFORMATION SOURCES

Primary sources

  • Manufacturers and suppliers
  • Channel partners
  • Industry experts
  • Strategic decision makers

Secondary sources

  • Industry journals and periodicals
  • Government data
  • Financial reports of key industry players
  • Historical data
  • Press releases

DATA ANALYSIS

Data Synthesis

  • Collation of data
  • Estimation of key figures
  • Analysis of derived insights

Data Validation

  • Triangulation with data models
  • Reference against proprietary databases
  • Corroboration with industry experts

REPORT WRITING

Qualitative

  • Market drivers
  • Market challenges
  • Market trends
  • Five forces analysis

Quantitative

  • Market size and forecast
  • Market segmentation
  • Geographical insights
  • Competitive landscape

Interested in this report?

Get your sample now to see our research methodology and insights!

Download Now

Frequently Asked Questions

Reach Stacker market growth will increase by USD 326.5 million during 2026-2030.

The Reach Stacker market is expected to grow at a CAGR of 5.4% during 2026-2030.

Reach Stacker market is segmented by Type (IC engine, Electric and hybrid) Application (Sea port, Industrial) Capacity (Between 30 - 45 tons, Above 45 tons, Below 30 tons)

Anhui Heli Co. Ltd., CVS Ferrari SpA, Dalian Forklift Co. Ltd., Hangcha Group Co. Ltd., Hyster Yale Materials Handling, Kalmar Corp., KION Group AG, Konecranes plc, Liebherr International AG, Liugong Machinery Co. Ltd., Lonking Holdings Ltd., Meclift Oy, Sany Heavy Industry Co. Ltd., Svetruck AB, Taylor Machine Works Inc., Toyota Motor Corp., XCMG Group, Zhenhua Heavy Industries Co., Zoomlion Industry Co. Ltd. are a few of the key vendors in the Reach Stacker market.

APAC will register the highest growth rate of 50.3% among the other regions. Therefore, the Reach Stacker market in APAC is expected to garner significant business opportunities for the vendors during the forecast period.

China, Japan, India, South Korea, Australia, Indonesia, Germany, UK, France, Italy, Spain, The Netherlands, Saudi Arabia, UAE, South Africa, Israel, Turkey, US, Canada, Mexico, Brazil, Argentina, Chile

  • Rise in launch of new generation reach stackers is the driving factor this market.

The Reach Stacker market vendors should focus on grabbing business opportunities from the Type segment as it accounted for the largest market share in the base year.
RIA - Research AI Assistant
Ask RIA