Ready To Drink Cocktails Market Size 2026-2030
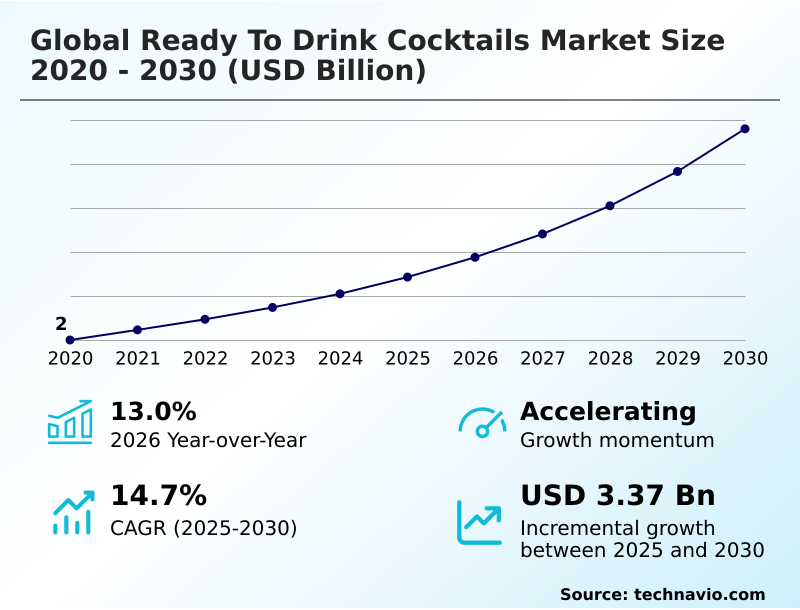
The ready to drink cocktails market size is valued to increase by USD 3.37 billion, at a CAGR of 14.7% from 2025 to 2030. Rising demand for convenience portability and ready to consume cocktail experiences will drive the ready to drink cocktails market.
Major Market Trends & Insights
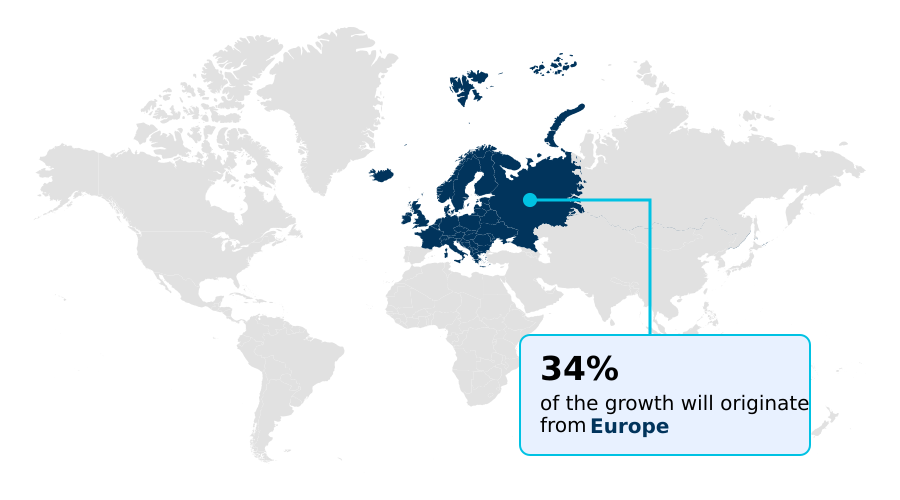
- Europe dominated the market and accounted for a 33.6% growth during the forecast period.
- By Distribution Channel - H and S segment was valued at USD 2.08 billion in 2024
- By Type - Spirit based segment accounted for the largest market revenue share in 2024
Market Size & Forecast
- Market Opportunities: USD 4.80 billion
- Market Future Opportunities: USD 3.37 billion
- CAGR from 2025 to 2030 : 14.7%
Market Summary
- The Ready To Drink Cocktails Market is undergoing a significant transformation, driven by consumer demand for convenience without compromising on quality. This evolution is marked by a strong trend toward premiumization, with an emphasis on high-quality spirits, authentic flavor profiles, and sophisticated packaging.
- As consumers increasingly seek out bar-quality experiences for at-home or on-the-go consumption, manufacturers are responding with innovative formulations, including low-sugar, low-calorie, and functional ingredient options. This shift is reshaping distribution strategies, with an expanding footprint in both online and traditional retail channels. However, the market's trajectory is moderated by a complex and often fragmented regulatory environment.
- For instance, a company launching a new spirit-based canned cocktail must navigate disparate state-level taxation and distribution laws, which can impact pricing strategy and market access, creating operational complexities compared to more uniformly regulated beverage categories.
- Success hinges on a brand's ability to innovate within these constraints while aligning with the modern consumer's lifestyle priorities of convenience, quality, and experiential consumption. The continuous introduction of new flavors and formats maintains a dynamic and competitive landscape, compelling brands to focus on differentiation and strong value propositions.
What will be the Size of the Ready To Drink Cocktails Market during the forecast period?
Get Key Insights on Market Forecast (PDF) Get Free Sample
How is the Ready To Drink Cocktails Market Segmented?
The ready to drink cocktails industry research report provides comprehensive data (region-wise segment analysis), with forecasts and estimates in "USD million" for the period 2026-2030, as well as historical data from 2020-2024 for the following segments.
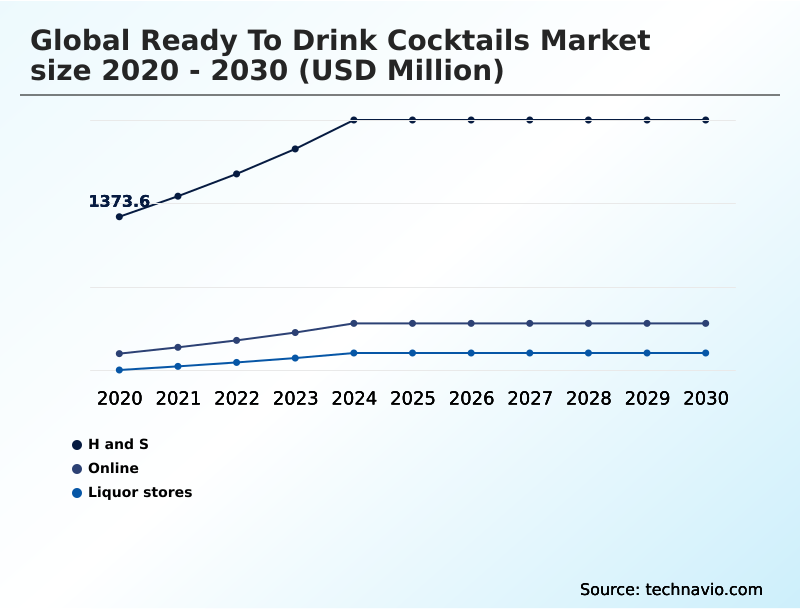
- Distribution channel
- H and S
- Online
- Liquor stores
- Type
- Spirit based
- Wine based
- Malt based
- Packaging
- Cans
- Bottles
- Others
- Geography
- North America
- US
- Canada
- Mexico
- Europe
- Germany
- UK
- France
- APAC
- China
- Japan
- India
- South America
- Brazil
- Argentina
- Middle East and Africa
- Saudi Arabia
- UAE
- South Africa
- Rest of World (ROW)
- North America
By Distribution Channel Insights
The h and s segment is estimated to witness significant growth during the forecast period.
The hypermarket and supermarket channel is pivotal for the distribution of pre-mixed alcoholic beverages, offering broad consumer access and significant sales volume.
This segment's strategy is evolving to feature more premium ready-to-drink options, reflecting a market shift where dedicated floor space for these products has increased by over 20% in major retail chains.
Retailers are curating selections that balance spirit-based formulations with malt-based alternatives to cater to diverse flavor profiles. The emphasis is on convenience through portable packaging, with canned cocktails and other formats designed for immediate consumption.
These outlets effectively showcase innovations in natural ingredients and product line extensions, from tequila-based canned cocktails to various vodka soda rtd options, driving both trial and repeat purchases in a competitive landscape.
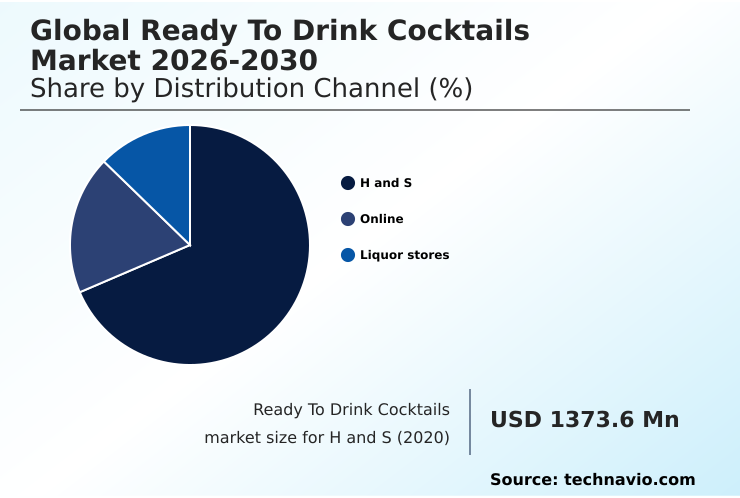
The H and S segment was valued at USD 2.08 billion in 2024 and showed a gradual increase during the forecast period.
Regional Analysis
Europe is estimated to contribute 33.6% to the growth of the global market during the forecast period.Technavio’s analysts have elaborately explained the regional trends and drivers that shape the market during the forecast period.
See How Ready To Drink Cocktails Market Demand is Rising in Europe Get Free Sample
The geographic landscape of the Ready To Drink Cocktails Market is diverse, with distinct regional dynamics shaping growth.
While North America remains a dominant market, Europe is projected to be the largest contributor to incremental growth, accounting for over 33% of the expansion.
This is driven by high consumer interest in bar-quality cocktails and portable beverage formats for social occasions. The European market's projected CAGR of 16% slightly outpaces North America's 13.3%, indicating strong momentum.
In APAC, rapid urbanization and rising disposable incomes are fueling demand for on-the-go cocktails and convenience-driven beverage choices, supporting a robust CAGR of 15.5%.
Effective cocktail ingredient sourcing and the development of shelf-stable cocktails are critical for penetrating these varied regions. The focus is on creating ready-to-drink formulations that cater to local tastes while maintaining consistent quality.
Market Dynamics
Our researchers analyzed the data with 2025 as the base year, along with the key drivers, trends, and challenges. A holistic analysis of drivers will help companies refine their marketing strategies to gain a competitive advantage.
- A deeper analysis of the Ready To Drink Cocktails Market reveals several nuanced growth corridors beyond mainstream trends. The future of rtd cocktail flavors is moving toward more complex and artisanal profiles, a domain where craft distillery impact on rtd market is increasingly significant. This shift challenges established players to innovate beyond standard offerings.
- An essential question for consumers is how to choose a spirit-based rtd, with factors like the impact of abv on rtd cocktail quality becoming key differentiators. The discussion of premium vs value rtd cocktails is also evolving; while value options drive volume, premium products with natural ingredients in ready to drink cocktails are commanding greater loyalty and higher margins.
- Concurrently, rtd cocktail packaging sustainability analysis is a major factor influencing purchasing decisions, with innovations in rtd cocktail cans and materials gaining traction. In comparing malt-based vs spirit-based rtds, spirit-based products are increasingly preferred for their authentic taste. The growth of tequila-based rtds exemplifies this trend.
- From a logistical standpoint, the shelf life of canned cocktails and the complex regulations for selling rtd cocktails online present both opportunities and hurdles. The convenience of at-home cocktail mixing vs rtds continues to be debated, though data shows RTDs reduce ingredient waste by over 40%.
- The consumer perception of canned wine is also improving, benefiting the broader category of rtd cocktails for outdoor events. Finally, effective marketing strategies for rtd cocktails are leveraging the role of e-commerce in rtd sales to reach new demographics, reinforcing premiumization trends in the rtd sector and ensuring a robust supply chain for rtd ingredients.
What are the key market drivers leading to the rise in the adoption of Ready To Drink Cocktails Industry?
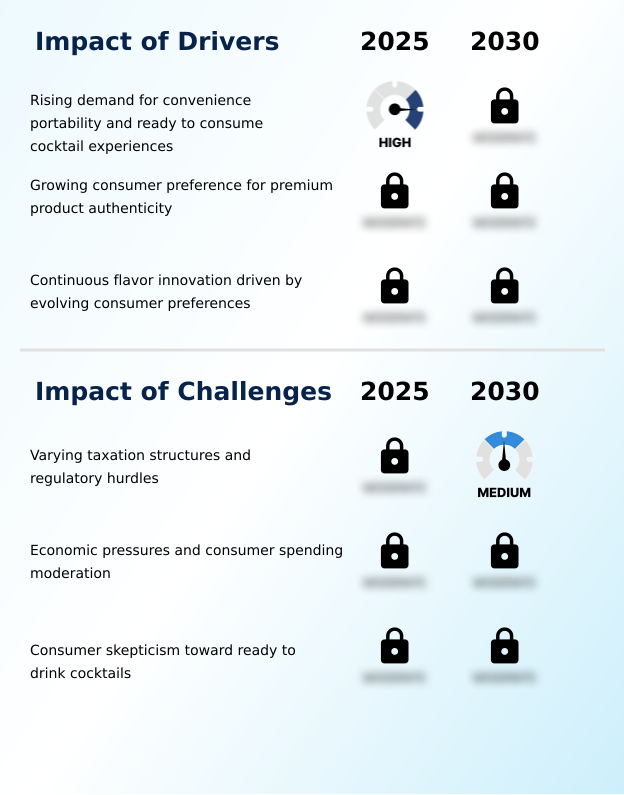
- The rising demand for convenience, portability, and ready-to-consume cocktail experiences is a key driver propelling market expansion.
- The primary market driver is the unparalleled convenience offered by ready-to-serve cocktails, which eliminate the need for traditional cocktail mixology. This factor resonates strongly with modern consumer lifestyles, reducing beverage preparation time by over 95% compared to manual methods.
- The expansion of product formats, including portable glass bottle format and cans, has broadened consumption occasions from at-home gatherings to outdoor events.
- Innovations in flavor, such as the rising popularity of espresso martini in a can and margarita in a can, keep the category dynamic. As the hard seltzer vs rtd cocktail landscape evolves, differentiation through quality and authenticity is key.
- Brands leveraging unique rtd cocktail packaging innovations report an 18% lift in initial consumer trial rates. The influence of craft distilleries has also been significant, introducing higher-quality premixed cocktail solutions and accelerating trends in beverage canning and beverage bottling.
What are the market trends shaping the Ready To Drink Cocktails Industry?
- The market is increasingly defined by an emphasis on premium spirit-based formulations. This reflects a broader consumer shift toward elevated quality and sophisticated taste profiles.
- A significant trend shaping the market is the dual focus on premiumization and wellness. Consumers are increasingly selecting products made with premium spirits and natural, high-quality ingredients, with nearly 60% of new launches falling into this category. This has led to a rise in artisanal production from both established brands and craft rtd cocktail brands.
- The demand for healthier options is evident in the proliferation of low-sugar content formulations and variants with a lower alcohol by volume (ABV), which demonstrate adoption rates 20% faster than standard versions. Sustainable packaging is another critical trend, with a notable shift toward recyclable slim cans and lightweight glass.
- Offerings like whiskey-based rtd, rum-based canned drinks, and sophisticated gin and tonic in a can are expanding, alongside non-alcoholic rtd cocktails and wine spritzer cans, catering to a wider range of consumer preferences.
What challenges does the Ready To Drink Cocktails Industry face during its growth?
- Varying taxation structures and regulatory hurdles present a key challenge that affects uniform industry growth across different regions.
- Navigating the complex and fragmented regulatory environment remains a primary challenge. Disparate taxation on spirit-based rtds can increase final retail prices by up to 30% compared to malt-based rtd alternatives in certain jurisdictions, creating significant pricing hurdles. This rtd cocktail regulatory landscape often increases compliance costs by 15% for companies operating across multiple regions.
- These inconsistencies complicate rtd cocktail distribution channels, restricting access to market for spirit-based canned spirits and wine-based rtd products. The logistical and legal complexities associated with the growth of online sales of rtd cocktails further compound these issues.
- As a result, companies must invest significant resources to manage compliance for single-serve cocktails and other formats, such as paloma in a can or mojito in a can, which can slow market entry and impact profitability.
Exclusive Technavio Analysis on Customer Landscape
The ready to drink cocktails market forecasting report includes the adoption lifecycle of the market, covering from the innovator’s stage to the laggard’s stage. It focuses on adoption rates in different regions based on penetration. Furthermore, the ready to drink cocktails market report also includes key purchase criteria and drivers of price sensitivity to help companies evaluate and develop their market growth analysis strategies.
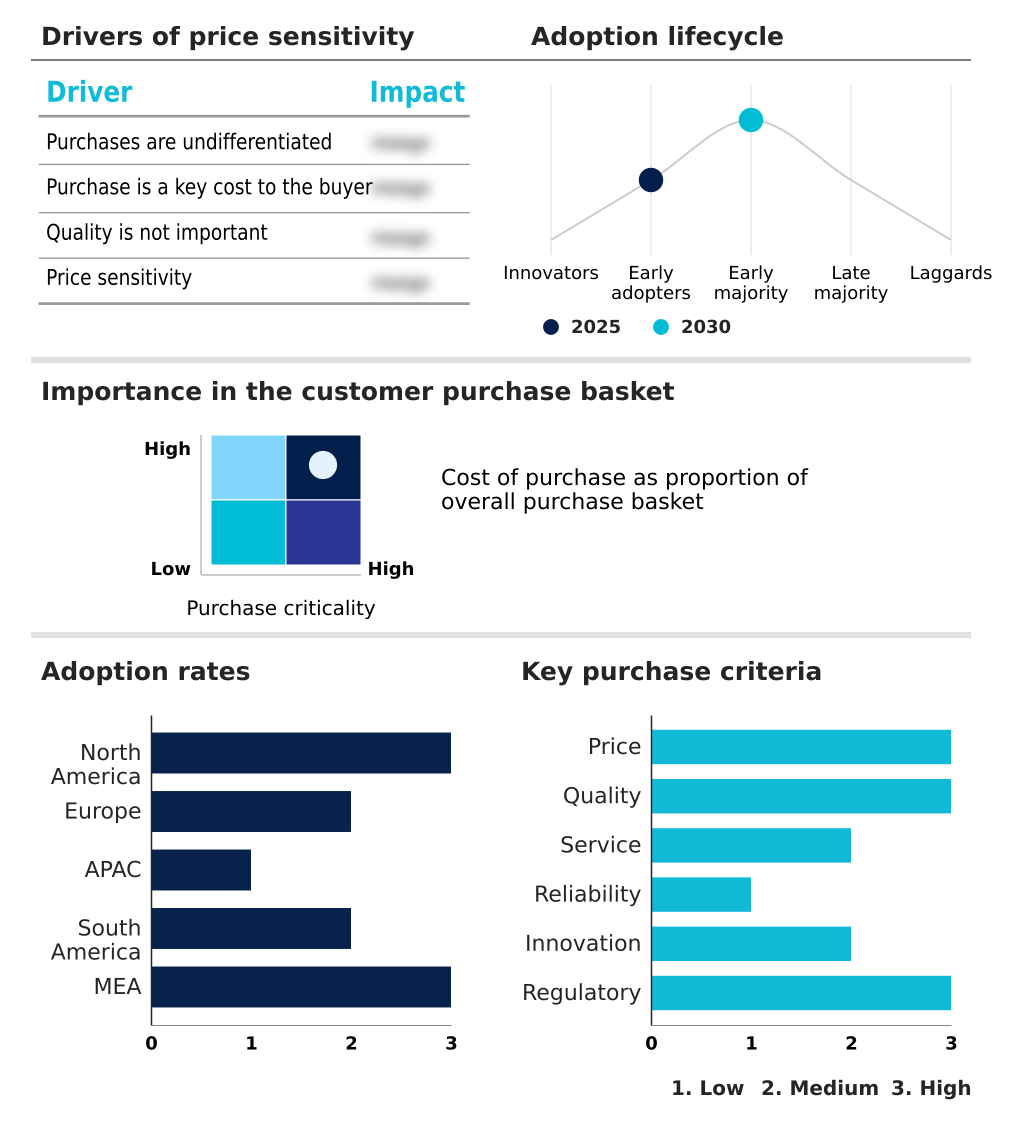
Customer Landscape of Ready To Drink Cocktails Industry
Competitive Landscape
Companies are implementing various strategies, such as strategic alliances, ready to drink cocktails market forecast, partnerships, mergers and acquisitions, geographical expansion, and product/service launches, to enhance their presence in the industry.
Asahi Group Holdings Ltd. - Offers a diverse portfolio of ready-to-drink cocktails, including signature fruit-infused and premium shibori-style beverages designed for sophisticated consumer tastes.
The industry research and growth report includes detailed analyses of the competitive landscape of the market and information about key companies, including:
- Asahi Group Holdings Ltd.
- Brown Forman Corp.
- Caddy Cocktails
- Campari Group
- Crook and Marker LLC
- Cutwater Spirits LLC
- Hard Rock Hard Seltzer
- House of Delola LLC
- House of Monaco
- Lucas Bols
- Manchester Drinks Ltd.
- Manly Spirits Co.
- Molson Coors Beverage Co.
- Suntory Holdings Ltd
- Tequila Cazadores
- The Boston Beer Co. Inc.
- VOSA SPIRITS LLC
Qualitative and quantitative analysis of companies has been conducted to help clients understand the wider business environment as well as the strengths and weaknesses of key industry players. Data is qualitatively analyzed to categorize companies as pure play, category-focused, industry-focused, and diversified; it is quantitatively analyzed to categorize companies as dominant, leading, strong, tentative, and weak.
Recent Development and News in Ready to drink cocktails market
- In September, 2024, The Coca-Cola Co. and Bacardi Limited announced a strategic partnership to launch Bacardi Mixed with Coca-Cola as a ready-to-drink cocktail, targeting select European markets and Mexico for a 2025 release.
- In February, 2025, Pernod Ricard USA expanded its Absolut ready-to-drink portfolio with the launch of Espresso Martini and Classic Cosmopolitan flavors, featuring higher alcohol by volume (ABV) levels, alongside extensions to its Absolut Ocean Spray line.
- In March, 2025, Campari Group introduced a premium pre-mixed Negroni in a glass bottle format, specifically targeting the at-home entertainment market with a sophisticated, ready-to-serve offering.
- In May, 2025, William Grant and Sons entered the Australian market with a new line of gin-based ready-to-drink cocktails, capitalizing on the region's high consumption rates and preference for gin.
Dive into Technavio’s robust research methodology, blending expert interviews, extensive data synthesis, and validated models for unparalleled Ready To Drink Cocktails Market insights. See full methodology.
| Market Scope | |
|---|---|
| Page number | 287 |
| Base year | 2025 |
| Historic period | 2020-2024 |
| Forecast period | 2026-2030 |
| Growth momentum & CAGR | Accelerate at a CAGR of 14.7% |
| Market growth 2026-2030 | USD 3373.8 million |
| Market structure | Fragmented |
| YoY growth 2025-2026(%) | 13.0% |
| Key countries | US, Canada, Mexico, Germany, UK, France, Italy, Spain, The Netherlands, China, Japan, India, South Korea, Australia, Indonesia, Brazil, Argentina, Chile, Saudi Arabia, UAE, South Africa, Israel and Turkey |
| Competitive landscape | Leading Companies, Market Positioning of Companies, Competitive Strategies, and Industry Risks |
Research Analyst Overview
- The Ready To Drink Cocktails Market is characterized by rapid innovation in product development and packaging. Key differentiators include spirit-based formulations that deliver bar-quality cocktails and the use of natural ingredients to create sophisticated flavor profiles. The shift toward portable packaging, such as slim cans and convenient glass bottle formats, caters to demand for on-the-go cocktails.
- While large-scale canning facility operations focus on mainstream canned cocktails, a growing number of craft distilleries are driving artisanal production, offering unique premixed cocktail solutions. The industry is diversifying beyond traditional spirit-based rtds to include wine-based rtd and refined malt-based alternatives. A critical boardroom consideration is investment in sustainable packaging, as it directly impacts brand perception.
- Operationally, advancements in beverage canning and beverage bottling, including the adoption of aseptic packaging and optimized cocktail canning lines, are essential for creating shelf-stable cocktails. For instance, automated systems can improve production efficiency by nearly 25%.
- Success hinges on mastering cocktail mixology at scale, ensuring consistent cocktail carbonation levels, and securing a resilient supply chain for cocktail ingredient sourcing across all ready-to-drink formulations, including single-serve cocktails and ready-to-serve cocktails.
What are the Key Data Covered in this Ready To Drink Cocktails Market Research and Growth Report?
-
What is the expected growth of the Ready To Drink Cocktails Market between 2026 and 2030?
-
USD 3.37 billion, at a CAGR of 14.7%
-
-
What segmentation does the market report cover?
-
The report is segmented by Distribution Channel (H and S, Online, and Liquor stores), Type (Spirit based, Wine based, and Malt based), Packaging (Cans, Bottles, and Others) and Geography (North America, Europe, APAC, South America, Middle East and Africa)
-
-
Which regions are analyzed in the report?
-
North America, Europe, APAC, South America and Middle East and Africa
-
-
What are the key growth drivers and market challenges?
-
Rising demand for convenience portability and ready to consume cocktail experiences, Varying taxation structures and regulatory hurdles
-
-
Who are the major players in the Ready To Drink Cocktails Market?
-
Asahi Group Holdings Ltd., Brown Forman Corp., Caddy Cocktails, Campari Group, Crook and Marker LLC, Cutwater Spirits LLC, Hard Rock Hard Seltzer, House of Delola LLC, House of Monaco, Lucas Bols, Manchester Drinks Ltd., Manly Spirits Co., Molson Coors Beverage Co., Suntory Holdings Ltd, Tequila Cazadores, The Boston Beer Co. Inc. and VOSA SPIRITS LLC
-
Market Research Insights
- The market's dynamic is shaped by intense competition and evolving consumer preferences, where brand differentiation is key. The rise of at-home cocktail consumption has boosted demand, with companies that effectively market convenience-driven beverage choices seeing a 15% higher rate of customer acquisition.
- As the hard seltzer vs rtd cocktail debate continues, spirit-based options are gaining ground, particularly among millennial rtd consumption patterns. This trend is amplified by effective social media marketing and the growth of cocktail subscription services, which build loyalty and provide valuable consumer data.
- Strategic partnerships and a focus on premium ready-to-drink options are critical, as these offerings command up to a 20% price premium over standard alternatives. Furthermore, the expansion of rtd cocktail distribution channels has been a significant factor, enabling broader market penetration and accessibility for consumers.
We can help! Our analysts can customize this ready to drink cocktails market research report to meet your requirements.
 RIA -
RIA - 
