Rechargeable Batteries Market Analysis, Size, and Forecast 2026-2030: APAC (China, Japan, and India), North America (US, Canada, and Mexico), Europe (Germany, UK, and France), Middle East and Africa (Saudi Arabia, UAE, and South Africa), South America (Brazil, Argentina, and Colombia), and Rest of World (ROW)

Rechargeable Batteries Market Analysis, Size, and Forecast 2026-2030:
APAC (China, Japan, and India), North America (US, Canada, and Mexico), Europe (Germany, UK, and France), Middle East and Africa (Saudi Arabia, UAE, and South Africa), South America (Brazil, Argentina, and Colombia), and Rest of World (ROW)

Published: Apr 2026 306 Pages SKU: IRTNTR81417

Market Overview at a Glance

$110.23 B
Market Opportunity
12.5%
CAGR 2025 - 2030
47.1%
APAC Growth
$72.82 B
Lithium ion batteries segment 2024

Rechargeable Batteries Market Size 2026-2030

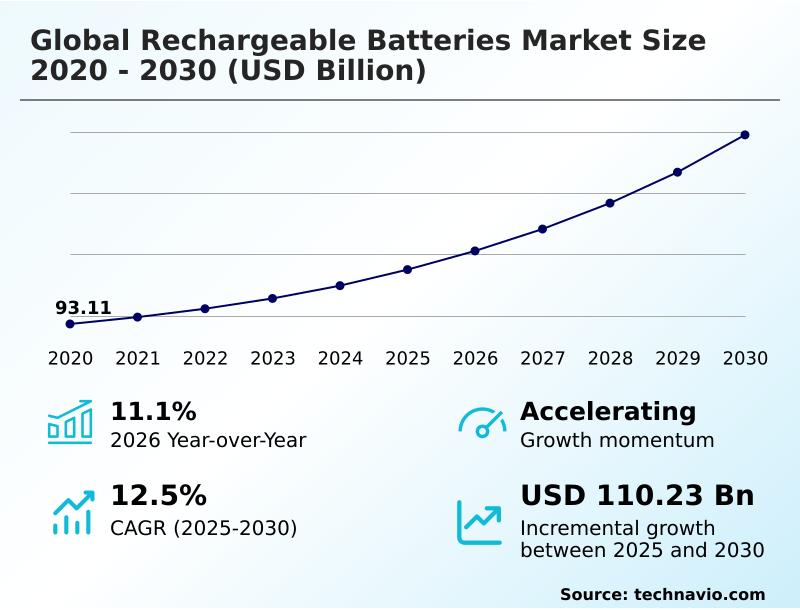
The rechargeable batteries market size is valued to increase by USD 110.23 billion, at a CAGR of 12.5% from 2025 to 2030. Rapid expansion of electric vehicle sector across major regions will drive the rechargeable batteries market.

Major Market Trends & Insights

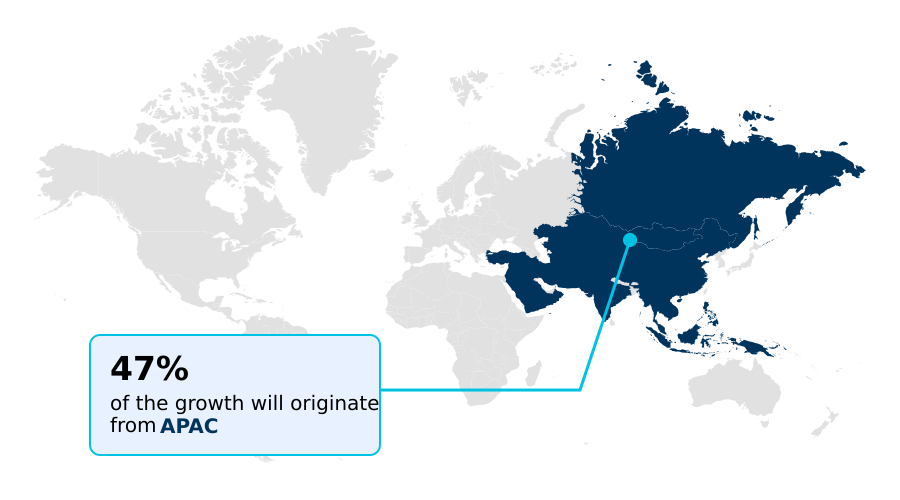
  • APAC dominated the market and accounted for a 47.1% growth during the forecast period.
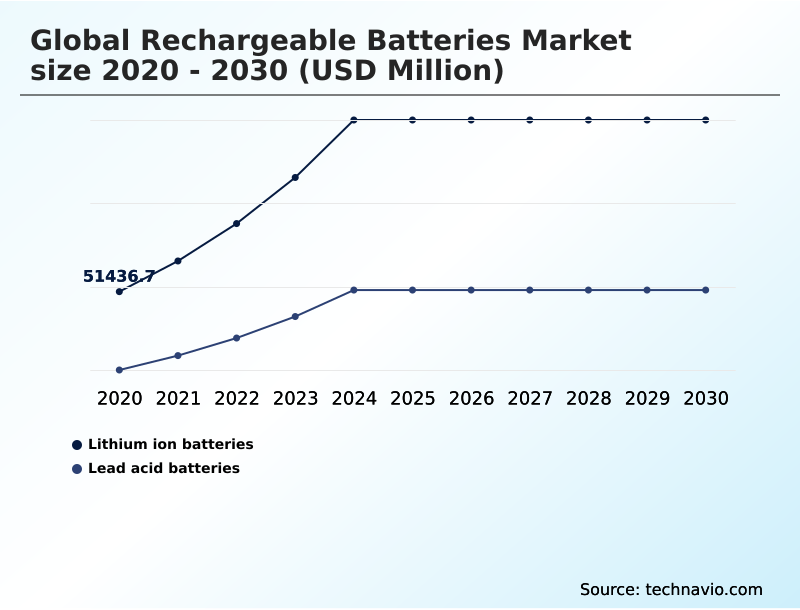
  • By Type - Lithium ion batteries segment was valued at USD 72.82 billion in 2024
  • By End-user - Automotive segment accounted for the largest market revenue share in 2024

Market Size & Forecast

  • Market Opportunities: USD 154.71 billion
  • Market Future Opportunities: USD 110.23 billion
  • CAGR from 2025 to 2030 : 12.5%

Market Summary

  • The rechargeable batteries market is undergoing robust expansion, driven by the global shift toward sustainable energy and the electrification of transportation. This transition is underpinned by advancements in material science, which are enhancing energy density, reducing charging times, and improving thermal stability in advanced battery technologies.
  • The integration of intermittent renewable energy sources like solar and wind into national grids necessitates large-scale energy storage systems to ensure power reliability. For instance, a utility operator facing grid instability from fluctuating solar output can deploy a grid-scale battery system to store excess energy and discharge it during peak demand, deferring costly infrastructure upgrades.
  • Concurrently, supply chain optimizations and economies of scale are making electric vehicles and residential energy storage more accessible. Stakeholders are heavily investing in R&D to explore alternative chemistries, mitigating reliance on scarce raw materials and securing supply chains against geopolitical volatility.

What will be the Size of the Rechargeable Batteries Market during the forecast period?

Get Key Insights on Market Forecast (PDF) Request Free Sample

How is the Rechargeable Batteries Market Segmented?

The rechargeable batteries industry research report provides comprehensive data (region-wise segment analysis), with forecasts and estimates in "USD million" for the period 2026-2030, as well as historical data from 2020-2024 for the following segments.

  • Type
    • Lithium ion batteries
    • Lead acid batteries
  • End-user
    • Automotive
    • Utilities
    • Commercial
    • Residential
  • Application
    • Electric vehicles
    • Consumer electronics
    • Energy storage systems
    • Industrial equipment
  • Geography
    • APAC
      • China
      • Japan
      • India
    • North America
      • US
      • Canada
      • Mexico
    • Europe
      • Germany
      • UK
      • France
    • Middle East and Africa
      • Saudi Arabia
      • UAE
      • South Africa
    • South America
      • Brazil
      • Argentina
      • Colombia
    • Rest of World (ROW)

By Type Insights

The lithium ion batteries segment is estimated to witness significant growth during the forecast period.

The rechargeable batteries market is segmented by type, end-user, and geography, with lithium-ion technologies holding a commanding share.

The evolution of this segment is marked by consistent architectural refinements in both prismatic cells and cylindrical cells, driven by demand from automotive battery manufacturers for high capacity battery packs. While lithium-based alternatives are dominant, development continues in legacy technologies.

For example, advancements in valve regulated designs and the use of carbon additives are extending the viability of lead-acid systems and improving deep cycle battery performance in specific industrial applications.

As the industry matures, focus intensifies on the full lifecycle, with modern recovery processes reclaiming over 90% of valuable metals from these rechargeable power sources, bolstering supply chain sustainability.

Request Free Sample

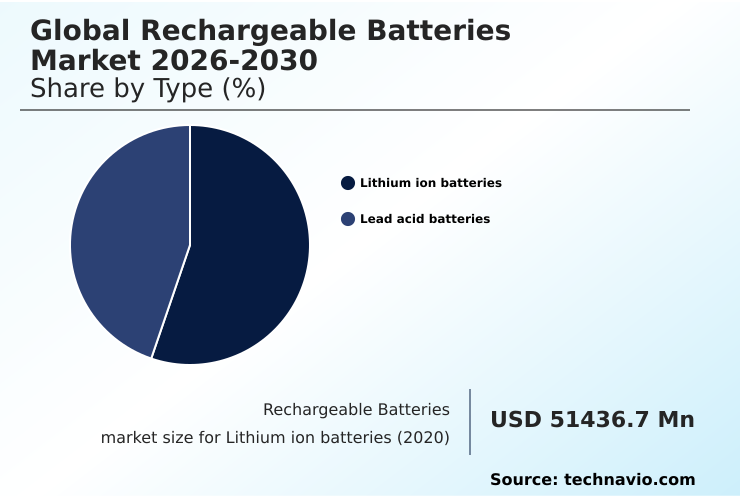
The Lithium ion batteries segment was valued at USD 72.82 billion in 2024 and showed a gradual increase during the forecast period.

Request Free Sample

Regional Analysis

APAC is estimated to contribute 47.1% to the growth of the global market during the forecast period.Technavio’s analysts have elaborately explained the regional trends and drivers that shape the market during the forecast period.

See How Rechargeable Batteries Market Demand is Rising in APAC Request Free Sample

The geographic landscape of the rechargeable batteries market is dominated by the APAC region, which accounts for 47.1% of incremental growth and exhibits an expansion rate of over 13%.

This supremacy is built on extensive manufacturing capabilities and control over material processing, particularly for lithium iron phosphate technology.

In contrast, North America and Europe are focused on localizing supply chains by investing heavily in domestic energy storage infrastructure and R&D. These regions are pioneering advanced nanomaterials and sophisticated cathode architectures to enhance performance.

The development of robust thermal management architectures is a key focus globally to ensure reliability in diverse climates, supported by intelligent battery management systems.

This regional specialization fosters a competitive environment where innovations in utility-scale energy storage and other distributed energy resources are rapidly commercialized.

Market Dynamics

Our researchers analyzed the data with 2025 as the base year, along with the key drivers, trends, and challenges. A holistic analysis of drivers will help companies refine their marketing strategies to gain a competitive advantage.

  • The global rechargeable batteries market is at a pivotal juncture, defined by complex technical and economic factors.
  • A key consideration for stakeholders is the ongoing debate between lithium ion vs lead acid batteries, where Li-ion dominates in energy density for applications like rechargeable batteries for electric vehicles and rechargeable batteries in consumer electronics, while lead-acid maintains a foothold in specific industrial niches due to lower costs.
  • The cost of rechargeable battery manufacturing remains a central issue, directly influenced by the volatile supply chain for battery raw materials, particularly the impact of cobalt on battery prices.
  • To mitigate this, significant investment trends in battery technology are focused on advancements in battery energy density and the future of rechargeable battery chemistry, including the push toward solid state battery technology advantages and sodium ion battery commercialization status. Concurrently, the environmental impact of battery disposal is driving regulatory policies for battery recycling.
  • Innovations in battery recycling and material recovery are crucial for a sustainable ecosystem. For grid stability, energy storage for renewable integration through grid scale battery storage projects and the role of batteries in smart grids are expanding rapidly.
  • Safety standards for lithium batteries are becoming more stringent, necessitating sophisticated thermal management in battery packs, while lead acid battery maintenance practices continue to evolve for legacy systems.

What are the key market drivers leading to the rise in the adoption of Rechargeable Batteries Industry?

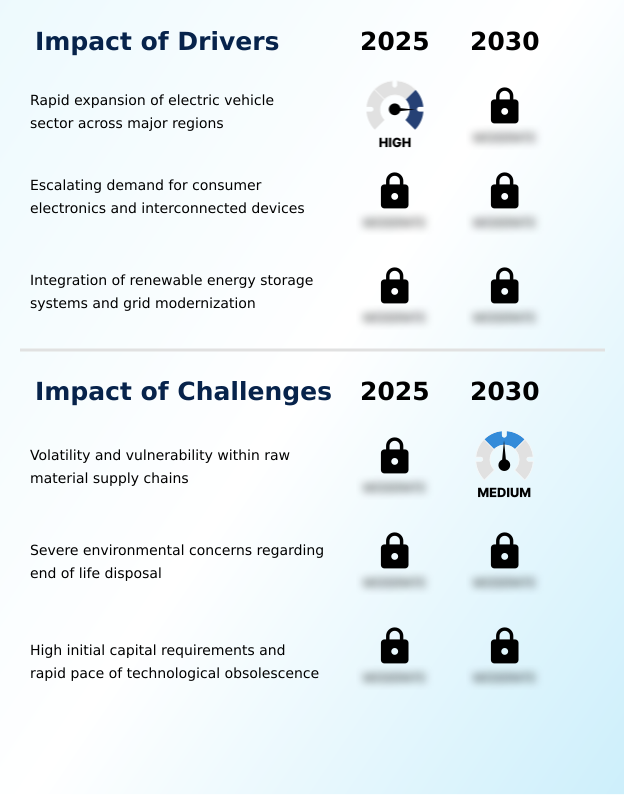
  • The rapid expansion of the electric vehicle sector across key global regions serves as a primary driver for the rechargeable batteries market.

  • Market growth is propelled by three core drivers transforming energy consumption. The global transition to electric mobility solutions is creating massive demand, accelerating R&D into high-nickel cathode chemistries and solid state technologies to improve range and performance.
  • Secondly, the integration of renewables necessitates both grid scale energy storage and distributed home energy storage solutions to manage intermittency, with regions like APAC contributing 47.1% of the market's incremental growth.
  • These systems are critical for smart grid integration, helping to reduce the 8-10% of electricity typically lost in transmission.
  • Thirdly, the consumer electronics sector provides constant demand for compact power sources like lithium primary batteries, alongside traditional lead acid storage batteries and specialized energy storage batteries for various applications, all supported by an expanding network of electric vehicle charging stations.

What are the market trends shaping the Rechargeable Batteries Industry?

  • A primary market trend is the accelerated adoption of solid-state and alternative chemistry architectures. This is driven by the industry's pursuit of higher energy density, improved safety, and longer operational lifespans.

  • Key market trends are reshaping the competitive landscape, driven by the pursuit of performance and sustainability. The accelerated adoption of solid-state architectures and alternative chemistry architectures, including promising sodium-ion compositions, is a direct response to the need for advanced battery technologies with higher gravimetric energy density. This is particularly critical for specialized aerospace applications and next-generation mobile energy storage.
  • Innovations are delivering tangible benefits, with some new designs offering up to three times faster charging. Concurrently, the institutionalization of circular economy principles is gaining momentum, with recovery rates for lithium-ion coin cells and other formats now exceeding 90%.
  • This shift supports sustainability goals and creates more resilient supply chains, influencing everything from large-scale deployments to niche applications like battery swapping technology.

What challenges does the Rechargeable Batteries Industry face during its growth?

  • Volatility and vulnerability within the raw material supply chains present a significant challenge affecting the growth and stability of the rechargeable batteries industry.

  • The market faces significant structural challenges that temper its growth trajectory. The extreme volatility of raw material supply chains, stemming from the geographic concentration of brine-based lithium reserves and laterite nickel ores, creates profound uncertainty. Securing these materials often requires complex processing methods like high pressure acid leach.
  • A second major hurdle is the environmental concern surrounding end-of-life processing, which necessitates sophisticated hydrometallurgical extraction and pyrometallurgical extraction techniques to manage hazardous waste effectively. Finally, the high initial capital required to establish manufacturing facilities, with costs often exceeding a billion dollars, presents a formidable barrier to entry.
  • This investment risk is compounded by the rapid pace of technological obsolescence, where today's industrial power units could be outdated by next-generation innovations.

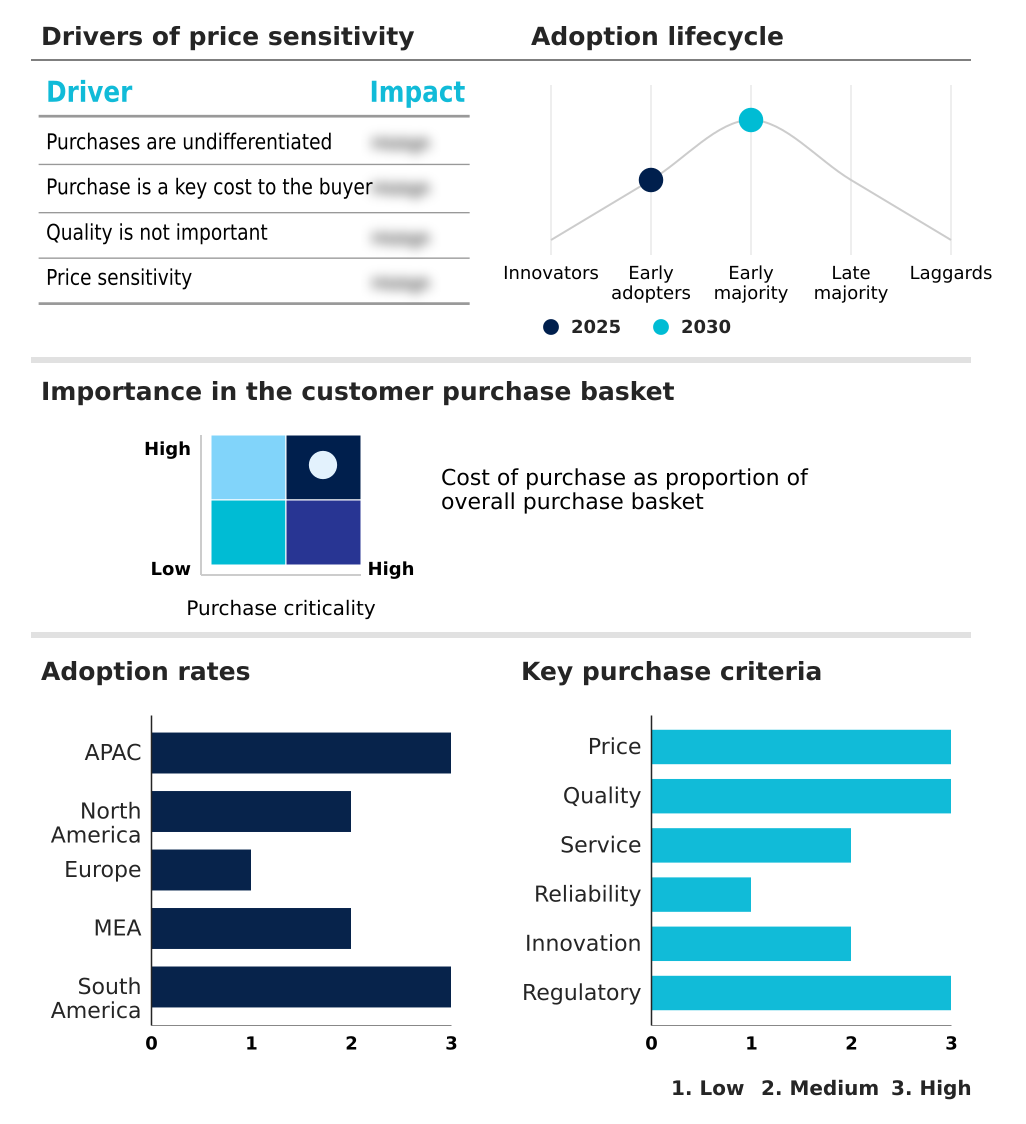
Exclusive Technavio Analysis on Customer Landscape

The rechargeable batteries market forecasting report includes the adoption lifecycle of the market, covering from the innovator’s stage to the laggard’s stage. It focuses on adoption rates in different regions based on penetration. Furthermore, the rechargeable batteries market report also includes key purchase criteria and drivers of price sensitivity to help companies evaluate and develop their market growth analysis strategies.

Customer Landscape of Rechargeable Batteries Industry

Competitive Landscape

Companies are implementing various strategies, such as strategic alliances, rechargeable batteries market forecast, partnerships, mergers and acquisitions, geographical expansion, and product/service launches, to enhance their presence in the industry.

BYD Co. Ltd. - The company provides advanced rechargeable batteries for electric vehicles and electronics, leveraging proprietary lithium iron phosphate technology for enhanced performance and safety.

The industry research and growth report includes detailed analyses of the competitive landscape of the market and information about key companies, including:

  • BYD Co. Ltd.
  • CLARIOS LLC
  • Contemporary Amperex Ltd.
  • East Penn Manufacture Co. Inc.
  • Energizer Holdings Inc.
  • EnerSys
  • EVE Energy Co. Ltd.
  • Exide Industries Ltd.
  • Gotion Inc.
  • GS Yuasa International Ltd.
  • LG Energy Solution Ltd.
  • Microvast Holdings Inc.
  • Murata Manufacturing Co. Ltd.
  • Northvolt AB
  • Panasonic Holdings Corp.
  • Samsung SDI Co. Ltd.
  • Sunwoda Electronic Co. Ltd.
  • The Duracell Co.
  • VARTA AG

Qualitative and quantitative analysis of companies has been conducted to help clients understand the wider business environment as well as the strengths and weaknesses of key industry players. Data is qualitatively analyzed to categorize companies as pure play, category-focused, industry-focused, and diversified; it is quantitatively analyzed to categorize companies as dominant, leading, strong, tentative, and weak.

Recent Development and News in Rechargeable batteries market

  • In March, 2025, Rio Tinto finalized its acquisition of Arcadium Lithium in a transaction valued at approximately $6.7 billion, aimed at securing critical raw materials for lithium-ion battery production.
  • In July, 2025, Neuron Energy launched its Gen 2 lithium-ion battery packs, specifically developed to support the expanding electric vehicle ecosystem in India.
  • In October, 2025, Chery Automobile presented a prototype all-solid-state battery module, a product of its internal Solid-State Battery Research Institute, at the Global Innovation Conference.
  • In October, 2025, Sumitomo Metal Mining Co., Ltd. and Toyota Motor Corporation entered into a joint development agreement focused on establishing large-scale production of cathode materials for all-solid-state batteries for BEVs.

Dive into Technavio’s robust research methodology, blending expert interviews, extensive data synthesis, and validated models for unparalleled Rechargeable Batteries Market insights. See full methodology.

Market Scope
Page number 306
Base year 2025
Historic period 2020-2024
Forecast period 2026-2030
Growth momentum & CAGR Accelerate at a CAGR of 12.5%
Market growth 2026-2030 USD 110232.4 million
Market structure Fragmented
YoY growth 2025-2026(%) 11.1%
Key countries China, Japan, India, South Korea, Australia, Indonesia, US, Canada, Mexico, Germany, UK, France, Italy, Spain, The Netherlands, Saudi Arabia, UAE, South Africa, Turkey, Israel, Brazil, Argentina and Colombia
Competitive landscape Leading Companies, Market Positioning of Companies, Competitive Strategies, and Industry Risks

Request Free Sample

Research Analyst Overview

  • The rechargeable batteries market is defined by a strategic push toward technological sovereignty and supply chain resilience. Boardroom decisions are increasingly centered on mitigating the risks associated with raw material volatility by investing in advanced processing capabilities.
  • Innovations in hydrometallurgical extraction and pyrometallurgical extraction techniques, which enable the recovery of over 90% of valuable metals from depleted cells, are becoming critical components of corporate strategy. The development of alternative chemistry architectures, including sodium-ion compositions and zinc-based compositions, provides a pathway to reduce dependence on geographically concentrated brine-based lithium reserves and laterite nickel ores.
  • Manufacturers are refining cathode architectures and integrating advanced nanomaterials to boost performance. At the same time, the pursuit of superior gravimetric energy density is essential for specialized aerospace applications, demanding sophisticated thermal management architectures. This focus on high-value applications, coupled with the establishment of robust circular economy principles, is shaping a highly competitive and technologically advanced industrial landscape.

What are the Key Data Covered in this Rechargeable Batteries Market Research and Growth Report?

  • What is the expected growth of the Rechargeable Batteries Market between 2026 and 2030?

    • USD 110.23 billion, at a CAGR of 12.5%

  • What segmentation does the market report cover?

    • The report is segmented by Type (Lithium ion batteries, and Lead acid batteries), End-user (Automotive, Utilities, Commercial, and Residential), Application (Electric vehicles, Consumer electronics, Energy storage systems, and Industrial equipment) and Geography (APAC, North America, Europe, Middle East and Africa, South America)

  • Which regions are analyzed in the report?

    • APAC, North America, Europe, Middle East and Africa and South America

  • What are the key growth drivers and market challenges?

    • Rapid expansion of electric vehicle sector across major regions , Volatility and vulnerability within raw material supply chains

  • Who are the major players in the Rechargeable Batteries Market?

    • BYD Co. Ltd., CLARIOS LLC, Contemporary Amperex Ltd., East Penn Manufacture Co. Inc., Energizer Holdings Inc., EnerSys, EVE Energy Co. Ltd., Exide Industries Ltd., Gotion Inc., GS Yuasa International Ltd., LG Energy Solution Ltd., Microvast Holdings Inc., Murata Manufacturing Co. Ltd., Northvolt AB, Panasonic Holdings Corp., Samsung SDI Co. Ltd., Sunwoda Electronic Co. Ltd., The Duracell Co. and VARTA AG

Market Research Insights

  • The rechargeable batteries market is shaped by intense competition and rapid technological evolution, with adoption rates for electric mobility solutions increasing by over 25% in some key markets. The expansion of energy storage infrastructure is critical, as utility-scale energy storage deployments are vital for grid stability.
  • Effective battery management systems are enhancing the operational efficiency of industrial power units, while the proliferation of electric vehicle charging stations addresses consumer range anxiety. The push for a circular economy is also impacting the sector, with advanced end-of-life processing techniques now recovering a significantly higher percentage of raw materials compared to five years ago.
  • This focus on sustainability is reshaping supply chains and influencing long-term investment strategies across the industry.

We can help! Our analysts can customize this rechargeable batteries market research report to meet your requirements.

Get in touch

1. Executive Summary

1.1 Market overview

Executive Summary - Chart on Market Overview
Executive Summary - Data Table on Market Overview
Executive Summary - Chart on Global Market Characteristics
Executive Summary - Chart on Market by Geography
Executive Summary - Chart on Market Segmentation by Type
Executive Summary - Chart on Market Segmentation by End-user
Executive Summary - Chart on Market Segmentation by Application
Executive Summary - Chart on Incremental Growth
Executive Summary - Data Table on Incremental Growth
Executive Summary - Chart on Company Market Positioning

2. Technavio Analysis

2.1 Analysis of price sensitivity, lifecycle, customer purchase basket, adoption rates, and purchase criteria

2.2 Criticality of inputs and Factors of differentiation

Chart on Overview on criticality of inputs and factors of differentiation

2.3 Factors of disruption

Chart on Overview on factors of disruption

2.4 Impact of drivers and challenges

Chart on Impact of drivers and challenges in 2025 and 2030

3. Market Landscape

3.1 Market ecosystem

Chart on Parent Market
Data Table on - Parent Market

3.2 Market characteristics

Chart on Market characteristics analysis

3.3 Value chain analysis

Chart on Value chain analysis

4. Market Sizing

4.1 Market definition

Data Table on Offerings of companies included in the market definition

4.2 Market segment analysis

Market segments

4.3 Market size 2025

4.4 Market outlook: Forecast for 2025-2030

Chart on Global - Market size and forecast 2025-2030 ($ million)
Data Table on Global - Market size and forecast 2025-2030 ($ million)
Chart on Global Market: Year-over-year growth 2025-2030 (%)
Data Table on Global Market: Year-over-year growth 2025-2030 (%)

5. Historic Market Size

5.1 Global Rechargeable Batteries Market 2020 - 2024

Historic Market Size - Data Table on Global Rechargeable Batteries Market 2020 - 2024 ($ million)

5.2 Type segment analysis 2020 - 2024

Historic Market Size - Type Segment 2020 - 2024 ($ million)

5.3 End-user segment analysis 2020 - 2024

Historic Market Size - End-user Segment 2020 - 2024 ($ million)

5.4 Application segment analysis 2020 - 2024

Historic Market Size - Application Segment 2020 - 2024 ($ million)

5.5 Geography segment analysis 2020 - 2024

Historic Market Size - Geography Segment 2020 - 2024 ($ million)

5.6 Country segment analysis 2020 - 2024

Historic Market Size - Country Segment 2020 - 2024 ($ million)

6. Qualitative Analysis

6.1 Impact of AI on Global Rechargeable Batteries Market

6.2 Impact of Geopolitical Conflicts on Global Rechargeable Batteries Market

7. Five Forces Analysis

7.1 Five forces summary

Five forces analysis - Comparison between 2025 and 2030

7.2 Bargaining power of buyers

Bargaining power of buyers - Impact of key factors 2025 and 2030

7.3 Bargaining power of suppliers

Bargaining power of suppliers - Impact of key factors in 2025 and 2030

7.4 Threat of new entrants

Threat of new entrants - Impact of key factors in 2025 and 2030

7.5 Threat of substitutes

Threat of substitutes - Impact of key factors in 2025 and 2030

7.6 Threat of rivalry

Threat of rivalry - Impact of key factors in 2025 and 2030

7.7 Market condition

Chart on Market condition - Five forces 2025 and 2030

8. Market Segmentation by Type

8.1 Market segments

Chart on Type - Market share 2025-2030 (%)
Data Table on Type - Market share 2025-2030 (%)

8.2 Comparison by Type

Chart on Comparison by Type
Data Table on Comparison by Type

8.3 Lithium ion batteries - Market size and forecast 2025-2030

Chart on Lithium ion batteries - Market size and forecast 2025-2030 ($ million)
Data Table on Lithium ion batteries - Market size and forecast 2025-2030 ($ million)
Chart on Lithium ion batteries - Year-over-year growth 2025-2030 (%)
Data Table on Lithium ion batteries - Year-over-year growth 2025-2030 (%)

8.4 Lead acid batteries - Market size and forecast 2025-2030

Chart on Lead acid batteries - Market size and forecast 2025-2030 ($ million)
Data Table on Lead acid batteries - Market size and forecast 2025-2030 ($ million)
Chart on Lead acid batteries - Year-over-year growth 2025-2030 (%)
Data Table on Lead acid batteries - Year-over-year growth 2025-2030 (%)

8.5 Market opportunity by Type

Market opportunity by Type ($ million)
Data Table on Market opportunity by Type ($ million)

9. Market Segmentation by End-user

9.1 Market segments

Chart on End-user - Market share 2025-2030 (%)
Data Table on End-user - Market share 2025-2030 (%)

9.2 Comparison by End-user

Chart on Comparison by End-user
Data Table on Comparison by End-user

9.3 Automotive - Market size and forecast 2025-2030

Chart on Automotive - Market size and forecast 2025-2030 ($ million)
Data Table on Automotive - Market size and forecast 2025-2030 ($ million)
Chart on Automotive - Year-over-year growth 2025-2030 (%)
Data Table on Automotive - Year-over-year growth 2025-2030 (%)

9.4 Utilities - Market size and forecast 2025-2030

Chart on Utilities - Market size and forecast 2025-2030 ($ million)
Data Table on Utilities - Market size and forecast 2025-2030 ($ million)
Chart on Utilities - Year-over-year growth 2025-2030 (%)
Data Table on Utilities - Year-over-year growth 2025-2030 (%)

9.5 Commercial - Market size and forecast 2025-2030

Chart on Commercial - Market size and forecast 2025-2030 ($ million)
Data Table on Commercial - Market size and forecast 2025-2030 ($ million)
Chart on Commercial - Year-over-year growth 2025-2030 (%)
Data Table on Commercial - Year-over-year growth 2025-2030 (%)

9.6 Residential - Market size and forecast 2025-2030

Chart on Residential - Market size and forecast 2025-2030 ($ million)
Data Table on Residential - Market size and forecast 2025-2030 ($ million)
Chart on Residential - Year-over-year growth 2025-2030 (%)
Data Table on Residential - Year-over-year growth 2025-2030 (%)

9.7 Market opportunity by End-user

Market opportunity by End-user ($ million)
Data Table on Market opportunity by End-user ($ million)

10. Market Segmentation by Application

10.1 Market segments

Chart on Application - Market share 2025-2030 (%)
Data Table on Application - Market share 2025-2030 (%)

10.2 Comparison by Application

Chart on Comparison by Application
Data Table on Comparison by Application

10.3 Electric vehicles - Market size and forecast 2025-2030

Chart on Electric vehicles - Market size and forecast 2025-2030 ($ million)
Data Table on Electric vehicles - Market size and forecast 2025-2030 ($ million)
Chart on Electric vehicles - Year-over-year growth 2025-2030 (%)
Data Table on Electric vehicles - Year-over-year growth 2025-2030 (%)

10.4 Consumer electronics - Market size and forecast 2025-2030

Chart on Consumer electronics - Market size and forecast 2025-2030 ($ million)
Data Table on Consumer electronics - Market size and forecast 2025-2030 ($ million)
Chart on Consumer electronics - Year-over-year growth 2025-2030 (%)
Data Table on Consumer electronics - Year-over-year growth 2025-2030 (%)

10.5 Energy storage systems - Market size and forecast 2025-2030

Chart on Energy storage systems - Market size and forecast 2025-2030 ($ million)
Data Table on Energy storage systems - Market size and forecast 2025-2030 ($ million)
Chart on Energy storage systems - Year-over-year growth 2025-2030 (%)
Data Table on Energy storage systems - Year-over-year growth 2025-2030 (%)

10.6 Industrial equipment - Market size and forecast 2025-2030

Chart on Industrial equipment - Market size and forecast 2025-2030 ($ million)
Data Table on Industrial equipment - Market size and forecast 2025-2030 ($ million)
Chart on Industrial equipment - Year-over-year growth 2025-2030 (%)
Data Table on Industrial equipment - Year-over-year growth 2025-2030 (%)

10.7 Market opportunity by Application

Market opportunity by Application ($ million)
Data Table on Market opportunity by Application ($ million)

11. Customer Landscape

11.1 Customer landscape overview

Analysis of price sensitivity, lifecycle, customer purchase basket, adoption rates, and purchase criteria

12. Geographic Landscape

12.1 Geographic segmentation

Chart on Market share by geography 2025-2030 (%)
Data Table on Market share by geography 2025-2030 (%)

12.2 Geographic comparison

Chart on Geographic comparison
Data Table on Geographic comparison

12.3 APAC - Market size and forecast 2025-2030

Chart on APAC - Market size and forecast 2025-2030 ($ million)
Data Table on APAC - Market size and forecast 2025-2030 ($ million)
Chart on APAC - Year-over-year growth 2025-2030 (%)
Data Table on APAC - Year-over-year growth 2025-2030 (%)
Chart on Regional Comparison - APAC
Data Table on Regional Comparison - APAC

12.3.1 China - Market size and forecast 2025-2030

Chart on China - Market size and forecast 2025-2030 ($ million)
Data Table on China - Market size and forecast 2025-2030 ($ million)
Chart on China - Year-over-year growth 2025-2030 (%)
Data Table on China - Year-over-year growth 2025-2030 (%)

12.3.2 Japan - Market size and forecast 2025-2030

Chart on Japan - Market size and forecast 2025-2030 ($ million)
Data Table on Japan - Market size and forecast 2025-2030 ($ million)
Chart on Japan - Year-over-year growth 2025-2030 (%)
Data Table on Japan - Year-over-year growth 2025-2030 (%)

12.3.3 India - Market size and forecast 2025-2030

Chart on India - Market size and forecast 2025-2030 ($ million)
Data Table on India - Market size and forecast 2025-2030 ($ million)
Chart on India - Year-over-year growth 2025-2030 (%)
Data Table on India - Year-over-year growth 2025-2030 (%)

12.3.4 South Korea - Market size and forecast 2025-2030

Chart on South Korea - Market size and forecast 2025-2030 ($ million)
Data Table on South Korea - Market size and forecast 2025-2030 ($ million)
Chart on South Korea - Year-over-year growth 2025-2030 (%)
Data Table on South Korea - Year-over-year growth 2025-2030 (%)

12.3.5 Australia - Market size and forecast 2025-2030

Chart on Australia - Market size and forecast 2025-2030 ($ million)
Data Table on Australia - Market size and forecast 2025-2030 ($ million)
Chart on Australia - Year-over-year growth 2025-2030 (%)
Data Table on Australia - Year-over-year growth 2025-2030 (%)

12.3.6 Indonesia - Market size and forecast 2025-2030

Chart on Indonesia - Market size and forecast 2025-2030 ($ million)
Data Table on Indonesia - Market size and forecast 2025-2030 ($ million)
Chart on Indonesia - Year-over-year growth 2025-2030 (%)
Data Table on Indonesia - Year-over-year growth 2025-2030 (%)

12.4 North America - Market size and forecast 2025-2030

Chart on North America - Market size and forecast 2025-2030 ($ million)
Data Table on North America - Market size and forecast 2025-2030 ($ million)
Chart on North America - Year-over-year growth 2025-2030 (%)
Data Table on North America - Year-over-year growth 2025-2030 (%)
Chart on Regional Comparison - North America
Data Table on Regional Comparison - North America

12.4.1 US - Market size and forecast 2025-2030

Chart on US - Market size and forecast 2025-2030 ($ million)
Data Table on US - Market size and forecast 2025-2030 ($ million)
Chart on US - Year-over-year growth 2025-2030 (%)
Data Table on US - Year-over-year growth 2025-2030 (%)

12.4.2 Canada - Market size and forecast 2025-2030

Chart on Canada - Market size and forecast 2025-2030 ($ million)
Data Table on Canada - Market size and forecast 2025-2030 ($ million)
Chart on Canada - Year-over-year growth 2025-2030 (%)
Data Table on Canada - Year-over-year growth 2025-2030 (%)

12.4.3 Mexico - Market size and forecast 2025-2030

Chart on Mexico - Market size and forecast 2025-2030 ($ million)
Data Table on Mexico - Market size and forecast 2025-2030 ($ million)
Chart on Mexico - Year-over-year growth 2025-2030 (%)
Data Table on Mexico - Year-over-year growth 2025-2030 (%)

12.5 Europe - Market size and forecast 2025-2030

Chart on Europe - Market size and forecast 2025-2030 ($ million)
Data Table on Europe - Market size and forecast 2025-2030 ($ million)
Chart on Europe - Year-over-year growth 2025-2030 (%)
Data Table on Europe - Year-over-year growth 2025-2030 (%)
Chart on Regional Comparison - Europe
Data Table on Regional Comparison - Europe

12.5.1 Germany - Market size and forecast 2025-2030

Chart on Germany - Market size and forecast 2025-2030 ($ million)
Data Table on Germany - Market size and forecast 2025-2030 ($ million)
Chart on Germany - Year-over-year growth 2025-2030 (%)
Data Table on Germany - Year-over-year growth 2025-2030 (%)

12.5.2 UK - Market size and forecast 2025-2030

Chart on UK - Market size and forecast 2025-2030 ($ million)
Data Table on UK - Market size and forecast 2025-2030 ($ million)
Chart on UK - Year-over-year growth 2025-2030 (%)
Data Table on UK - Year-over-year growth 2025-2030 (%)

12.5.3 France - Market size and forecast 2025-2030

Chart on France - Market size and forecast 2025-2030 ($ million)
Data Table on France - Market size and forecast 2025-2030 ($ million)
Chart on France - Year-over-year growth 2025-2030 (%)
Data Table on France - Year-over-year growth 2025-2030 (%)

12.5.4 Italy - Market size and forecast 2025-2030

Chart on Italy - Market size and forecast 2025-2030 ($ million)
Data Table on Italy - Market size and forecast 2025-2030 ($ million)
Chart on Italy - Year-over-year growth 2025-2030 (%)
Data Table on Italy - Year-over-year growth 2025-2030 (%)

12.5.5 Spain - Market size and forecast 2025-2030

Chart on Spain - Market size and forecast 2025-2030 ($ million)
Data Table on Spain - Market size and forecast 2025-2030 ($ million)
Chart on Spain - Year-over-year growth 2025-2030 (%)
Data Table on Spain - Year-over-year growth 2025-2030 (%)

12.5.6 The Netherlands - Market size and forecast 2025-2030

Chart on The Netherlands - Market size and forecast 2025-2030 ($ million)
Data Table on The Netherlands - Market size and forecast 2025-2030 ($ million)
Chart on The Netherlands - Year-over-year growth 2025-2030 (%)
Data Table on The Netherlands - Year-over-year growth 2025-2030 (%)

12.6 Middle East and Africa - Market size and forecast 2025-2030

Chart on Middle East and Africa - Market size and forecast 2025-2030 ($ million)
Data Table on Middle East and Africa - Market size and forecast 2025-2030 ($ million)
Chart on Middle East and Africa - Year-over-year growth 2025-2030 (%)
Data Table on Middle East and Africa - Year-over-year growth 2025-2030 (%)
Chart on Regional Comparison - Middle East and Africa
Data Table on Regional Comparison - Middle East and Africa

12.6.1 Saudi Arabia - Market size and forecast 2025-2030

Chart on Saudi Arabia - Market size and forecast 2025-2030 ($ million)
Data Table on Saudi Arabia - Market size and forecast 2025-2030 ($ million)
Chart on Saudi Arabia - Year-over-year growth 2025-2030 (%)
Data Table on Saudi Arabia - Year-over-year growth 2025-2030 (%)

12.6.2 UAE - Market size and forecast 2025-2030

Chart on UAE - Market size and forecast 2025-2030 ($ million)
Data Table on UAE - Market size and forecast 2025-2030 ($ million)
Chart on UAE - Year-over-year growth 2025-2030 (%)
Data Table on UAE - Year-over-year growth 2025-2030 (%)

12.6.3 South Africa - Market size and forecast 2025-2030

Chart on South Africa - Market size and forecast 2025-2030 ($ million)
Data Table on South Africa - Market size and forecast 2025-2030 ($ million)
Chart on South Africa - Year-over-year growth 2025-2030 (%)
Data Table on South Africa - Year-over-year growth 2025-2030 (%)

12.6.4 Turkey - Market size and forecast 2025-2030

Chart on Turkey - Market size and forecast 2025-2030 ($ million)
Data Table on Turkey - Market size and forecast 2025-2030 ($ million)
Chart on Turkey - Year-over-year growth 2025-2030 (%)
Data Table on Turkey - Year-over-year growth 2025-2030 (%)

12.6.5 Israel - Market size and forecast 2025-2030

Chart on Israel - Market size and forecast 2025-2030 ($ million)
Data Table on Israel - Market size and forecast 2025-2030 ($ million)
Chart on Israel - Year-over-year growth 2025-2030 (%)
Data Table on Israel - Year-over-year growth 2025-2030 (%)

12.7 South America - Market size and forecast 2025-2030

Chart on South America - Market size and forecast 2025-2030 ($ million)
Data Table on South America - Market size and forecast 2025-2030 ($ million)
Chart on South America - Year-over-year growth 2025-2030 (%)
Data Table on South America - Year-over-year growth 2025-2030 (%)
Chart on Regional Comparison - South America
Data Table on Regional Comparison - South America

12.7.1 Brazil - Market size and forecast 2025-2030

Chart on Brazil - Market size and forecast 2025-2030 ($ million)
Data Table on Brazil - Market size and forecast 2025-2030 ($ million)
Chart on Brazil - Year-over-year growth 2025-2030 (%)
Data Table on Brazil - Year-over-year growth 2025-2030 (%)

12.7.2 Argentina - Market size and forecast 2025-2030

Chart on Argentina - Market size and forecast 2025-2030 ($ million)
Data Table on Argentina - Market size and forecast 2025-2030 ($ million)
Chart on Argentina - Year-over-year growth 2025-2030 (%)
Data Table on Argentina - Year-over-year growth 2025-2030 (%)

12.7.3 Colombia - Market size and forecast 2025-2030

Chart on Colombia - Market size and forecast 2025-2030 ($ million)
Data Table on Colombia - Market size and forecast 2025-2030 ($ million)
Chart on Colombia - Year-over-year growth 2025-2030 (%)
Data Table on Colombia - Year-over-year growth 2025-2030 (%)

12.8 Market opportunity by geography

Market opportunity by geography ($ million)
Data Tables on Market opportunity by geography ($ million)

13. Drivers, Challenges, and Opportunity

13.1 Market drivers

Rapid expansion of electric vehicle sector across major regions
Escalating demand for consumer electronics and interconnected devices
Integration of renewable energy storage systems and grid modernization

13.2 Market challenges

Volatility and vulnerability within raw material supply chains
Severe environmental concerns regarding end of life disposal
High initial capital requirements and rapid pace of technological obsolescence

13.3 Impact of drivers and challenges

Impact of drivers and challenges in 2025 and 2030

13.4 Market opportunities

Accelerated adoption of solid-state and alternative chemistry architectures
Institutionalization of circular economy frameworks and closed-loop recycling infrastructure
Proliferation of autonomous robotics and specialized aerospace applications

14. Competitive Landscape

14.1 Overview

14.2

Overview on criticality of inputs and factors of differentiation

14.3 Landscape disruption

Overview on factors of disruption

14.4 Industry risks

Impact of key risks on business

15. Competitive Analysis

15.1 Companies profiled

Companies covered

15.2 Company ranking index

15.3 Market positioning of companies

Matrix on companies position and classification

15.4 BYD Co. Ltd.

BYD Co. Ltd. - Overview
BYD Co. Ltd. - Business segments
BYD Co. Ltd. - Key news
BYD Co. Ltd. - Key offerings
BYD Co. Ltd. - Segment focus
SWOT

15.5 CLARIOS LLC

CLARIOS LLC - Overview
CLARIOS LLC - Product / Service
CLARIOS LLC - Key offerings
SWOT

15.6 Contemporary Amperex Ltd.

Contemporary Amperex Ltd. - Overview
Contemporary Amperex Ltd. - Business segments
Contemporary Amperex Ltd. - Key offerings
Contemporary Amperex Ltd. - Segment focus
SWOT

15.7 EnerSys

EnerSys - Overview
EnerSys - Business segments
EnerSys - Key offerings
EnerSys - Segment focus
SWOT

15.8 EVE Energy Co. Ltd.

EVE Energy Co. Ltd. - Overview
EVE Energy Co. Ltd. - Business segments
EVE Energy Co. Ltd. - Key offerings
EVE Energy Co. Ltd. - Segment focus
SWOT

15.9 Gotion Inc.

Gotion Inc. - Overview
Gotion Inc. - Product / Service
Gotion Inc. - Key offerings
SWOT

15.10 GS Yuasa International Ltd.

GS Yuasa International Ltd. - Overview
GS Yuasa International Ltd. - Product / Service
GS Yuasa International Ltd. - Key offerings
SWOT

15.11 LG Energy Solution Ltd.

LG Energy Solution Ltd. - Overview
LG Energy Solution Ltd. - Product / Service
LG Energy Solution Ltd. - Key news
LG Energy Solution Ltd. - Key offerings
SWOT

15.12 Murata Manufacturing Co. Ltd.

Murata Manufacturing Co. Ltd. - Overview
Murata Manufacturing Co. Ltd. - Business segments
Murata Manufacturing Co. Ltd. - Key offerings
Murata Manufacturing Co. Ltd. - Segment focus
SWOT

15.13 Northvolt AB

Northvolt AB - Overview
Northvolt AB - Product / Service
Northvolt AB - Key offerings
SWOT

15.14 Panasonic Holdings Corp.

Panasonic Holdings Corp. - Overview
Panasonic Holdings Corp. - Business segments
Panasonic Holdings Corp. - Key news
Panasonic Holdings Corp. - Key offerings
Panasonic Holdings Corp. - Segment focus
SWOT

15.15 Samsung SDI Co. Ltd.

Samsung SDI Co. Ltd. - Overview
Samsung SDI Co. Ltd. - Business segments
Samsung SDI Co. Ltd. - Key news
Samsung SDI Co. Ltd. - Key offerings
Samsung SDI Co. Ltd. - Segment focus
SWOT

15.16 Sunwoda Electronic Co. Ltd.

Sunwoda Electronic Co. Ltd. - Overview
Sunwoda Electronic Co. Ltd. - Business segments
Sunwoda Electronic Co. Ltd. - Key offerings
Sunwoda Electronic Co. Ltd. - Segment focus
SWOT

15.17 The Duracell Co.

The Duracell Co. - Overview
The Duracell Co. - Product / Service
The Duracell Co. - Key offerings
SWOT

15.18 VARTA AG

VARTA AG - Overview
VARTA AG - Business segments
VARTA AG - Key news
VARTA AG - Key offerings
VARTA AG - Segment focus
SWOT

16. Appendix

16.1 Scope of the report

Market definition
Objectives
Notes and caveats

16.2 Inclusions and exclusions checklist

Inclusions checklist
Exclusions checklist

16.3 Currency conversion rates for US$

16.4 Research methodology

16.5 Data procurement

Information sources

16.6 Data validation

16.7 Validation techniques employed for market sizing

16.8 Data synthesis

16.9 360 degree market analysis

16.10 List of abbreviations

Research Methodology

Technavio presents a detailed picture of the market by way of study, synthesis, and summation of data from multiple sources. The analysts have presented the various facets of the market with a particular focus on identifying the key industry influencers. The data thus presented is comprehensive, reliable, and the result of extensive research, both primary and secondary.

INFORMATION SOURCES

Primary sources

  • Manufacturers and suppliers
  • Channel partners
  • Industry experts
  • Strategic decision makers

Secondary sources

  • Industry journals and periodicals
  • Government data
  • Financial reports of key industry players
  • Historical data
  • Press releases

DATA ANALYSIS

Data Synthesis

  • Collation of data
  • Estimation of key figures
  • Analysis of derived insights

Data Validation

  • Triangulation with data models
  • Reference against proprietary databases
  • Corroboration with industry experts

REPORT WRITING

Qualitative

  • Market drivers
  • Market challenges
  • Market trends
  • Five forces analysis

Quantitative

  • Market size and forecast
  • Market segmentation
  • Geographical insights
  • Competitive landscape

Interested in this report?

Get your sample now to see our research methodology and insights!

Download Now

Frequently Asked Questions

Rechargeable Batteries market growth will increase by USD 110232.4 million during 2026-2030.

The Rechargeable Batteries market is expected to grow at a CAGR of 12.5% during 2026-2030.

Rechargeable Batteries market is segmented by Type (Lithium ion batteries, Lead acid batteries) End-user (Automotive, Utilities, Commercial, Residential) Application (Electric vehicles, Consumer electronics, Energy storage systems, Industrial equipment)

BYD Co. Ltd., CLARIOS LLC, Contemporary Amperex Ltd., East Penn Manufacture Co. Inc., Energizer Holdings Inc., EnerSys, EVE Energy Co. Ltd., Exide Industries Ltd., Gotion Inc., GS Yuasa International Ltd., LG Energy Solution Ltd., Microvast Holdings Inc., Murata Manufacturing Co. Ltd., Northvolt AB, Panasonic Holdings Corp., Samsung SDI Co. Ltd., Sunwoda Electronic Co. Ltd., The Duracell Co., VARTA AG are a few of the key vendors in the Rechargeable Batteries market.

APAC will register the highest growth rate of 47.1% among the other regions. Therefore, the Rechargeable Batteries market in APAC is expected to garner significant business opportunities for the vendors during the forecast period.

China, Japan, India, South Korea, Australia, Indonesia, US, Canada, Mexico, Germany, UK, France, Italy, Spain, The Netherlands, Saudi Arabia, UAE, South Africa, Turkey, Israel, Brazil, Argentina, Colombia

  • Rapid expansion of electric vehicle sector across major regions is the driving factor this market.

The Rechargeable Batteries market vendors should focus on grabbing business opportunities from the Type segment as it accounted for the largest market share in the base year.
RIA - Research AI Assistant
Ask RIA