Grid-scale Battery Market Size 2026-2030
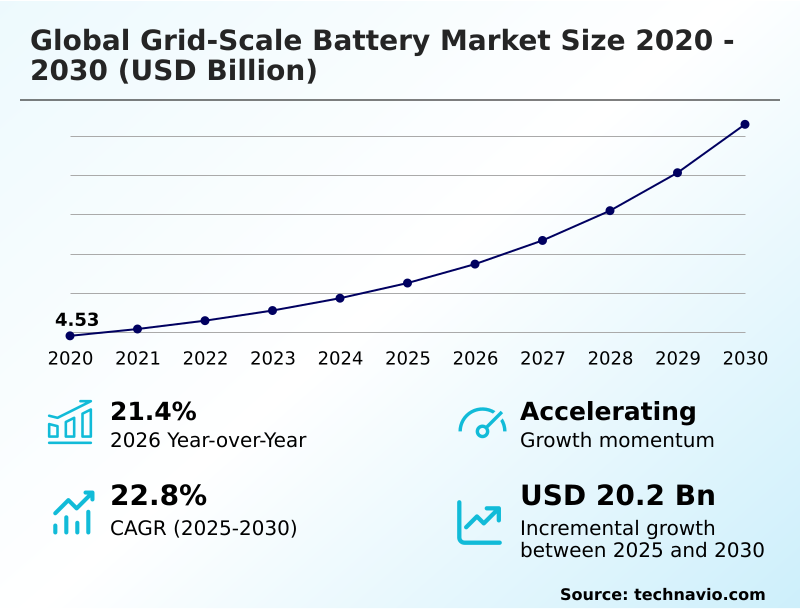
The grid-scale battery market size is valued to increase by USD 20.20 billion, at a CAGR of 22.8% from 2025 to 2030. Increasing integration of renewable energy sources will drive the grid-scale battery market.
Major Market Trends & Insights
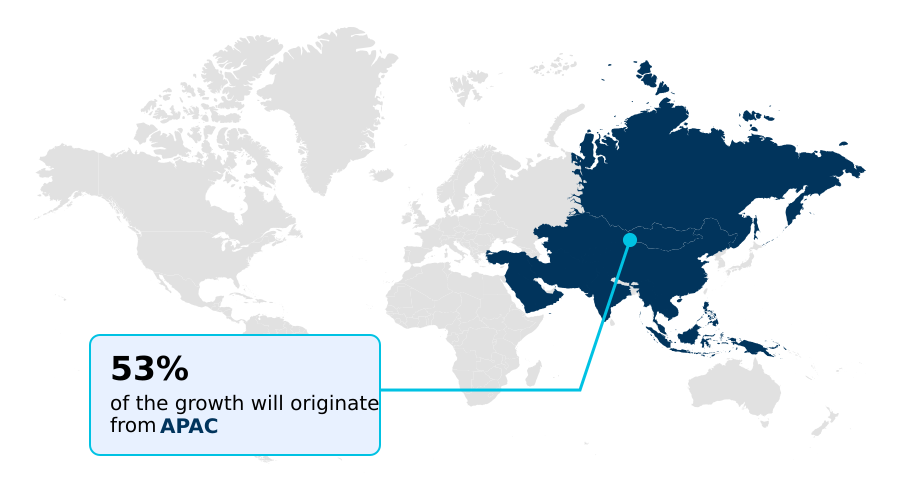
- APAC dominated the market and accounted for a 53.3% growth during the forecast period.
- By Application - Ancillary services segment was valued at USD 5.91 billion in 2024
- By Battery Type - Lithium-based segment accounted for the largest market revenue share in 2024
Market Size & Forecast
- Market Opportunities: USD 26.92 billion
- Market Future Opportunities: USD 20.20 billion
- CAGR from 2025 to 2030 : 22.8%
Market Summary
- The grid-scale battery market is foundational to the global energy transition, enabling the large-scale integration of intermittent renewable sources. This market is driven by the declining costs of lithium-ion battery technology and supportive government mandates aimed at decarbonization.
- Key trends include the shift toward long-duration energy storage solutions using alternative chemistries like flow batteries and sodium-ion, which address the limitations of standard four-hour systems. Another significant development is the use of artificial intelligence in virtual power plants to optimize energy dispatch and maximize revenue streams.
- For instance, a utility can use a VPP to aggregate thousands of distributed energy storage assets, creating a unified, dispatchable resource that enhances grid stability and defers costly infrastructure upgrades. However, the industry faces challenges related to critical mineral supply chain vulnerabilities, high upfront capital costs, and complex regulatory frameworks that can delay project deployment.
- Addressing these issues is crucial for unlocking the full potential of grid-scale storage.
What will be the Size of the Grid-scale Battery Market during the forecast period?
Get Key Insights on Market Forecast (PDF) Get Free Sample
How is the Grid-scale Battery Market Segmented?
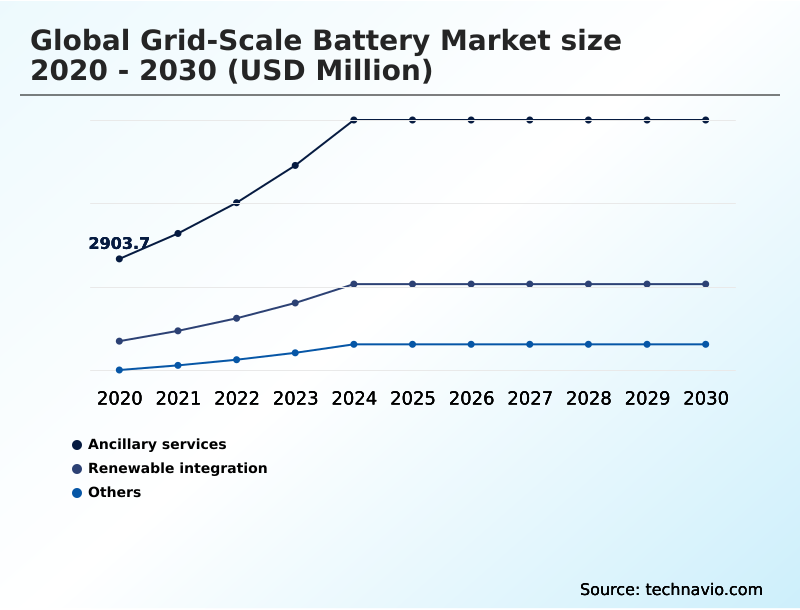
The grid-scale battery industry research report provides comprehensive data (region-wise segment analysis), with forecasts and estimates in "USD million" for the period 2026-2030, as well as historical data from 2020-2024 for the following segments.
- Application
- Ancillary services
- Renewable integration
- Others
- Battery type
- Lithium-based
- Lead-acid
- Others
- Ownership
- Utility
- Third-party
- Geography
- APAC
- China
- India
- Japan
- North America
- US
- Canada
- Mexico
- Europe
- Germany
- UK
- Spain
- South America
- Brazil
- Argentina
- Middle East and Africa
- Saudi Arabia
- UAE
- South Africa
- Rest of World (ROW)
- APAC
By Application Insights
The ancillary services segment is estimated to witness significant growth during the forecast period.
The ancillary services segment is critical for electricity grid modernization, with battery systems providing essential grid-stabilizing functions. These systems excel at frequency regulation market participation, offering fast-frequency response that legacy generators cannot match.
Through advanced inverter-based resources, they also deliver voltage support services and synthetic inertia provision, which are vital in grids with high renewable penetration. An advanced battery management system (BMS) is key to optimizing cycle life performance during frequent, rapid cycling.
This capability for precise ramp rate control improves grid frequency correction by over 98% compared to conventional thermal plants. Furthermore, batteries serve as effective non-wires alternatives, deferring costly transmission upgrades by managing local congestion.
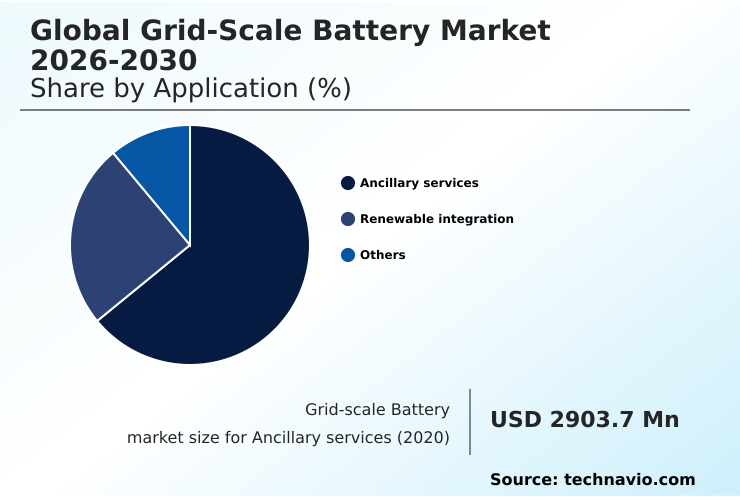
The Ancillary services segment was valued at USD 5.91 billion in 2024 and showed a gradual increase during the forecast period.
Regional Analysis
APAC is estimated to contribute 53.3% to the growth of the global market during the forecast period.Technavio’s analysts have elaborately explained the regional trends and drivers that shape the market during the forecast period.
See How Grid-scale Battery Market Demand is Rising in APAC Get Free Sample
The geographic landscape is characterized by gigawatt-scale deployments concentrated in regions with aggressive renewable energy mandates. APAC leads this expansion, accounting for over 53% of market growth, driven by massive energy infrastructure investment.
In North America, independent power producers and utilities leverage stationary energy storage as distributed energy resources for transmission congestion management and system resilience improvement. These containerized storage solutions enhance energy security enhancement and provide essential black-start capability.
In regulated markets, these assets are often included in the utility rate base, ensuring a stable return, whereas deregulated markets see more merchant-based projects. This regional variation significantly influences project economics and deployment strategies.
Market Dynamics
Our researchers analyzed the data with 2025 as the base year, along with the key drivers, trends, and challenges. A holistic analysis of drivers will help companies refine their marketing strategies to gain a competitive advantage.
- Strategic decisions in the grid-scale battery market require a detailed assessment of lithium-ion vs flow battery performance for different applications. The role of AI in VPP orchestration is becoming critical for optimizing asset dispatch and maximizing the return on investment for energy arbitrage.
- A key consideration is the economic viability of second-life batteries, which can reduce high upfront capital costs by over 30% compared to new systems, addressing a major industry hurdle. However, this approach depends on a steady impact of EVs on second-life supply. Simultaneously, the industry grapples with the challenges of critical mineral sourcing and price volatility.
- Policy incentives for energy storage are designed to mitigate these financial pressures and encourage deployment. For system design, integrating BESS with solar farms is essential for managing intermittency with battery storage, while advanced BMS software for battery optimization enhances efficiency.
- Trends in containerized BESS solutions offer scalability, but effective thermal management in large batteries and adherence to safety standards for grid installations are non-negotiable. Exploring the ancillary service revenue stream potential is vital, as is understanding BESS for transmission deferral benefits.
- The market is also evaluating sodium-ion battery cost competitiveness and the long-term promise of solid-state battery for stationary use, particularly regarding LFP chemistry safety and cycle life. Ultimately, robust financing models for utility-scale BESS are necessary for BESS replacing fossil fuel peaker plants and addressing the regulatory policy impact on deployment.
What are the key market drivers leading to the rise in the adoption of Grid-scale Battery Industry?
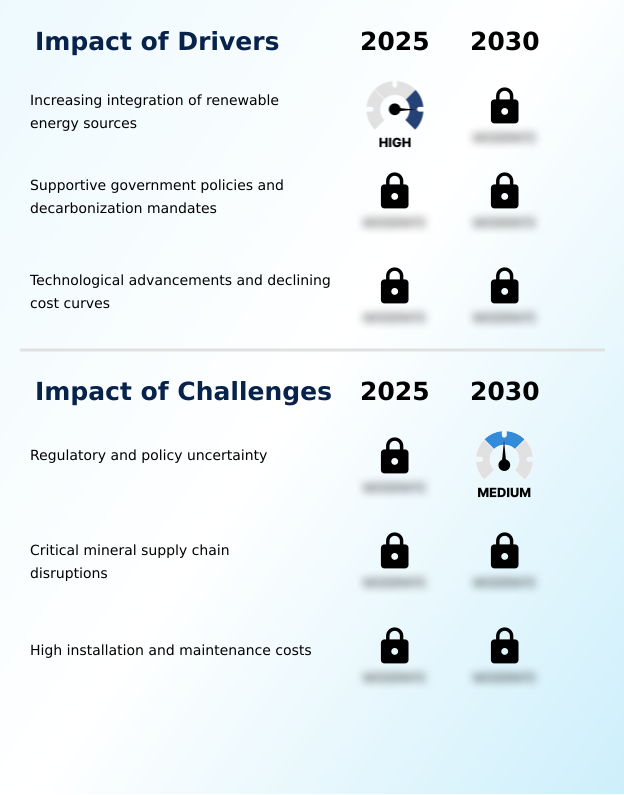
- The increasing integration of renewable energy sources into power grids is a primary driver for the global grid-scale battery market.
- The primary market driver is the imperative for deep power sector decarbonization, which relies on the seamless renewable energy integration of intermittent sources.
- Battery energy storage systems (BESS) are fundamental to this energy transition infrastructure, enabling utility-scale procurement of solar-plus-storage projects and wind-plus-storage projects.
- These hybrid power plants help with duck curve mitigation and serve as a spinning reserve replacement, providing critical ancillary grid services.
- Favorable government policies, including investment tax credits and a clear national energy strategy, are accelerating deployment, helping meet decarbonization targets impact by enabling over 90% utilization of available renewable generation.
What are the market trends shaping the Grid-scale Battery Industry?
- A key market trend involves a transition toward long-duration energy storage solutions. This shift is also accelerating the development and adoption of alternative battery chemistries beyond traditional lithium-ion.
- A significant shift toward long-duration energy storage is reshaping the market, moving beyond short-cycle applications. This trend drives investment in flow battery technology and sodium-ion battery systems, which provide the firm dispatchable power needed for grid stability over extended periods. Concurrently, the rise of the virtual power plant (VPP) model enables the aggregation of decentralized energy solutions.
- Circular economy principles are also gaining traction, with second-life battery repurposing becoming a key strategy. This approach is supported by a growing battery recycling ecosystem and digital tracking systems that ensure a closed-loop supply chain, improving asset lifecycle management and reducing lifecycle emissions by up to 30%. The focus is on creating resilient systems capable of cross-border energy sharing.
What challenges does the Grid-scale Battery Industry face during its growth?
- Regulatory and policy uncertainty across various jurisdictions presents a significant challenge to the growth of the grid-scale battery industry.
- Navigating regulatory frameworks for storage and lengthy grid interconnection queues remains a primary challenge, extending project timelines by more than 40% in some regions. The critical mineral supply chain for lithium-ion battery technology introduces significant price volatility and geopolitical risk.
- While the cost per kilowatt-hour is declining, the high upfront capital costs associated with large-scale projects require innovative financing and favorable power purchase agreements to ensure viability. Developers must also create robust merchant revenue models to succeed in competitive wholesale electricity markets.
- Efficient thermal management systems are crucial for safety and achieving operational efficiency gains, while a focus on capital expenditure reduction drives interest in alternative chemistries.
Exclusive Technavio Analysis on Customer Landscape
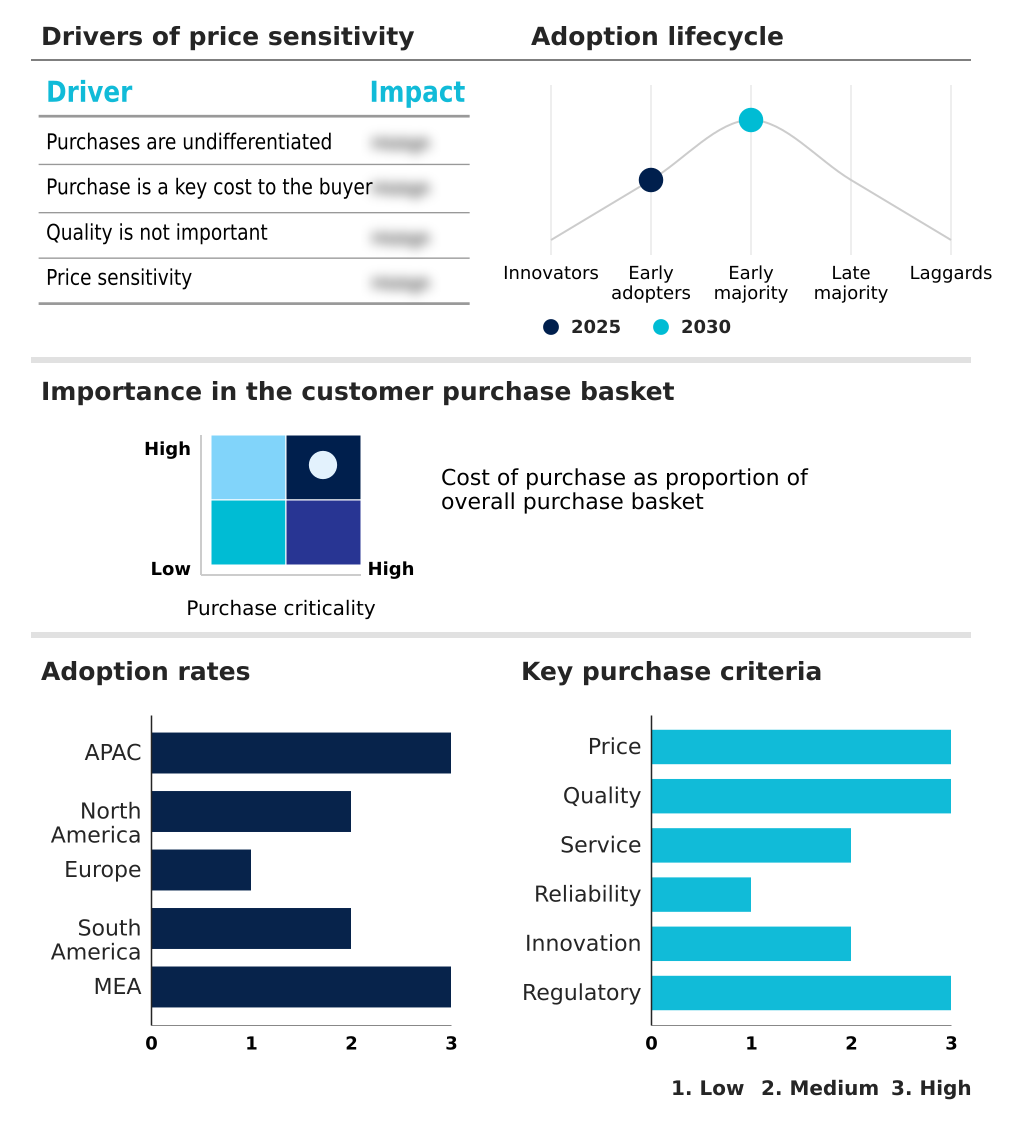
The grid-scale battery market forecasting report includes the adoption lifecycle of the market, covering from the innovator’s stage to the laggard’s stage. It focuses on adoption rates in different regions based on penetration. Furthermore, the grid-scale battery market report also includes key purchase criteria and drivers of price sensitivity to help companies evaluate and develop their market growth analysis strategies.
Customer Landscape of Grid-scale Battery Industry
Competitive Landscape
Companies are implementing various strategies, such as strategic alliances, grid-scale battery market forecast, partnerships, mergers and acquisitions, geographical expansion, and product/service launches, to enhance their presence in the industry.
ABB Ltd. - Key offerings encompass integrated grid-scale battery systems and advanced battery management platforms, designed to enhance utility energy storage and grid-edge solutions.
The industry research and growth report includes detailed analyses of the competitive landscape of the market and information about key companies, including:
- ABB Ltd.
- BYD Co. Ltd.
- CALB Group Co. Ltd.
- Contemporary Amperex Ltd.
- ESS Tech Inc.
- EVE Energy Co. Ltd.
- Form Energy
- Gotion Inc.
- GS Yuasa International Ltd.
- Hitachi Ltd.
- LG Electronics Inc.
- NEC Corp.
- NGK Insulators Ltd
- Panasonic Holdings Corp.
- Samsung SDI Co. Ltd.
- Siemens AG
- SolarEdge Technologies Inc.
- Tesla Inc.
- Toshiba Corp.
- TotalEnergies SE
Qualitative and quantitative analysis of companies has been conducted to help clients understand the wider business environment as well as the strengths and weaknesses of key industry players. Data is qualitatively analyzed to categorize companies as pure play, category-focused, industry-focused, and diversified; it is quantitatively analyzed to categorize companies as dominant, leading, strong, tentative, and weak.
Recent Development and News in Grid-scale battery market
- In February, 2025, Breakthrough Energy Ventures inaugurated the first commercial-scale iron-air battery facility, which is engineered to provide one hundred hours of continuous power discharge.
- In March, 2025, the Australian government's Renewable Energy Agency launched a national energy storage strategy, introducing a new competitive auction mechanism to provide long-term revenue certainty for grid-scale battery projects.
- In April, 2025, the Platte River Power Authority in Colorado began the development of a 100-megawatt lithium iron phosphate battery system to support the integration of its growing portfolio of wind and solar assets.
- In May, 2025, the Ministry of Power in India established a comprehensive framework designed to support the deployment of ten gigawatt-hours of standalone energy storage systems to enhance national grid stability.
Dive into Technavio’s robust research methodology, blending expert interviews, extensive data synthesis, and validated models for unparalleled Grid-scale Battery Market insights. See full methodology.
| Market Scope | |
|---|---|
| Page number | 297 |
| Base year | 2025 |
| Historic period | 2020-2024 |
| Forecast period | 2026-2030 |
| Growth momentum & CAGR | Accelerate at a CAGR of 22.8% |
| Market growth 2026-2030 | USD 20197.8 million |
| Market structure | Fragmented |
| YoY growth 2025-2026(%) | 21.4% |
| Key countries | China, India, Japan, South Korea, Australia, Thailand, US, Canada, Mexico, Germany, UK, Spain, Italy, France, Poland, Brazil, Chile, Argentina, Saudi Arabia, UAE, South Africa, Egypt and Qatar |
| Competitive landscape | Leading Companies, Market Positioning of Companies, Competitive Strategies, and Industry Risks |
Research Analyst Overview
- The grid-scale battery market enables renewable energy integration through advanced battery energy storage systems (BESS), which are critical for grid balancing services. These systems provide ancillary grid services like the frequency regulation market and voltage support services, acting as a spinning reserve replacement.
- The landscape features lithium-ion battery technology, specifically lithium iron phosphate (LFP) chemistry, alongside emerging long-duration energy storage such as flow battery technology, solid-state battery development, and sodium-ion battery for grid stabilization solutions. For strategic planning, the critical mineral supply chain risk necessitates diversification.
- Utility-scale procurement of hybrid power plants and containerized storage solutions is optimized by battery management system (BMS) technology, which can extend cycle life performance by over 20%. These stationary energy storage assets support energy arbitrage models and peak shaving application, functioning as non-wires alternatives to manage transmission congestion management.
- Other key functions include black-start capability, ramp rate control using inverter-based resources, and providing synthetic inertia provision to modern grids. The cost per kilowatt-hour continues to influence project viability, alongside energy density metrics, while virtual power plant (VPP) models and second-life battery repurposing present new revenue opportunities. Tackling grid interconnection queues remains a challenge.
What are the Key Data Covered in this Grid-scale Battery Market Research and Growth Report?
-
What is the expected growth of the Grid-scale Battery Market between 2026 and 2030?
-
USD 20.20 billion, at a CAGR of 22.8%
-
-
What segmentation does the market report cover?
-
The report is segmented by Application (Ancillary services, Renewable integration, and Others), Battery Type (Lithium-based, Lead-acid, and Others), Ownership (Utility, and Third-party) and Geography (APAC, North America, Europe, South America, Middle East and Africa)
-
-
Which regions are analyzed in the report?
-
APAC, North America, Europe, South America and Middle East and Africa
-
-
What are the key growth drivers and market challenges?
-
Increasing integration of renewable energy sources, Regulatory and policy uncertainty
-
-
Who are the major players in the Grid-scale Battery Market?
-
ABB Ltd., BYD Co. Ltd., CALB Group Co. Ltd., Contemporary Amperex Ltd., ESS Tech Inc., EVE Energy Co. Ltd., Form Energy, Gotion Inc., GS Yuasa International Ltd., Hitachi Ltd., LG Electronics Inc., NEC Corp., NGK Insulators Ltd, Panasonic Holdings Corp., Samsung SDI Co. Ltd., Siemens AG, SolarEdge Technologies Inc., Tesla Inc., Toshiba Corp. and TotalEnergies SE
-
Market Research Insights
- The market dynamics are increasingly shaped by the need for enhanced operational efficiency gains and system resilience. Independent power producers are leveraging sophisticated energy arbitrage models in wholesale electricity markets, supported by long-term power purchase agreements that de-risk investments.
- This drive for profitability is accelerating the adoption of advanced BESS technology, which can deliver a 15% reduction in capital expenditure through optimized design and asset lifecycle management. Furthermore, the integration of these systems into the energy transition infrastructure helps achieve decarbonization targets, with some projects improving renewable energy capture rates by over 25%.
- Regulatory frameworks are adapting to support these merchant models, fostering a competitive environment focused on performance and cost-effectiveness.
We can help! Our analysts can customize this grid-scale battery market research report to meet your requirements.
 RIA -
RIA - 
