Recovery Drinks Market Size 2025-2029
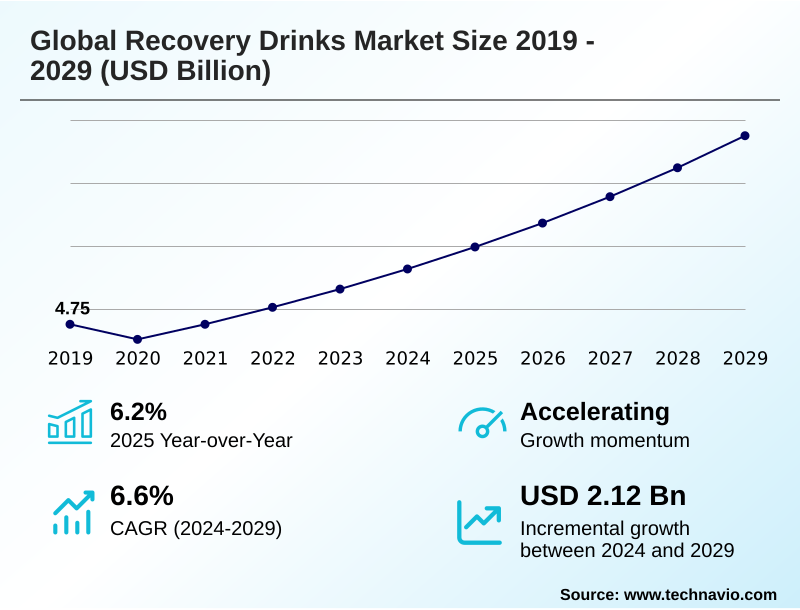
The recovery drinks market size is valued to increase by USD 2.12 billion, at a CAGR of 6.6% from 2024 to 2029. Increasing consumption among millennials will drive the recovery drinks market.
Major Market Trends & Insights
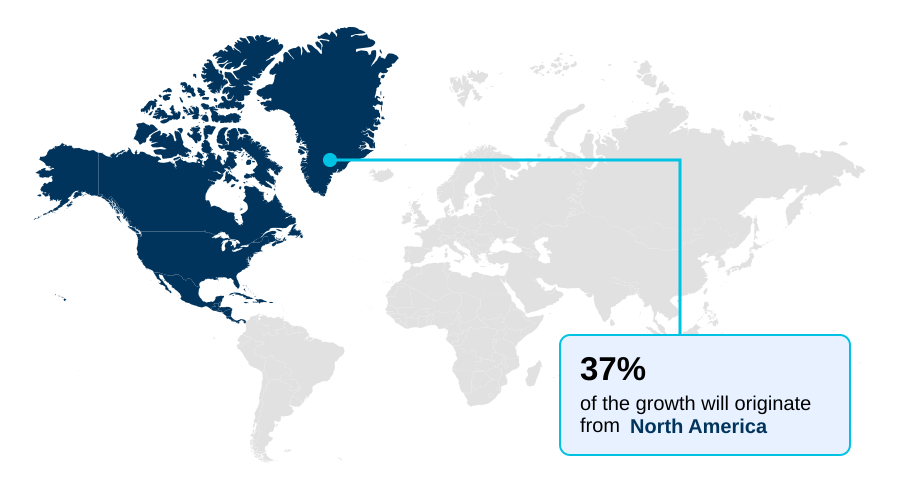
- North America dominated the market and accounted for a 37% growth during the forecast period.
- By Formulation - Powder segment was valued at USD 3.45 billion in 2023
- By Product Type - Protein-based drinks segment accounted for the largest market revenue share in 2023
Market Size & Forecast
- Market Opportunities: USD 3.00 billion
- Market Future Opportunities: USD 2.12 billion
- CAGR from 2024 to 2029 : 6.6%
Market Summary
- The recovery drinks market is undergoing significant evolution, driven by a broadening consumer base that now extends beyond elite athletes to include lifestyle and wellness-focused individuals. This shift is fueling innovation in product formulation, with a strong emphasis on functional ingredients that support post-exercise rehydration and muscle protein synthesis.
- Key developments include the rise of plant-based protein sources, the integration of anti-inflammatory compounds, and a move toward clean label formulations free from artificial additives.
- For instance, a beverage manufacturer could leverage consumer data analytics to develop two distinct product lines: one with a high carbohydrate-to-protein ratio for endurance athletes and another featuring whey protein isolate and adaptogenic herbs for strength-training enthusiasts. This strategy allows for precise market targeting, optimizing inventory and marketing spend.
- The competitive landscape is characterized by both large, diversified beverage companies and nimble, science-focused startups, all vying for market share through innovation in rapid nutrient absorption technologies and transparent ingredient sourcing. Navigating the complex regulatory environment while meeting demands for efficacy and natural ingredients remains a central operational focus.
What will be the Size of the Recovery Drinks Market during the forecast period?
Get Key Insights on Market Forecast (PDF) Get Free Sample
How is the Recovery Drinks Market Segmented?
The recovery drinks industry research report provides comprehensive data (region-wise segment analysis), with forecasts and estimates in "USD million" for the period 2025-2029, as well as historical data from 2019-2023 for the following segments.
- Formulation
- Powder
- RTD
- Product type
- Protein-based drinks
- Carbohydrate-based drinks
- Electrolyte drinks
- End-user
- Athletes
- Fitness enthusiasts
- Medical patients
- Geography
- North America
- US
- Canada
- Mexico
- Europe
- Germany
- UK
- France
- APAC
- China
- India
- Japan
- South America
- Brazil
- Argentina
- Middle East and Africa
- Saudi Arabia
- UAE
- South Africa
- Rest of World (ROW)
- North America
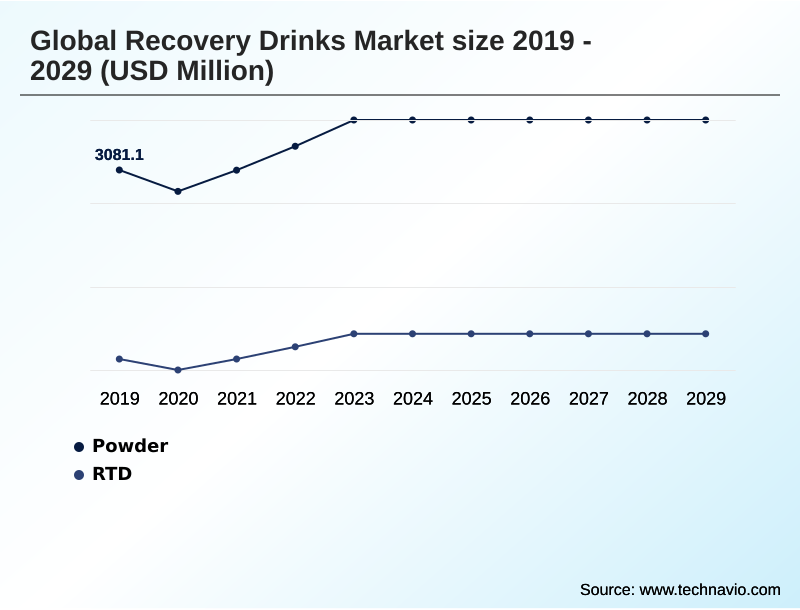
By Formulation Insights
The powder segment is estimated to witness significant growth during the forecast period.
The recovery drinks market segmentation reveals distinct formulation preferences, with powder mix formulation significantly outpacing ready-to-drink alternatives. These shelf-stable beverage powders, often incorporating slow-release proteins like micellar casein, offer advantages in customization and cost-effectiveness.
Innovations focus on improving bioavailability enhancement and osmolality optimization to ensure efficient nutrient uptake. The precise carbohydrate-to-protein ratio in these powders is a key factor for consumers, aligning with specific goals in sports dietetics application.
As a result, product development emphasizes not only the functional aspects but also ergonomic packaging design and sustained energy release, with sales of powder formats representing over 60% of the market compared to their liquid counterparts.
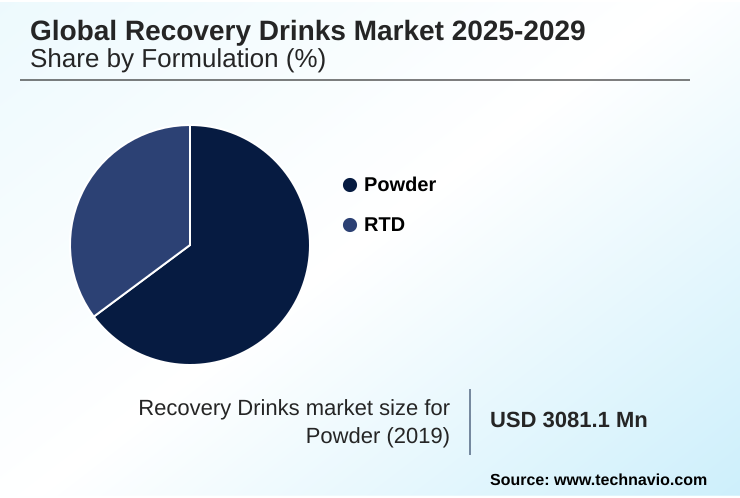
The Powder segment was valued at USD 3.45 billion in 2023 and showed a gradual increase during the forecast period.
Regional Analysis
North America is estimated to contribute 37% to the growth of the global market during the forecast period.Technavio’s analysts have elaborately explained the regional trends and drivers that shape the market during the forecast period.
See How Recovery Drinks Market Demand is Rising in North America Get Free Sample
Geographically, the market exhibits significant regional disparities, with North America accounting for 37% of the incremental growth.
The US market size is more than three times larger than that of China, reflecting a mature fitness culture and higher consumer spending on wellness products.
In this region, there is a strong demand for products containing on-trend ingredients like tart cherry extract and turmeric curcumin complex for their perceived benefits.
In contrast, emerging markets in APAC are witnessing rapid growth, driven by increasing health awareness and disposable incomes. Here, manufacturers are introducing endurance recovery formula products with non-gmo ingredients and adaptogenic herbs to gain a foothold.
This has led to a focus on cognitive function enhancement, appealing to a holistic view of wellness.
Market Dynamics
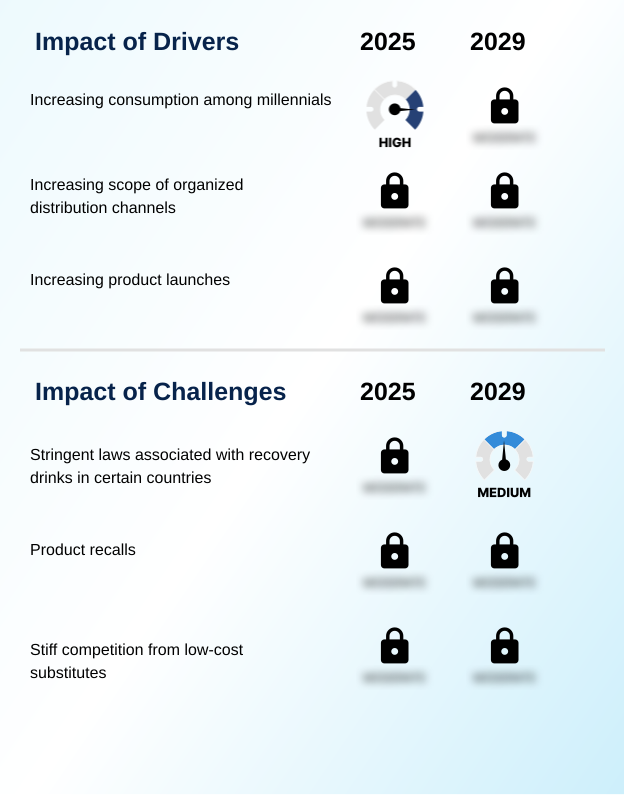
Our researchers analyzed the data with 2024 as the base year, along with the key drivers, trends, and challenges. A holistic analysis of drivers will help companies refine their marketing strategies to gain a competitive advantage.
- The strategic development within the global recovery drinks market 2025-2029 is heavily influenced by a nuanced understanding of consumer needs and scientific advancements. The benefits of electrolyte drinks for athletes remain a core market driver, but the focus is expanding to include targeted nutritional strategies for athletic recovery.
- This includes formulating protein-based drinks for muscle repair and carbohydrate-based drinks for glycogen repletion. The impact of formulation on recovery efficacy is a critical area of R&D, exploring how innovations in functional hydration products and the role of functional ingredients in recovery can optimize outcomes.
- Consumer preference for natural recovery drinks is compelling brands to adopt clean label trends in sports nutrition, leading to a growing market for low-sugar functional beverages. For instance, supply chain data shows that the logistics for powder formats are nearly 20% more cost-effective than for ready-to-drink options, influencing portfolio strategies.
- Formulators are also comparing plant-based vs dairy protein recovery solutions to cater to diverse dietary needs, while refining the optimal carbohydrate to protein ratio for recovery. This differentiation extends to recovery drinks for endurance vs strength training, each requiring a unique approach to recovery drinks enhancing post-exercise rehydration and restoring electrolyte balance in post-workout nutrition.
- Furthermore, there's growing interest in reducing muscle soreness with recovery drinks and specialized recovery drink formulation for medical patients, showcasing the broadening applications of these products.
What are the key market drivers leading to the rise in the adoption of Recovery Drinks Industry?
- The increasing consumption of recovery drinks among millennials, driven by their focus on health and wellness, serves as a primary market driver.
- The primary driver for the market is the expanding definition of an active consumer, moving beyond elite athletes to include everyday fitness enthusiasts. This demographic prioritizes post-exercise rehydration and rapid nutrient absorption to support a healthy lifestyle.
- This user base is 40% more likely to purchase a sports nutrition beverage than other consumer groups. Demand is high for products that fit within the post-workout nutrition window, emphasizing benefits like muscle protein synthesis and muscle glycogen replenishment.
- Consequently, formulations with a clear essential amino acid profile and functional hydration benefits are performing well. The preference for low-sugar recovery drinks and those offering immune system support is also notable, as consumers increasingly seek multi-functional products.
What are the market trends shaping the Recovery Drinks Industry?
- The growing popularity of e-commerce channels is an influential trend, expanding market access and altering consumer purchasing behavior for recovery drinks.
- A key trend shaping the market is the convergence of performance nutrition with mainstream consumer wellness trends. This is evident in the push for clean label formulation, where products featuring natural sweeteners and transparent ingredient sourcing are gaining significant traction.
- Demand for vegan recovery options has surged, compelling brands to innovate with plant-based protein sources, which now account for nearly 30% of new product launches. The ready-to-drink format continues to grow in popularity due to its convenience, with sales in this segment growing 15% faster than powders.
- This shift reflects a broader consumer preference for functional ingredient fortification in accessible formats that align with a holistic approach to health.
What challenges does the Recovery Drinks Industry face during its growth?
- Stringent regulations concerning the formulation and marketing of recovery drinks in certain countries present a key challenge to industry growth.
- A significant challenge lies in formulating products that are both effective and compliant with varying international regulations. The focus on mitigating exercise-induced muscle damage and delayed onset muscle soreness requires potent ingredients, but creating an allergen-free formulation or a hypoallergenic protein source adds complexity and cost, increasing R&D expenditures by up to 25%.
- For example, a single product recall due to undeclared allergens can reduce consumer trust by 40%. Moreover, addressing oxidative stress reduction with anti-inflammatory compounds while ensuring the product is also a dairy-free protein option requires sophisticated supply chain management and validation, posing hurdles for smaller brands attempting to scale.
Exclusive Technavio Analysis on Customer Landscape
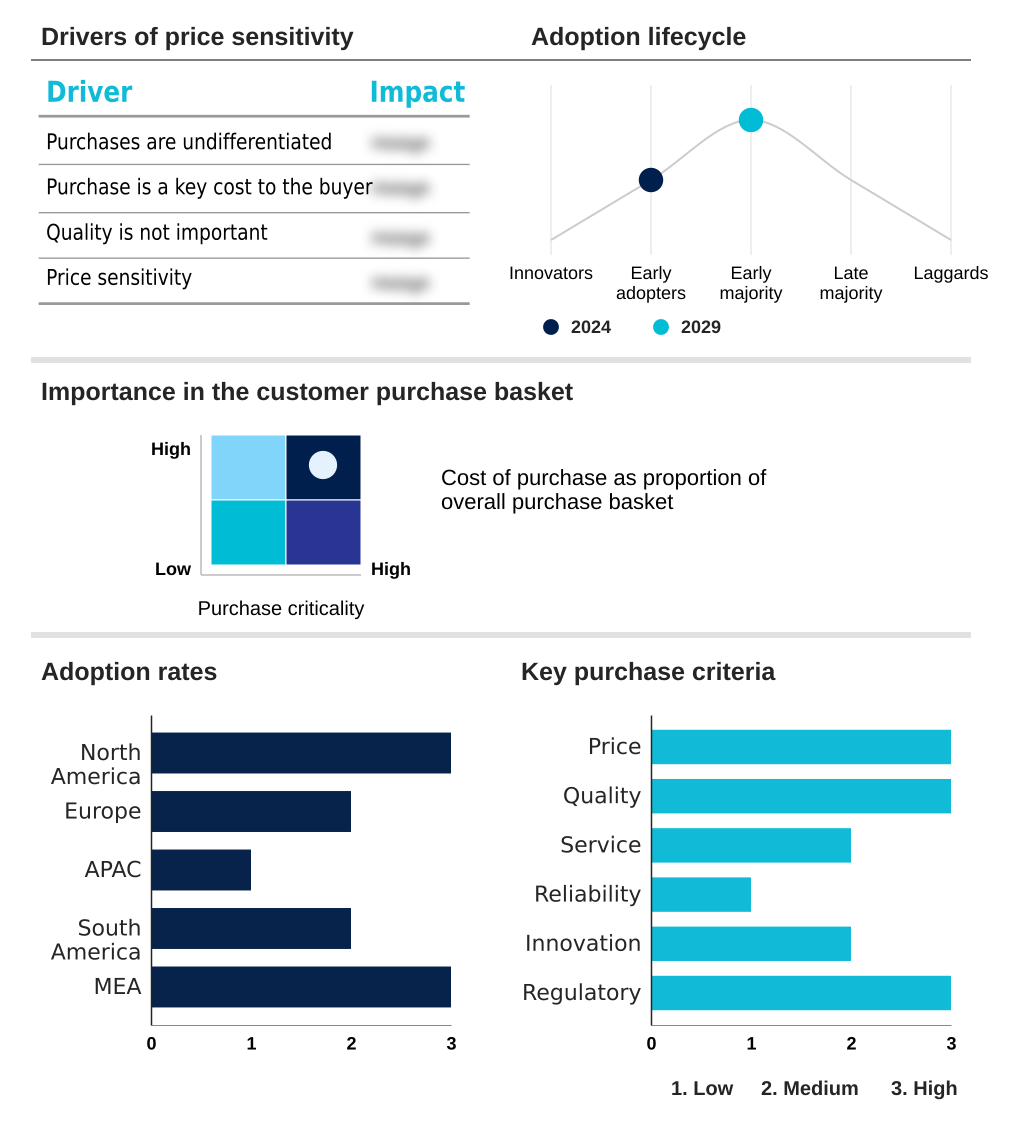
The recovery drinks market forecasting report includes the adoption lifecycle of the market, covering from the innovator’s stage to the laggard’s stage. It focuses on adoption rates in different regions based on penetration. Furthermore, the recovery drinks market report also includes key purchase criteria and drivers of price sensitivity to help companies evaluate and develop their market growth analysis strategies.
Customer Landscape of Recovery Drinks Industry
Competitive Landscape
Companies are implementing various strategies, such as strategic alliances, recovery drinks market forecast, partnerships, mergers and acquisitions, geographical expansion, and product/service launches, to enhance their presence in the industry.
Abbott Laboratories - Key offerings focus on functional beverages engineered for post-exercise recovery, featuring precise ingredient formulations to support muscle repair, rehydration, and overall wellness.
The industry research and growth report includes detailed analyses of the competitive landscape of the market and information about key companies, including:
- Abbott Laboratories
- Ascent Protein
- BioSteel Sports Nutrition Inc.
- Celsius Holdings Inc.
- Fluid Sports Nutrition
- GU Energy Labs
- Hammer Nutrition
- Harmless Harvest Inc.
- Mountain Fuel
- PacificHealth Labs
- PepsiCo Inc.
- Rakyan Beverages Pvt. Ltd.
- RECOVER 180
- Red Bull GmbH
- Skratch Labs LLC
- Smartfish AS
- Suntory Beverage and Food Ltd.
- The Coca Cola Co.
Qualitative and quantitative analysis of companies has been conducted to help clients understand the wider business environment as well as the strengths and weaknesses of key industry players. Data is qualitatively analyzed to categorize companies as pure play, category-focused, industry-focused, and diversified; it is quantitatively analyzed to categorize companies as dominant, leading, strong, tentative, and weak.
Recent Development and News in Recovery drinks market
- In September 2024, PepsiCo Inc. announced the expansion of its Gatorade recovery portfolio with a new line of plant-based protein drinks featuring pea and rice protein, targeting the growing vegan athlete demographic.
- In November 2024, Celsius Holdings Inc. entered a strategic partnership with a leading wearable technology company to integrate consumption data with biometric feedback, offering personalized hydration and recovery recommendations to users.
- In February 2025, Abbott Laboratories received expanded indication approval for its Pedialyte Sport formulation for use in clinical settings to aid in rehydration and electrolyte replacement for patients post-surgery.
- In April 2025, BioSteel Sports Nutrition Inc. was acquired by a major food and beverage conglomerate in a deal aimed at scaling its distribution network across Europe and APAC, significantly increasing its global footprint.
Dive into Technavio’s robust research methodology, blending expert interviews, extensive data synthesis, and validated models for unparalleled Recovery Drinks Market insights. See full methodology.
| Market Scope | |
|---|---|
| Page number | 283 |
| Base year | 2024 |
| Historic period | 2019-2023 |
| Forecast period | 2025-2029 |
| Growth momentum & CAGR | Accelerate at a CAGR of 6.6% |
| Market growth 2025-2029 | USD 2115.8 million |
| Market structure | Fragmented |
| YoY growth 2024-2025(%) | 6.2% |
| Key countries | US, Canada, Mexico, Germany, UK, France, Italy, Spain, The Netherlands, China, India, Japan, South Korea, Australia, Indonesia, Brazil, Argentina, Chile, Saudi Arabia, UAE, South Africa, Egypt and Nigeria |
| Competitive landscape | Leading Companies, Market Positioning of Companies, Competitive Strategies, and Industry Risks |
Research Analyst Overview
- The recovery drinks market is advancing beyond simple hydration, now emphasizing scientifically-backed formulations designed to optimize physiological recovery. Central to this evolution is the focus on muscle glycogen replenishment and stimulating muscle protein synthesis through a precise essential amino acid profile.
- Boardroom decisions increasingly center on R&D investment in novel ingredients, such as plant-based protein sources and micellar casein, to capture diverse consumer segments. The efficacy of these products is measured by their ability to accelerate post-exercise rehydration and restore electrolyte balance. Innovations in formulation science, such as achieving a specific carbohydrate-to-protein ratio and improving osmolality optimization, are critical for differentiation.
- Development of a new powder-based product using advanced processing techniques has been shown to improve bioavailability enhancement by over 15%. Brands are leveraging anti-inflammatory compounds like tart cherry extract and the turmeric curcumin complex, alongside adaptogenic herbs and collagen peptides, to address exercise-induced muscle damage and delayed onset muscle soreness.
- The push for clean label formulation means prioritizing natural sweeteners and avoiding artificial additives, a key factor in consumer trust. Ultimately, success hinges on delivering a product with rapid nutrient absorption, backed by a commitment to functional ingredient fortification and a clear strategy to mitigate oxidative stress reduction through ingredients like whey protein isolate.
What are the Key Data Covered in this Recovery Drinks Market Research and Growth Report?
-
What is the expected growth of the Recovery Drinks Market between 2025 and 2029?
-
USD 2.12 billion, at a CAGR of 6.6%
-
-
What segmentation does the market report cover?
-
The report is segmented by Formulation (Powder, RTD), Product Type (Protein-based drinks, Carbohydrate-based drinks, Electrolyte drinks), End-user (Athletes, Fitness enthusiasts, Medical patients) and Geography (North America, Europe, APAC, South America, Middle East and Africa)
-
-
Which regions are analyzed in the report?
-
North America, Europe, APAC, South America and Middle East and Africa
-
-
What are the key growth drivers and market challenges?
-
Increasing consumption among millennials, Stringent laws associated with recovery drinks in certain countries
-
-
Who are the major players in the Recovery Drinks Market?
-
Abbott Laboratories, Ascent Protein, BioSteel Sports Nutrition Inc., Celsius Holdings Inc., Fluid Sports Nutrition, GU Energy Labs, Hammer Nutrition, Harmless Harvest Inc., Mountain Fuel, PacificHealth Labs, PepsiCo Inc., Rakyan Beverages Pvt. Ltd., RECOVER 180, Red Bull GmbH, Skratch Labs LLC, Smartfish AS, Suntory Beverage and Food Ltd. and The Coca Cola Co.
-
Market Research Insights
- The market is defined by a dynamic interplay of consumer wellness trends and scientific innovation, with an annual growth rate of 6.2%. The demand for functional hydration and sports nutrition beverage options is expanding, driven by a consumer base increasingly educated on the post-workout nutrition window.
- Formulations are shifting towards vegan recovery options and low-sugar recovery drinks, reflecting broader dietary trends. This evolution is not uniform globally; the APAC region shows the fastest expansion, with a growth rate over 2% higher than that of more mature markets in the Middle East and Africa.
- Success hinges on creating differentiated products that offer tangible benefits like immune system support and sustained energy release, meeting the sophisticated needs of the modern consumer.
We can help! Our analysts can customize this recovery drinks market research report to meet your requirements.
 RIA -
RIA - 
