
Refrigerants Market Size 2025-2029
The refrigerants market is projected to grow, reaching approximately USD 9.2 billion by 2029, exhibiting a CAGR of around 6.2% throughout the forecast period. This growth is primarily driven by the expanding application of refrigerants in refrigeration and air conditioning systems across various industries.
The refrigerants market is experiencing growth due to the increasing demand for efficient cooling solutions in diverse sectors, including automotive, industrial, and commercial refrigeration. The growing pharmaceutical industry, which relies on precise temperature control for the storage and transportation of drugs, is a significant driver. Moreover, the shift towards eco-friendly refrigerants, spurred by stringent environmental regulations, is creating new opportunities. However, challenges such as the illegal trade of refrigerants and flammability issues need to be addressed to ensure sustainable market expansion. The market is also seeing trends such as increasing demand for natural refrigerants like ammonia and carbon dioxide, which offer lower global warming potential (GWP).
To access the full market forecast and comprehensive analysis, Buy Now
How is this market segmented?

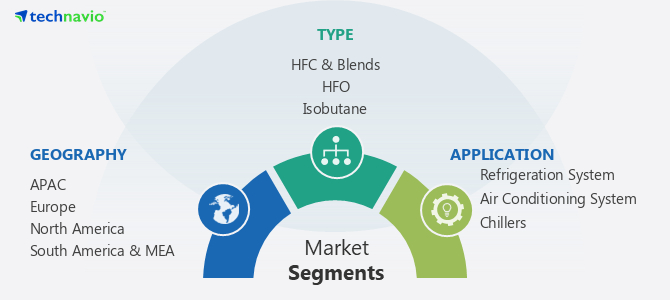
The market research report provides comprehensive data (region-wise segment analysis), with forecasts and estimates in USD bn for the period 2025-2029, as well as historical data from 2019-2024 for the following segments:
- Type
- HFC & Blends
- HFO
- Isobutane
- Propane
- Ammonia
- Carbon Dioxide
- Application
- Refrigeration System
- Air Conditioning System
- Chillers
- Mobile Air Conditioning
- APAC
- China
- India
- Japan
- Australia
- Rest of APAC
- Germany
- Spain
- Italy
- UK
- Rest of Europe
- US
- Canada
- Brazil
- UAE
- South Africa
- Others
- Type
- HFO: The HFO segment is projected to grow rapidly, driven by their low global warming potential (GWP) and increasing adoption as a sustainable alternative.
- Ammonia: The Ammonia segment is expected to maintain a significant share, particularly in industrial refrigeration applications.
- Propane: The Propane segment is anticipated to expand, propelled by its environmental benefits and suitability for commercial refrigeration.
- Isobutane: The Isobutane segment is expected to see steady growth due to its energy efficiency and use in domestic refrigeration.
- HFC & Blends: The HFC & Blends segment is expected to remain dominant due to their widespread use in refrigeration and air conditioning, despite increasing regulations.
- Carbon Dioxide: The Carbon Dioxide segment is set to expand due to its use as a natural refrigerant in supermarkets and food processing industries.
- Application
- Chillers: Chillers are used in various industrial and commercial settings for cooling processes and climate control.
- Refrigeration System: This segment is divided into domestic, industrial, and commercial refrigeration, with applications ranging from household preservation to industrial plant cooling.
- Air Conditioning System: This segment includes window, split, variable refrigerant flow (VRF), and ducted/packaged/rooftop ACs, catering to residential and commercial cooling needs.
- Mobile Air Conditioning: This segment focuses on air conditioning systems in vehicles, driven by the automotive industry.
Regional Analysis
- APAC: The Asia Pacific region is expected to lead the refrigerants market due to increasing demand from the automotive and electronics industries. Growth is driven by the increasing consumption of refrigeration and AC equipment in commercial buildings and supermarkets. China and India are experiencing high demand for inorganic refrigerants due to the phase-out of HCFCs and HFCs.
- Europe: Europe is driven by stringent regulations and a focus on environmentally friendly solutions. The demand for low-GWP refrigerants is increasing due to the phase-down of fluorinated gases. Germany and the UK are at the forefront of adopting natural refrigerants and energy-efficient cooling technologies.
- North America: North America is characterized by a strong demand from the automotive and industrial sectors. The region is influenced by regulations promoting the use of refrigerants with lower environmental impact. The US and Canada are witnessing increasing adoption of HFOs and other alternative refrigerants.
- South America & MEA: South America and the Middle East & Africa offer emerging opportunities for the refrigerants market. Brazil is experiencing economic growth and rising demand for refrigeration and air conditioning systems. The UAE is becoming a key market due to investments in infrastructure and commercial development.
Market Dynamics
Our refrigerants market researchers analyzed the data with 2024 as the base year, along with the key drivers, trends, and challenges. A holistic analysis of drivers will help companies refine their marketing strategies to gain a competitive advantage.
What are the key market drivers leading to the rise in adoption of refrigerants market?
The growing pharmaceutical industry and increasing demand for consumer appliances are key drivers of the refrigerants market. The pharmaceutical industry's stringent requirements for low-temperature conditions during drug transport and storage are significantly boosting the demand for refrigerants. As the focus on biologics, specialty pharmaceuticals, insulin products, and vaccines increases, so does the need for reliable refrigeration in developing Asian economies. The rapid expansion of pharmaceutical sectors in emerging markets like Brazil, China, and India is expected to further drive refrigerant demand, shifting research activities from Europe to these regions.
What are the market trends shaping the refrigerants market?
Increasing demand for natural refrigerants is a significant trend in the refrigerants market. The global demand for environmentally friendly cooling solutions is propelling growth in the refrigerants market. Executive GWP regulations, enhanced environmental awareness, and the increasing need for sustainable cold solutions across multiple sectors are driving this trend. The food processing sector, cold storage facilities, and retail operations are fast-tracking the implementation of natural refrigerants to meet sustainability requirements and reduce their environmental impact. Natural refrigerants like carbon dioxide, ammonia, and hydrocarbons offer low GWP and aggressive ODP profiles, making them suitable alternatives to synthetic refrigerants in industrial applications.
What challenges does the refrigerants market face?
Flammability and toxicity issues, along with illegal trade of refrigerants, present key challenges for the refrigerants market. Refrigerants such as ammonia, carbon dioxide, and hydrocarbons present flammability, corrosiveness, and toxicity concerns at higher concentrations, posing significant challenges to market growth. Ammonia can corrode copper, necessitating the use of steel-based refrigeration systems, which increases initial costs. The safety precautions associated with ammonia and carbon dioxide are more stringent than those for fluorinated refrigerant gases. Carbon dioxide's tendency to solidify into dry ice requires special valves to prevent this conversion, adding complexity to system design.
Key Companies & Market Insights
Leading companies are implementing strategies such as product innovations, acquisitions, and geographic expansions to enhance their market position. Key players in the refrigerants market include:
- Arkema S.A.
- Daikin Industries Ltd.
- Honeywell International Inc.
- The Chemours Company
- The Linde Group
These companies are strategically focused on product development, market expansion, and partnerships to maintain their competitive edge in the growing refrigerants market.
|
Market Scope |
|
|
Report Coverage |
Details |
| Base year | 2024 |
| Page number | 198 |
| Key countries | China, India, US, Germany, UK |
| Forecast period | 2025-2029 |
| Historic period | 2019-2023 |
| Report coverage | Market size, forecasts, segmentation |
| Regional Analysis | APAC
|
| Growth momentum and CAGR | 6.2% |
| Performing market contribution | Europe, APAC, North America |
 RIA -
RIA - 
