
Reinsurance Market Size 2026-2030
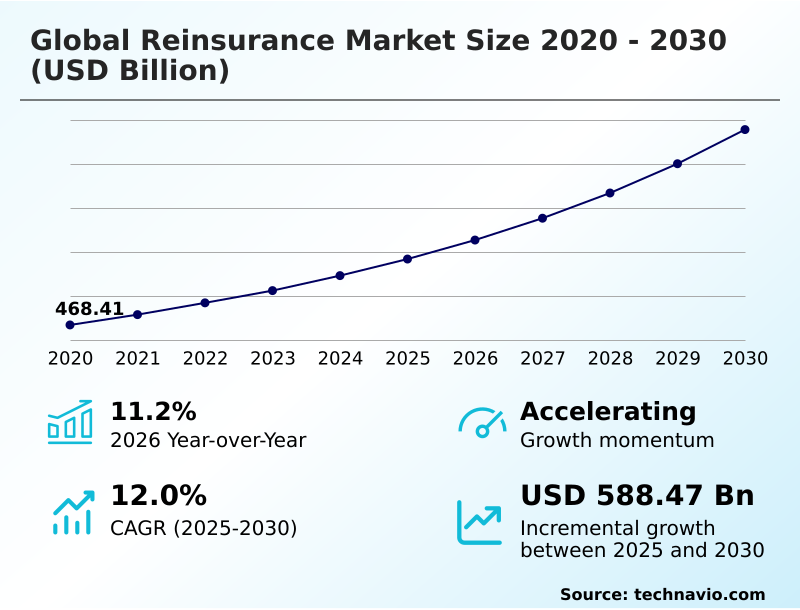
The reinsurance market size is valued to increase by USD 588.47 billion, at a CAGR of 12% from 2025 to 2030. Rising demand for catastrophe protection and climate resilience will drive the reinsurance market.
Major Market Trends & Insights
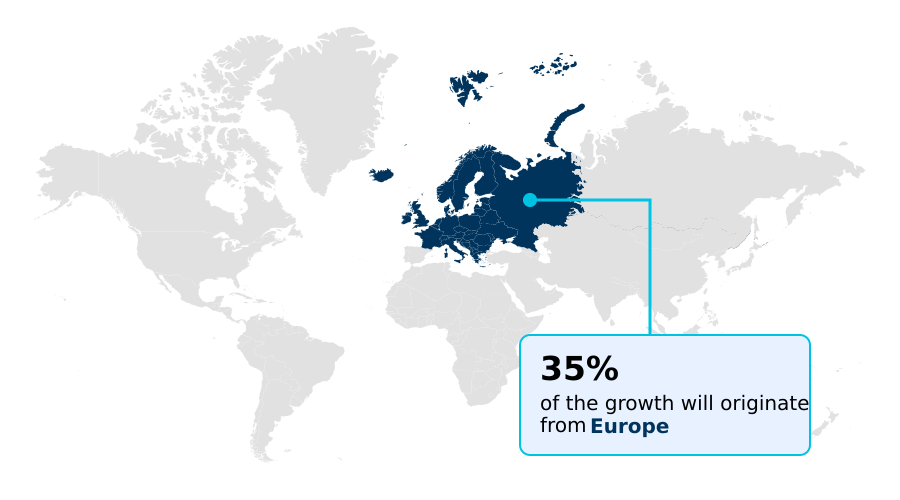
- Europe dominated the market and accounted for a 34.6% growth during the forecast period.
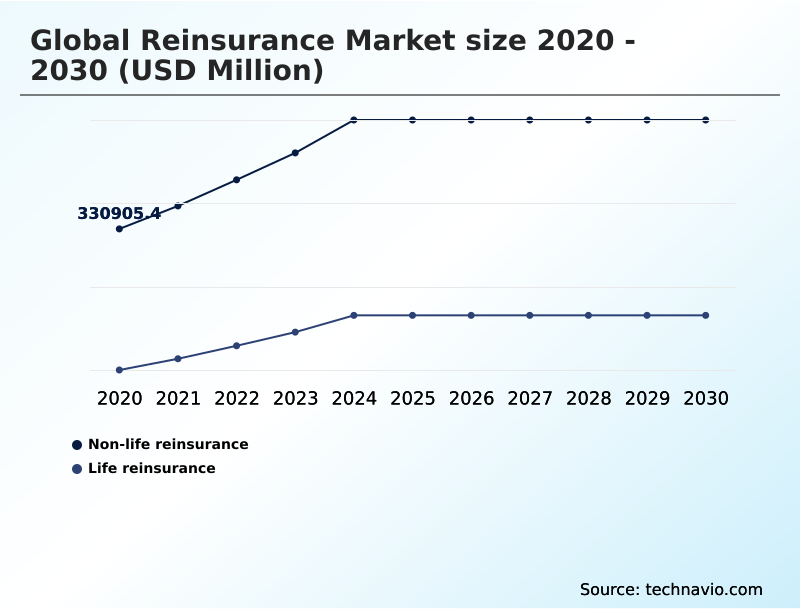
- By Product - Non-life reinsurance segment was valued at USD 480.21 billion in 2024
- By Type - Facultative reinsurance segment accounted for the largest market revenue share in 2024
Market Size & Forecast
- Market Opportunities: USD 888.06 billion
- Market Future Opportunities: USD 588.47 billion
- CAGR from 2025 to 2030 : 12%
Market Summary
- The reinsurance market is defined by its role in absorbing complex and large-scale risks for primary insurers, enabling economic stability. Growth is driven by an increasing need for financial protection against severe natural catastrophes and emerging man-made threats like widespread cyber-attacks.
- Key trends include the rapid adoption of digital underwriting platforms and predictive analytics in underwriting to refine risk selection and pricing accuracy. However, the sector faces challenges from the heightened frequency of secondary perils and the economic impact of social inflation on liability costs, which strain traditional risk assessment models.
- For instance, a primary insurer looking to expand into a catastrophe-prone region relies on treaty reinsurance to manage its capital adequacy ratios. This partnership, built on sophisticated catastrophe modeling and risk transfer mechanisms, allows the insurer to launch new products with confidence, knowing its balance sheet is protected from extreme loss events, thereby facilitating market entry and business growth.
- This strategic use of reinsurance capacity is fundamental to navigating an increasingly volatile risk landscape.
What will be the Size of the Reinsurance Market during the forecast period?
Get Key Insights on Market Forecast (PDF) Get Free Sample
How is the Reinsurance Market Segmented?
The reinsurance industry research report provides comprehensive data (region-wise segment analysis), with forecasts and estimates in "USD million" for the period 2026-2030, as well as historical data from 2020-2024 for the following segments.
- Product
- Non-life reinsurance
- Life reinsurance
- Type
- Facultative reinsurance
- Treaty reinsurance
- Distribution channel
- Broker-mediated
- Direct writing
- Geography
- Europe
- Germany
- UK
- France
- APAC
- China
- Japan
- India
- North America
- US
- Canada
- Mexico
- Middle East and Africa
- South Africa
- Saudi Arabia
- UAE
- South America
- Brazil
- Argentina
- Rest of World (ROW)
- Europe
By Product Insights
The non-life reinsurance segment is estimated to witness significant growth during the forecast period.
The non-life reinsurance segment is central to the international financial architecture, providing essential reinsurance capacity for property and casualty risks.
Firms in this space have sharpened their underwriting discipline to manage a complex landscape defined by heightened catastrophe activity and inflationary pressures, reflected in a sector-wide achievement of a favorable combined ratio of 79.4%.
To maintain technical profitability, the focus has shifted to robust risk assessment models and a re-evaluation of peak peril exposure.
This strategic adjustment involves implementing higher attachment points and more stringent terms in a proportional basis structure, which redefines risk-sharing boundaries.
The growth of the non-life reinsurance portfolio is further supported by the expansion of specialty reinsurance lines and the integration of esg integration in reinsurance criteria into underwriting, ensuring capital is allocated effectively amid evolving vulnerabilities.
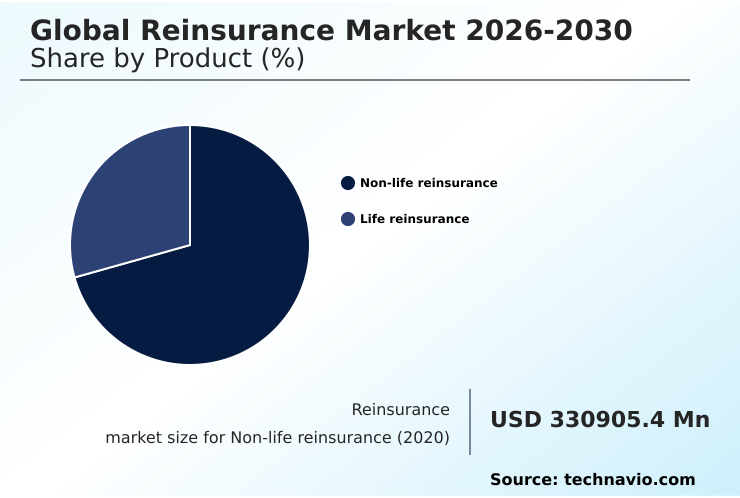
The Non-life reinsurance segment was valued at USD 480.21 billion in 2024 and showed a gradual increase during the forecast period.
Regional Analysis
Europe is estimated to contribute 34.6% to the growth of the global market during the forecast period.Technavio’s analysts have elaborately explained the regional trends and drivers that shape the market during the forecast period.
See How Reinsurance Market Demand is Rising in Europe Get Free Sample
The geographic landscape of the reinsurance market is diversifying, with mature and emerging regions presenting distinct opportunities. Europe is projected to contribute 34.6% of the market's incremental growth, with the APAC region following closely at 34.16%.
In North America, the focus is on managing complex property risks and large-scale in-force block transactions in the life and health reinsurance sector.
In APAC, the implementation of new risk-based capital regimes is driving demand for more sophisticated treaty reinsurance and facultative reinsurance solutions to manage solvency margins.
Across all regions, the role of reinsurance broker relationships is crucial for facultative risk placement and securing capacity.
This dynamic capital allocation, supported by robust reinsurance treaty structuring, helps cedants optimize portfolio diversification and manage both mortality risk and longevity risk exposures effectively.
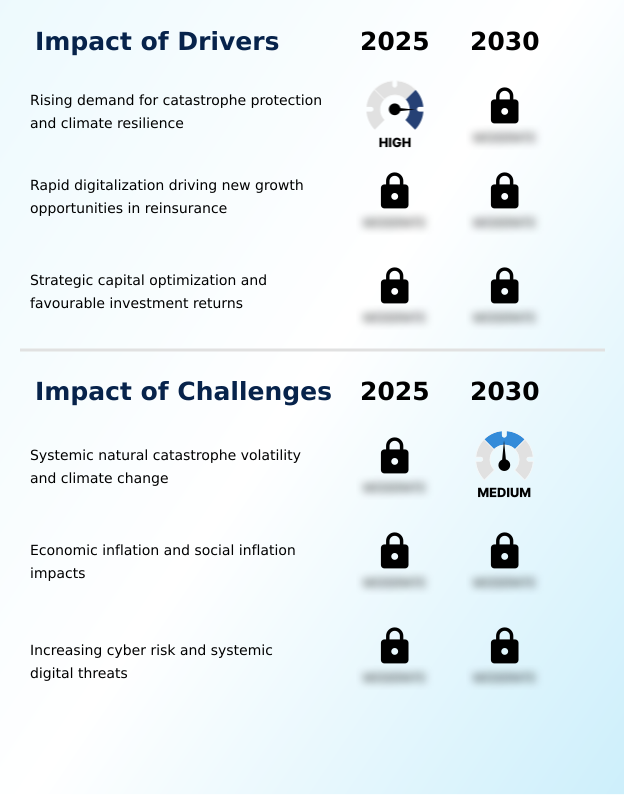
Market Dynamics
Our researchers analyzed the data with 2025 as the base year, along with the key drivers, trends, and challenges. A holistic analysis of drivers will help companies refine their marketing strategies to gain a competitive advantage.
- The reinsurance market is undergoing a significant strategic evolution, driven by the need for greater financial resilience and precision in risk management. A core focus is on achieving capital efficiency in property casualty reinsurance, where firms are moving beyond traditional methods.
- The digital transformation in underwriting workflow is central to this shift, enabling better modeling of secondary perils in underwriting and improving reserving accuracy for liability exposures. Firms adopting these advanced analytical tools have demonstrated an ability to reduce loss adjustment expenses by up to 15% compared to peers relying on legacy systems.
- Concurrently, the market is adapting its risk transfer mechanisms. The use of ils for catastrophe risk transfer and alternative capital for peak peril exposure is becoming standard practice. For climate-related events, parametric triggers in climate adaptation offer rapid liquidity. On the liability side, understanding the social inflation impact on casualty lines is critical for treaty reinsurance pricing discipline.
- Specialized risks are being addressed through facultative reinsurance for specialty risks and sophisticated cyber risk accumulation modeling techniques. In the life sector, firms are actively managing longevity risk with reinsurance and pursuing life reinsurance in-force block acquisitions. Structurally, companies are optimizing retrocession for capital relief and employing non-proportional treaty structuring for volatility management, ensuring balance sheet optimization through reinsurance.
- The role of brokers in facultative placement and the integration of esg criteria in reinsurance investment further underscore the market's maturation and adherence to new solvency requirements under new regimes.
What are the key market drivers leading to the rise in the adoption of Reinsurance Industry?
- The rising demand for catastrophe protection and enhanced climate resilience is a key driver propelling market growth.
- Market growth is propelled by escalating demand for protection and a strategic focus on financial efficiency.
- The increasing frequency of extreme weather events necessitates sophisticated climate change risk assessment and catastrophe modeling, with insured losses from secondary perils rising by over 50% in the last decade. This has intensified the need for robust risk transfer mechanisms.
- In response, firms are prioritizing reinsurance capital optimization and dynamic capital allocation to strengthen balance sheets. This disciplined approach has contributed to a 10% year-over-year improvement in net income for top-tier reinsurers.
- The integration of digital tools enhances interactions between the cedant and reinsurer, enabling the creation of structured reinsurance solutions. Furthermore, the market benefits from third-party capital management, which provides supplementary capacity and reinforces reinsurance market dynamics.
What are the market trends shaping the Reinsurance Industry?
- A key trend shaping the market is the accelerated integration of artificial intelligence and advanced data analytics. This shift is enhancing operational efficiencies and underwriting precision.
- Market trends are centered on technological innovation and the expansion of capital sources. The adoption of digital underwriting platforms, which leverage predictive analytics in underwriting, has enabled firms to improve risk selection accuracy by up to 20%. This has been crucial for emerging risk identification. Concurrently, the market is diversifying beyond traditional capital with alternative risk transfer solutions.
- The insurance-linked securities market has seen issuance volumes increase by over 15% in a single year, with reinsurance sidecar vehicles and collateralized reinsurance providing additional capacity. For cedants, this evolution offers new avenues for managing complex exposures, from pension risk transfer to systemic risk.
- Innovations in parametric insurance are streamlining claims processing, while enhanced actuarial expertise is driving the development of more sophisticated and responsive risk models.
What challenges does the Reinsurance Industry face during its growth?
- Systemic natural catastrophe volatility, exacerbated by climate change, presents a key challenge affecting industry growth.
- The market confronts significant headwinds from interconnected and evolving risks. A primary challenge is managing systemic risk, particularly from widespread cyber threats, which has led to a 40% spike in demand for specialized cyber risk reinsurance. Simultaneously, persistent social inflation is elevating liability costs, complicating reserving accuracy and increasing loss adjustment expenses.
- This has forced reinsurers to adjust their risk appetite and implement higher attachment points, shifting more of the initial loss burden to primary insurers. These pressures are reflected in global reinsurance pricing trends and have intensified reinsurance renewal negotiations, with some complex renewals taking 30% longer to finalize.
- Navigating this landscape requires strict adherence to reinsurance regulatory compliance and a disciplined approach to pricing risks on a non-proportional basis.
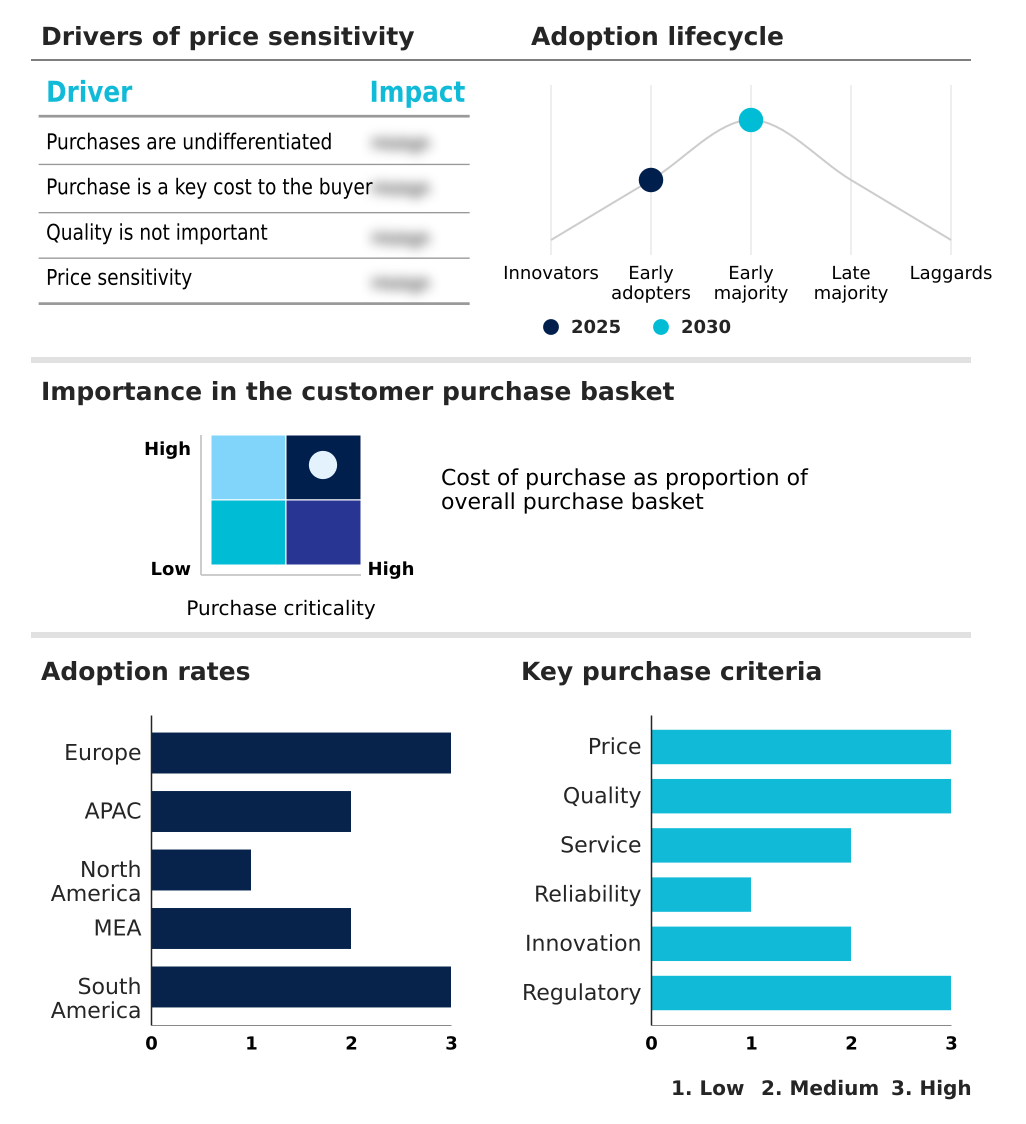
Exclusive Technavio Analysis on Customer Landscape
The reinsurance market forecasting report includes the adoption lifecycle of the market, covering from the innovator’s stage to the laggard’s stage. It focuses on adoption rates in different regions based on penetration. Furthermore, the reinsurance market report also includes key purchase criteria and drivers of price sensitivity to help companies evaluate and develop their market growth analysis strategies.
Customer Landscape of Reinsurance Industry
Competitive Landscape
Companies are implementing various strategies, such as strategic alliances, reinsurance market forecast, partnerships, mergers and acquisitions, geographical expansion, and product/service launches, to enhance their presence in the industry.
Barents Re Reinsurance Co. Inc. - Leading entities provide tailored reinsurance for property catastrophe, specialty lines, and alternative risk transfer, focusing on complex risk management and capital solutions.
The industry research and growth report includes detailed analyses of the competitive landscape of the market and information about key companies, including:
- Barents Re Reinsurance Co. Inc.
- Convex Group Ltd
- Everest Group Ltd.
- General Reinsurance Corp
- Hannover Re
- Hiscox Re and ILS
- Liberty Mutual Re
- MAPFRE RE
- Markel Corp.
- MS Amlin
- Munich Reinsurance Co.
- Odyssey Group Holdings Inc.
- QBE Re
- Reinsurance Group of America
- SiriusPoint Ltd.
- Sompo International Holdings
- Swiss Re Ltd.
- The Toa Reinsurance Co
- Transatlantic Holdings Inc.
Qualitative and quantitative analysis of companies has been conducted to help clients understand the wider business environment as well as the strengths and weaknesses of key industry players. Data is qualitatively analyzed to categorize companies as pure play, category-focused, industry-focused, and diversified; it is quantitatively analyzed to categorize companies as dominant, leading, strong, tentative, and weak.
Recent Development and News in Reinsurance market
- In February 2025, Swiss Re launched a new digital underwriting platform using artificial intelligence and machine learning to provide clients with faster and more accurate risk assessments.
- In February 2025, Reinsurance Group of America completed a significant transaction by deploying USD 1.5 billion of capital to reinsure a USD 32 billion block of life policies from Equitable.
- In February 2025, Sompo International announced a strategic reorganization to integrate its global insurance and reinsurance businesses into a single P&C segment, aiming to streamline worldwide capabilities.
- In May 2025, General Insurance Corporation of India reported that a significant aviation claim of approximately USD 475 million prompted intensified scrutiny on aviation risk and reinsurance pricing.
Dive into Technavio’s robust research methodology, blending expert interviews, extensive data synthesis, and validated models for unparalleled Reinsurance Market insights. See full methodology.
| Market Scope | |
|---|---|
| Page number | 287 |
| Base year | 2025 |
| Historic period | 2020-2024 |
| Forecast period | 2026-2030 |
| Growth momentum & CAGR | Accelerate at a CAGR of 12% |
| Market growth 2026-2030 | USD 588472.8 million |
| Market structure | Fragmented |
| YoY growth 2025-2026(%) | 11.2% |
| Key countries | Germany, UK, Switzerland, France, Italy, The Netherlands, China, Japan, India, South Korea, Singapore, Australia, US, Canada, Mexico, South Africa, Saudi Arabia, UAE, Nigeria, Egypt, Brazil, Argentina and Chile |
| Competitive landscape | Leading Companies, Market Positioning of Companies, Competitive Strategies, and Industry Risks |
Research Analyst Overview
- The reinsurance market is navigating a complex environment by prioritizing underwriting discipline and technical profitability. A key trend is the strategic pivot towards advanced risk assessment models, which has enabled leading firms to reduce claims processing times by over 25%. This operational efficiency directly impacts boardroom decisions on capital allocation, allowing for more dynamic deployment into high-growth areas.
- The sector’s resilience is built on a sophisticated blend of risk transfer mechanisms, including traditional treaty reinsurance and facultative reinsurance, alongside innovative insurance-linked securities and parametric insurance solutions. To manage exposures, firms are refining their risk appetite, utilizing higher attachment points to mitigate the impact of secondary perils and social inflation on liability costs.
- Balance sheet optimization is achieved through careful management of capital adequacy ratios and solvency margins, often involving retrocession and collateralized reinsurance. For life insurers, managing mortality risk and longevity risk through in-force block transactions is crucial.
- This focus on fundamentals, from improving reserving accuracy to diversifying portfolios, ensures the market can provide stable reinsurance capacity despite systemic risk and volatile peak peril exposure.
What are the Key Data Covered in this Reinsurance Market Research and Growth Report?
-
What is the expected growth of the Reinsurance Market between 2026 and 2030?
-
USD 588.47 billion, at a CAGR of 12%
-
-
What segmentation does the market report cover?
-
The report is segmented by Product (Non-life reinsurance, and Life reinsurance), Type (Facultative reinsurance, and Treaty reinsurance), Distribution Channel (Broker-mediated, and Direct writing) and Geography (Europe, APAC, North America, Middle East and Africa, South America)
-
-
Which regions are analyzed in the report?
-
Europe, APAC, North America, Middle East and Africa and South America
-
-
What are the key growth drivers and market challenges?
-
Rising demand for catastrophe protection and climate resilience, Systemic natural catastrophe volatility and climate change
-
-
Who are the major players in the Reinsurance Market?
-
Barents Re Reinsurance Co. Inc., Convex Group Ltd, Everest Group Ltd., General Reinsurance Corp, Hannover Re, Hiscox Re and ILS, Liberty Mutual Re, MAPFRE RE, Markel Corp., MS Amlin, Munich Reinsurance Co., Odyssey Group Holdings Inc., QBE Re, Reinsurance Group of America, SiriusPoint Ltd., Sompo International Holdings, Swiss Re Ltd., The Toa Reinsurance Co and Transatlantic Holdings Inc.
-
Market Research Insights
- The dynamics of the reinsurance market are shaped by a dual focus on capital efficiency and advanced risk management. Firms are achieving a return on equity of 21.0% through disciplined reinsurance capital optimization and strategic asset liability management.
- The adoption of digital underwriting platforms is a key enabler, allowing for more precise climate change risk assessment and the development of structured reinsurance solutions. This technological shift supports a favorable combined ratio of 79.4% in property and casualty reinsurance. Managing emerging risks requires specialized approaches, with growing demand for cyber risk reinsurance and alternative risk transfer solutions.
- Simultaneously, the non-life reinsurance portfolio is being refined to address new exposures, while the life and health reinsurance segment explores innovative products to manage longevity. This strategic evolution ensures resilience and profitability.
We can help! Our analysts can customize this reinsurance market research report to meet your requirements.
 RIA -
RIA - 
