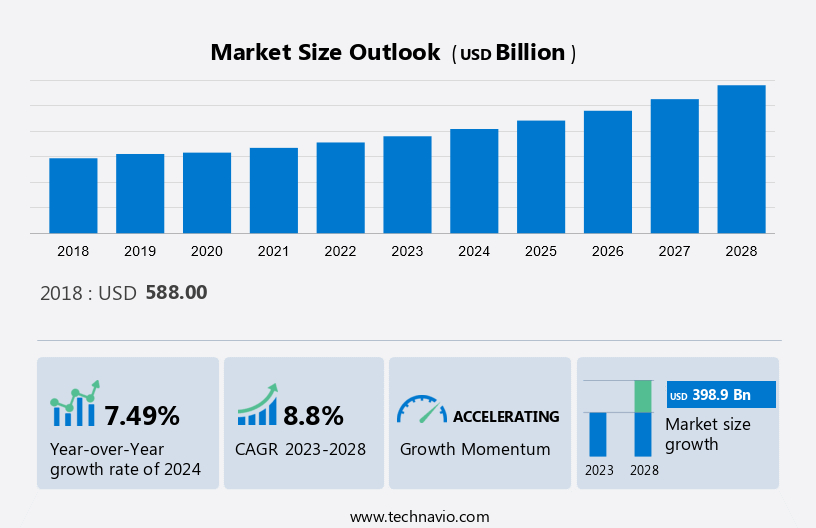
Reverse Logistics Market Size 2024-2028
The reverse logistics market is estimated to increase by USD 398.9 billion and grow at a CAGR of 8.8% between 2023 and 2028. Market growth is contingent upon various factors, such as the expansion of the e-commerce sector, the uptick in cross-border trade, and the rising adoption of multimodal transport solutions. However, challenges such as elevated operational expenses, limited control by manufacturers over reverse logistics services, and the potential for product recalls may serve as impediments to growth. These factors collectively shape the trajectory of market development, reflecting a balance between opportunities and obstacles within the logistics and transportation industry. While the surge in e-commerce activities and cross-border trade presents avenues for market expansion, addressing challenges related to cost management, reverse logistics efficiency, and product quality assurance is essential for sustained growth and competitiveness. Thus, the interplay of market drivers and inhibitors delineates the landscape for the anticipated evolution of the industry.
What will be the size of the Market During the Forecast Period?
To learn more about this report, Download Report Sample
Market Segmentation
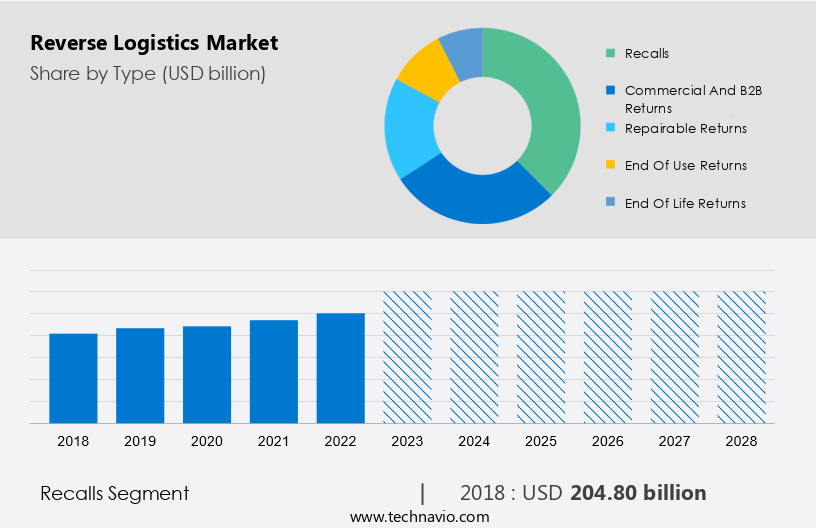
By Type
The market share growth of the recalls segment will be significant during the forecast period. The market encompasses the process of managing product recalls, which is a critical aspect of reverse logistics. Companies must adhere to stringent product quality standards and respond promptly to recalls due to defects or errors in production. This market is significantly influenced by e-commerce and online shopping trends, as well as retail sales. Therefore, a rise in the number of recalls will drive market growth during the forecast period.
Get a glance at the market contribution of various segments Request a PDF Sample
The recalls segment was valued at USD 204.80 billion in 2018. Product recalls impact various sectors, including consumer electronics, healthcare, clothing, footwear, home décor, and spare parts. Efficiency and reachability are essential in reverse logistics, achieved through automation, robotics, and augmented reality. Warehousing capabilities, lead time, and recall returns are crucial factors. B2B and commercial returns, repairable returns, end-of-use returns, and end-of-life returns are integral to the circular economy and sustainability efforts. Environmental responsibility and carbon footprint reduction are key considerations. The market includes repair and return services, reconditioned products, and reselling platforms. Transportation and replacement management are also essential components. Overall, this plays a vital role in ensuring consumer satisfaction, product safety, and reducing waste. Hence, the growth of the recalls segment of the industry will concurrently propel the growth of the market during the forecast period.
By Region
For more insights on the market share of various regions Request PDF Sample now!
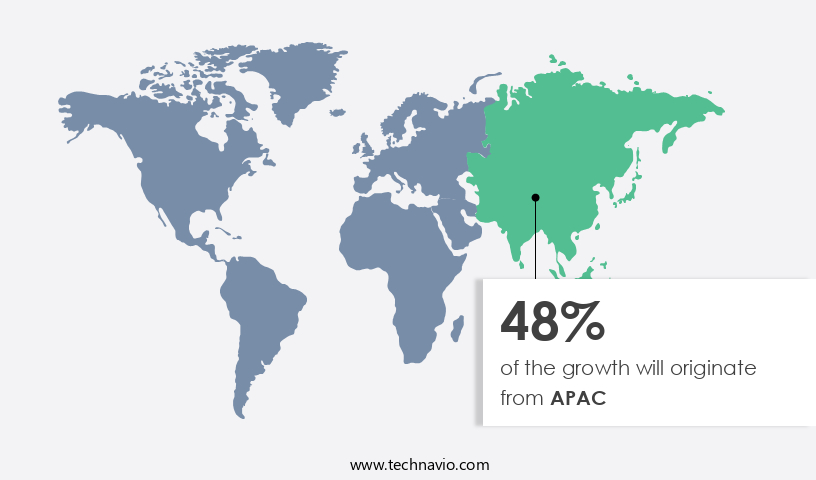
APAC is estimated to contribute 48% to the growth of the global market during the forecast period. Technavio’s analysts have elaborately explained the regional trends and drivers that shape the market during the forecast period. The market in APAC is experiencing significant growth due to the expanding consumer base for food and beverage, as well as healthcare product suppliers. With rising disposable incomes and an aging population in countries like Japan and China, healthcare expenditures are increasing at robust rates. This trend is driving up demand for temperature-controlled healthcare products, such as biopharmaceuticals, vaccines, and clinical trial materials. Additionally, the surge in demand for organic food products in countries like China, Australia, and New Zealand, fueled by the availability of certified organic dairy products and health-conscious consumers, is boosting the demand for cold chain logistics from the healthcare and food industries. This logistics solution ensures the maintenance of product shelf life and quality. In the context of car subscription services, the efficient management of reverse logistics for the return, repair, and disposal of vehicles can contribute to cost savings and operational efficiency. Such benefits of cold chain logistics will increase its demand, which, in turn, will lead to the growth of the market in this region during the forecast period.
Market Dynamics and Customer Landscape
In the dynamic world of retail, product recalls have become an unfortunate reality for both manufacturers and retailers. The Ecommerce sector, a significant contributor to online sales and retail sales, has seen a surge in unwanted purchases, leading to the need for efficient reverse logistics. This is a critical component of the digital transformation in retail, encompassing automation, robotics, augmented reality, and IoT. It ensures supply chain efficiency by managing the disposal of returned products, implementing traceability and transparency through blockchain and data analytics. Manufacturers seek control over the reverse logistics process, while third-party reverse logistics providers offer cost-effective solutions. Confidentiality is paramount in this process, with invoices and freight bill audits requiring careful handling. Radio-frequency identification (RFID) and Bluetooth technologies enable real-time tracking and streamline the reverse logistics process. Value recovery is a key focus, with direct returns to retail stores and e-commerce platforms becoming increasingly common. In conclusion, the market plays a pivotal role in maintaining product quality standards and ensuring customer satisfaction in the ecommerce sector. It is an essential aspect of the retail industry's ongoing digital transformation.
Key Market Driver
The growing e-commerce industry is notably driving market growth. The e-commerce sector's expansion, driven by the proliferation of the Internet and smartphones, particularly in large markets like the US and China, results in increased product sales and online shopping. However, this growth also leads to an escalating need for reverse logistics, which encompasses product recalls, unwanted purchases, and various types of returns. These include B2B, commercial, repairable, end-of-use, and end-of-life returns. Reverse logistics involves the handling, transportation, and warehousing of returned products. To enhance efficiency and reachability, automation, robotics, and augmented reality technologies are being employed.
Further, warehousing capabilities, lead time, and recall returns are crucial factors Brands must adhere to product quality standards and ensure sustainability and environmental responsibility, as consumers increasingly demand circular economy practices. This includes repair and return services, reconditioning, reselling, and refund management. Industries such as consumer electronics, healthcare, clothing, footwear, home décor, and spare parts are significant contributors to the market. Thus, the rapid growth of e-commerce will simultaneously contribute to the growth of the market during the forecast period.
Significant Market Trend
The use of blockchain with logistics is the primary trend in the market. Blockchain technology plays a significant role in the market by enhancing transparency and traceability in product recalls and returns. This decentralized system enables the tracking of products from their origin to their end-of-life, ensuring adherence to product quality standards in various industries, including ecommerce, retail, and consumer electronics. By automating and streamlining processes through robotics, augmented reality, and recall returns management, businesses can improve efficiency, reachability, and warehousing capabilities.
Additionally, blockchain technology supports sustainability efforts by promoting a circular economy, reducing commercial returns, and managing repair and return processes for reconditioned items. Key sectors benefiting from this technology include B2B returns, repairable returns, end-of-use returns, and end-of-life returns in industries such as healthcare, clothing, electronic devices, footwear, home décor, and spare parts. Ultimately, blockchain technology helps reduce the carbon footprint and promotes environmental responsibility in reverse logistics operations. Such developments will lead to the growth of the market during the forecast period.
Major Market Challenge
High operational costs are the major challenge impeding market growth. The market faces challenges due to rising operational costs, particularly in areas such as product recalls and unwanted purchases. Factors including a shortage of skilled labor, fuel price increases, and volatility in crude oil prices contribute to these costs. Developing countries, like India, experience higher logistics costs than developed nations.
Key industries, such as consumer electronics, healthcare, clothing, and footwear, are impacted by these trends. To enhance efficiency and reachability, automation through robotics and augmented reality is being adopted. Warehousing capabilities, lead time, and recall returns are crucial considerations. Sustainability and environmental responsibility are also important, with a focus on circular economy, repair and return, reconditioned goods, and reselling. B2B and commercial returns, as well as repairable, end-of-use, and end-of-life returns, are integral to the reverse logistics process. Such factors are likely to limit the growth of the market during the forecast period.
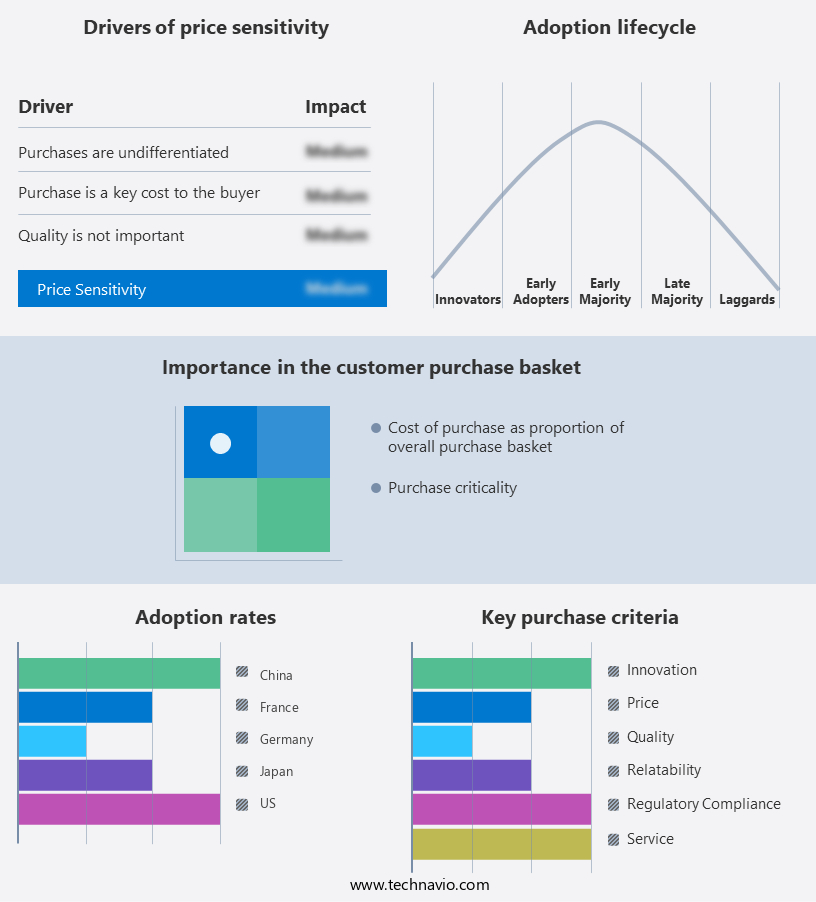
Key Market Customer Landscape
The report includes the adoption lifecycle of the market, covering from the innovator’s stage to the laggard’s stage. It focuses on adoption rates in different regions based on penetration. Furthermore, the report also includes key purchase criteria and drivers of price sensitivity to help companies evaluate and develop their growth strategies.
Global Market Customer Landscape
Who are the Major Market Players?
Companies are implementing various strategies, such as strategic alliances, partnerships, mergers and acquisitions, geographical expansion, and product/service launches, to enhance their presence in the market.
Aramex International LLC - The company offers reverse logistics such as Aramex E-commerce solutions.
The report also includes detailed analyses of the competitive landscape of the market and information about 15 market companies, including:
- Blue Dart Express Ltd.
- C H Robinson Worldwide Inc.
- CMA CGM SA
- Core Logistic Pvt. Ltd
- Deutsche Post AG
- DTDC Express Ltd.
- Ecom Express Pvt. Ltd.
- FedEx Corp.
- First Flight Courier Ltd.
- GXO Logistics Inc.
- Happy Returns LLC
- Kintetsu Group Holdings Co. Ltd.
- Nippon Yusen Kabushiki Kaisha
- Pitney Bowes Inc.
- Reverse Logistics GmbH
Qualitative and quantitative analysis of companies has been conducted to help clients understand the wider business environment as well as the strengths and weaknesses of key market players. Data is qualitatively analyzed to categorize companies as pure play, category-focused, industry-focused, and diversified; it is quantitatively analyzed to categorize companies as dominant, leading, strong, tentative, and weak.
Segment Overview
The market research report provides comprehensive data (region wise segment analysis), with forecasts and estimates in "USD Billion" for the period 2024 to 2028, as well as historical data from 2018 to 2022 for the following segments.
- Type Outlook
- Recalls
- Commercial and B2B returns
- Repairable returns
- End-of-use returns
- End-of-life returns
- End-user Outlook
- E-commerce
- Retail
- Automotive
- Healthcare
- Others
- Region Outlook
- APAC
- China
- India
- North America
- The U.S.
- Canada
- Europe
- The U.K.
- Germany
- France
- Rest of Europe
- Middle East & Africa
- Saudi Arabia
- South Africa
- Rest of the Middle East & Africa
- South America
- Brazil
- Argentina
- Chile
- APAC
You may also interested in below market reports:
1. Finished Vehicles Logistics Market Analysis APAC, North America, Europe, Middle East and Africa, South America - China, US, Japan, India, Germany - Size and Forecast
2. Spare Parts Logistics Market Analysis APAC, Europe, North America, South America, Middle East and Africa - China, US, Germany, Japan, India - Size and Forecast
3. US E-commerce Logistics Market by Service, Mode of Transportation and Type - Forecast and Analysis
Market Analyst Overview
In today's business landscape, the importance of reverse logistics in product quality, recycling, and sustainability cannot be overstated. The market involves the process of planning, implementing, and controlling the flow of raw materials, semi-finished goods, and finished products from the consumer back to the manufacturer. This includes product recalls, repair and refurbishment, returns management, and disposal. Ecommerce and online retail have significantly increased the demand for reverse logistics. Brands and retailers are recognizing the need to efficiently manage returns and refurbish or recycle products to minimize losses and reduce environmental impact.
Furthermore, robotics and automation technologies are being employed to streamline reverse logistics processes, making them more cost-effective and efficient. End-of-life management is a critical aspect of reverse logistics. Companies are exploring ways to extend the life cycle of products through repair, refurbishment, and recycling. This not only reduces the need for new production but also helps in reducing carbon footprint and minimizing waste. Effective reverse logistics strategies require a comprehensive understanding of customer needs, regulatory requirements, and market trends. Companies that can successfully implement these strategies will gain a competitive edge in the market.
|
Market Scope |
|
|
Report Coverage |
Details |
|
Page number |
175 |
|
Base year |
2023 |
|
Historic period |
2018 - 2022 |
|
Forecast period |
2024-2028 |
|
Growth momentum & CAGR |
Accelerate at a CAGR of 8.8% |
|
Market growth 2023-2027 |
USD 398.9 billion |
|
Market structure |
Fragmented |
|
YoY growth 2022-2023(%) |
7.49 |
|
Regional analysis |
APAC, North America, Europe, Middle East and Africa, and South America |
|
Performing market contribution |
APAC at 48% |
|
Key countries |
US, China, Japan, Germany, and France |
|
Competitive landscape |
Leading Companies, Market Positioning of Companies, Competitive Strategies, and Industry Risks |
|
Key companies profiled |
Aramex International LLC, Blue Dart Express Ltd., C H Robinson Worldwide Inc., CMA CGM SA Group, Core Logistic Pvt. Ltd, Deutsche Post AG, DTDC Express Ltd., Ecom Express Pvt. Ltd., FedEx Corp., First Flight Courier Ltd., GXO Logistics Inc., Happy Returns LLC, Kintetsu Group Holdings Co. Ltd., Nippon Yusen Kabushiki Kaisha, Pitney Bowes Inc., Reverse Logistics GmbH, Safexpress Pvt. Ltd., Shipbob Inc., TCI Express Ltd, and United Parcel Service Inc. |
|
Market dynamics |
Parent market analysis, Market forecast, Market growth inducers and obstacles, Fast-growing and slow-growing segment analysis, COVID 19 impact and recovery analysis and future consumer dynamics, Market condition analysis for forecast period |
|
Customization purview |
If our market report has not included the data that you are looking for, you can reach out to our analysts and get segments customized. |
What are the Key Data Covered in this Market Forecasting Report?
- CAGR of the market during the market forecast period
- Detailed information on factors that will drive the market growth and forecasting of the market between 2023 and 2027
- Precise estimation of the size of the market size and its contribution to the parent market
- Accurate predictions about upcoming market trends and analysis and changes in consumer behavior
- Growth of the market industry across Europe, North America, APAC, South America, and Middle East and Africa
- Thorough market growth analysis of the market’s competitive landscape and detailed information about companies
- Comprehensive market analysis and report on the factors that will challenge the market research and growth of market companies
We can help! Our analysts can customize this report to meet your requirements. Get in touch
 RIA -
RIA - 
