Finished Vehicles Logistics Market Analysis, Size, and Forecast 2026-2030: APAC (China, Japan, and India), North America (US, Canada, and Mexico), Europe (Germany, UK, and France), Middle East and Africa (Saudi Arabia, UAE, and South Africa), South America (Brazil and Argentina), and Rest of World (ROW)

Finished Vehicles Logistics Market Analysis, Size, and Forecast 2026-2030:
APAC (China, Japan, and India), North America (US, Canada, and Mexico), Europe (Germany, UK, and France), Middle East and Africa (Saudi Arabia, UAE, and South Africa), South America (Brazil and Argentina), and Rest of World (ROW)

Published: Mar 2026 301 Pages SKU: IRTNTR41497

Market Overview at a Glance

$28.51 B
Market Opportunity
5.2%
CAGR 2025 - 2030
55.5%
APAC Growth
$56.85 B
Road segment 2024

Finished Vehicles Logistics Market Size 2026-2030

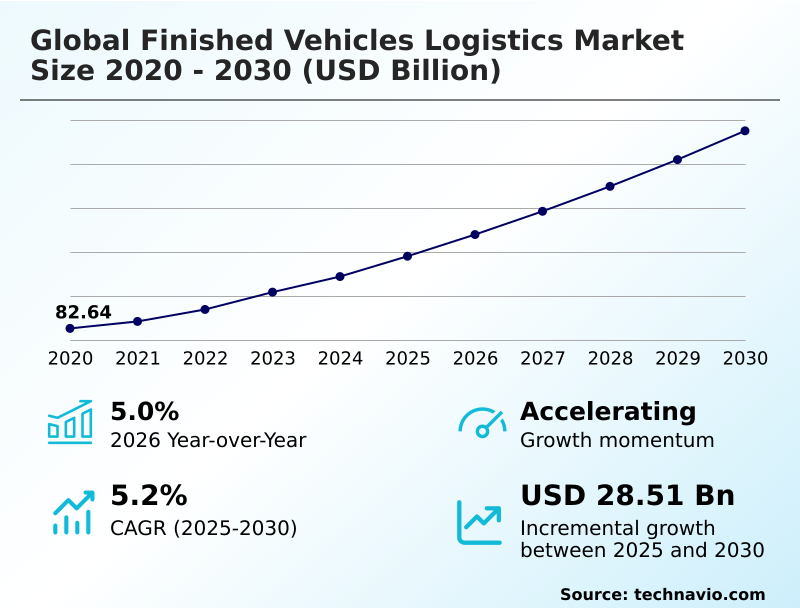
The finished vehicles logistics market size is valued to increase by USD 28.51 billion, at a CAGR of 5.2% from 2025 to 2030. Rise in electric vehicle production will drive the finished vehicles logistics market.

Major Market Trends & Insights

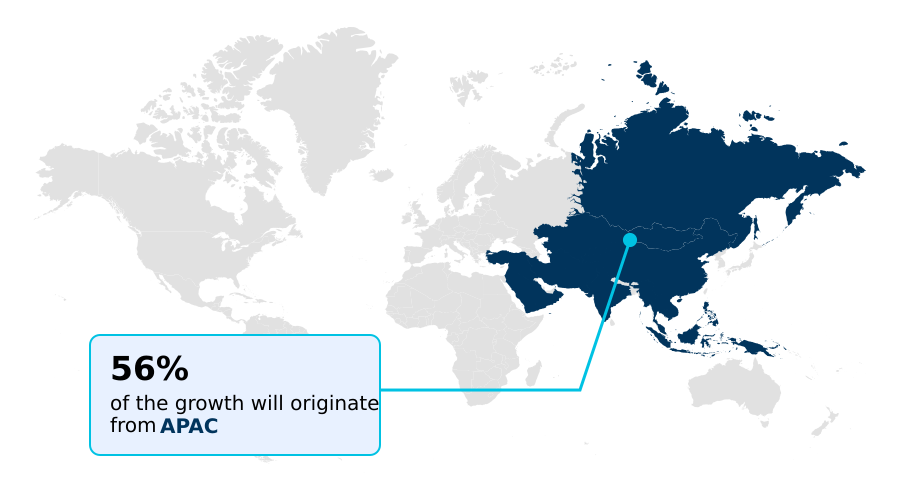
  • APAC dominated the market and accounted for a 55.5% growth during the forecast period.
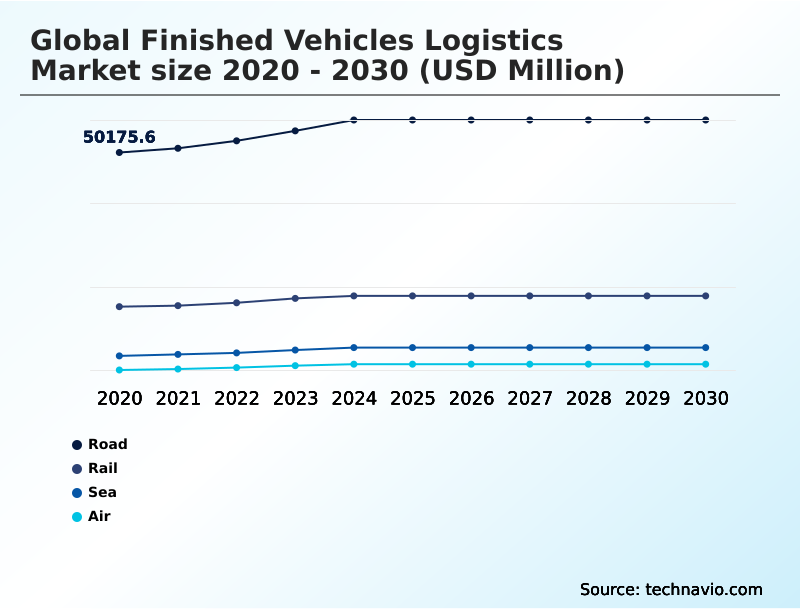
  • By Type - Road segment was valued at USD 56.85 billion in 2024
  • By Service - Warehousing segment accounted for the largest market revenue share in 2024

Market Size & Forecast

  • Market Opportunities: USD 44.90 billion
  • Market Future Opportunities: USD 28.51 billion
  • CAGR from 2025 to 2030 : 5.2%

Market Summary

  • The finished vehicles logistics market is defined by the complex coordination of assets required to move automotive units from production lines to end consumers. This sector's growth is heavily influenced by the surge in electric vehicle output, which necessitates a redesign of transport networks to manage new safety protocols and weight considerations.
  • Key industry drivers include the expansion of global automotive trade and an intense demand from manufacturers for complete supply chain visibility, which is being met through the integration of telematics and cloud-based logistics platforms. Prevailing trends focus on digitalization and sustainability, with digital twin fleet management and autonomous yard management gaining traction to improve efficiency and reduce operational costs.
  • A primary business scenario involves optimizing multimodal transport solutions to connect disparate manufacturing hubs, like those in Southeast Asia, with consumer markets, requiring seamless handoffs between roll-on roll-off shipping and high-capacity rail wagons.
  • However, the industry grapples with significant challenges, including persistent port and terminal congestion that disrupts schedules, rising fuel price volatility, and a critical shortage of specialized transport drivers, which collectively constrain capacity and increase operational pressures for logistics providers.

What will be the Size of the Finished Vehicles Logistics Market during the forecast period?

Get Key Insights on Market Forecast (PDF) Request Free Sample

How is the Finished Vehicles Logistics Market Segmented?

The finished vehicles logistics industry research report provides comprehensive data (region-wise segment analysis), with forecasts and estimates in "USD million" for the period 2026-2030, as well as historical data from 2020-2024 for the following segments.

  • Type
    • Road
    • Rail
    • Sea
    • Air
  • Service
    • Warehousing
    • Transport
  • Vehicle type
    • Passenger cars
    • Light commercial vehicles
    • Heavy commercial vehicles
    • Others
  • Geography
    • APAC
      • China
      • Japan
      • India
    • North America
      • US
      • Canada
      • Mexico
    • Europe
      • Germany
      • UK
      • France
    • Middle East and Africa
      • Saudi Arabia
      • UAE
      • South Africa
    • South America
      • Brazil
      • Argentina
    • Rest of World (ROW)

By Type Insights

The road segment is estimated to witness significant growth during the forecast period.

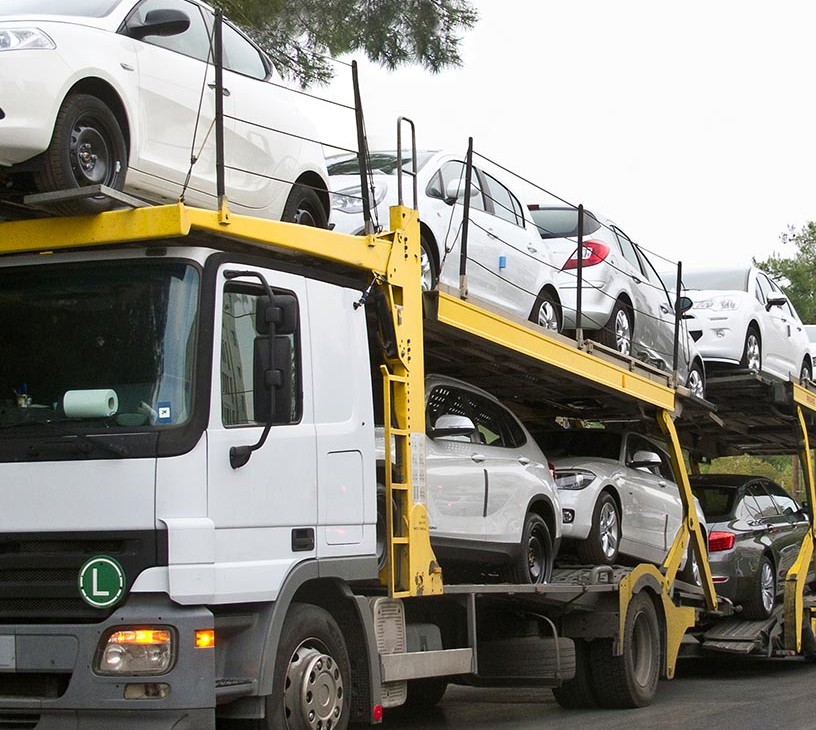
The road segment is central to the finished vehicles logistics market, providing unparalleled flexibility for domestic transport and last-mile vehicle delivery.

This mode relies on a vast network of specialized car carriers and heavy-duty car haulers to move units from ports and rail hubs directly to dealerships.

The integration of advanced telematics and sensor network technology is transforming road haulage efficiency, as over 80% of automotive manufacturers now prioritize real-time vehicle tracking to enhance supply chain visibility.

Modern route optimization software helps manage complex delivery schedules and mitigate delays.

As the industry evolves, fleet management software is crucial for addressing challenges like axle weight regulations for electric vehicles and optimizing logistics cost reduction, ensuring a responsive and efficient automotive distribution network.

Request Free Sample

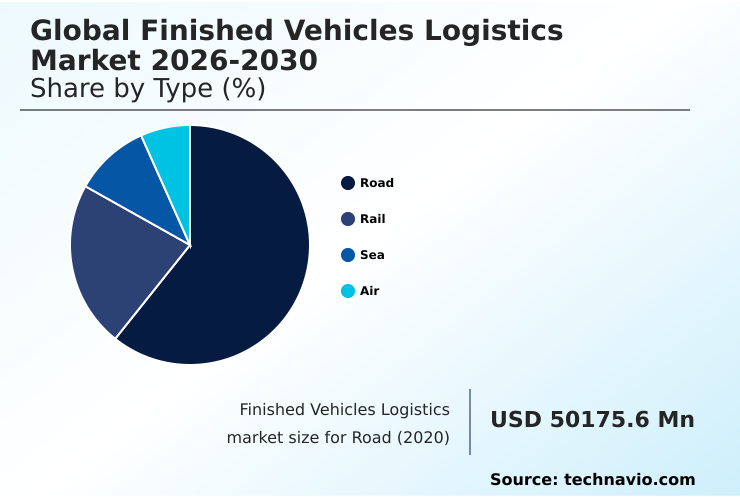
The Road segment was valued at USD 56.85 billion in 2024 and showed a gradual increase during the forecast period.

Request Free Sample

Regional Analysis

APAC is estimated to contribute 55.5% to the growth of the global market during the forecast period.Technavio’s analysts have elaborately explained the regional trends and drivers that shape the market during the forecast period.

See How Finished Vehicles Logistics Market Demand is Rising in APAC Request Free Sample

The geographic landscape of the finished vehicles logistics market is led by APAC, which is projected to contribute over 55% of the market’s incremental growth, driven by massive production volumes and expanding automotive export hubs.

This region's maritime logistics landscape is rapidly evolving with increased ro-ro vessel capacity. North America represents a highly mature market, characterized by sophisticated intermodal logistics networks and a focus on damage-free delivery.

Europe is distinguished by its advanced port-centric logistics and a strong emphasis on green logistics solutions and zero-emission logistics, although it faces operational challenges, with terminal dwell times at major ports increasing to an average of 14 days.

The development of new vehicle processing centers in the Middle East and Africa and cross-border rail services in South America reflects growing investment in these emerging markets to improve their automotive distribution networks.

Market Dynamics

Our researchers analyzed the data with 2025 as the base year, along with the key drivers, trends, and challenges. A holistic analysis of drivers will help companies refine their marketing strategies to gain a competitive advantage.

  • Strategic decision-making in the finished vehicles logistics market increasingly revolves around key operational questions. Optimizing finished vehicle logistics for EVs is a primary focus, forcing companies to re-evaluate transport infrastructure and safety requirements for EV transport. The push for real-time visibility in automotive supply chains is a direct response to the need for greater control and predictability.
  • Another critical area is reducing port congestion in vehicle logistics, a complex problem that impacts schedules and costs globally. Internally, firms are addressing the challenges of specialized driver shortages through recruitment initiatives and by exploring shunting process automation. For global vehicle distribution, selecting the right mix of multimodal transport is essential for balancing cost and speed.
  • Technologically, digital twin applications in vehicle logistics offer powerful simulation capabilities for optimizing yard capacity with software and planning for disruptions. The pursuit of sustainable logistics for finished vehicles is no longer optional, influencing everything from fuel choices to carrier design. This involves managing fuel price volatility in transport while also improving the efficiency of ro-ro shipping.
  • Automating vehicle movements in port terminals using lidar and computer vision helps improve throughput and safety. Firms that successfully integrate advanced car carrier design features and robust security protocols for high-value vehicles report a significant competitive advantage, reducing damage incidents by over 25% compared to industry averages.

What are the key market drivers leading to the rise in the adoption of Finished Vehicles Logistics Industry?

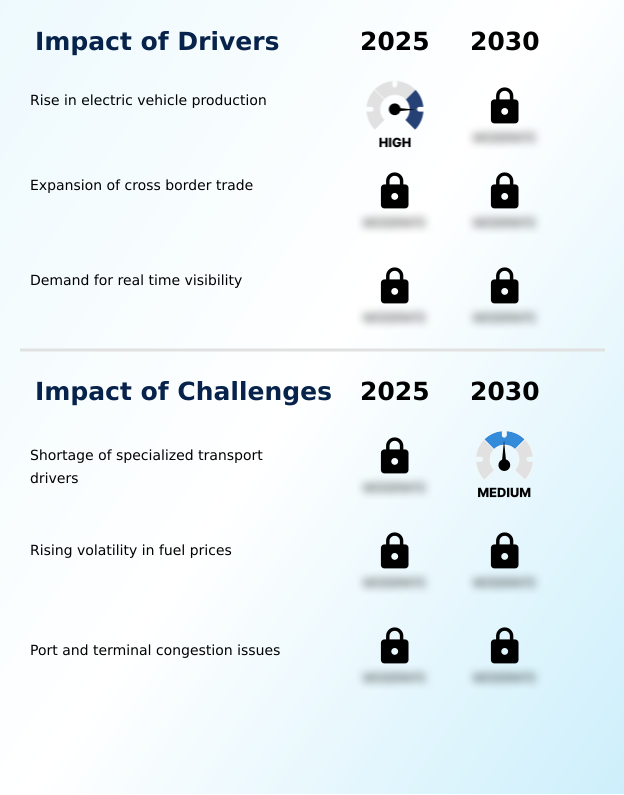
  • The significant rise in electric vehicle production across major automotive manufacturing regions is a primary driver for the market.

  • Market growth is fundamentally driven by the confluence of surging electric vehicle production, expanding international trade, and the unceasing demand for granular visibility.
  • With global EV output reaching approximately 13 million units, the need for specialized outbound logistics optimization and adherence to new safety protocols has intensified.
  • The expansion of cross-border trade facilitation, driven by new automotive manufacturing hubs, increases the complexity of the outbound supply chain and demand for robust end-to-end logistics services.
  • Critically, over 80% of automotive manufacturers now consider real-time vehicle tracking a top priority, fueling investment in technologies that support lean inventory principles.
  • This intense demand for data-driven oversight is forcing logistics providers to enhance their capabilities to ensure damage-free delivery and maintain a competitive edge in a dynamic global market.

What are the market trends shaping the Finished Vehicles Logistics Industry?

  • A key market trend is the growing adoption of specialized electric vehicle haulage systems. These are designed to accommodate the unique physical properties of battery-powered cars.

  • Key market trends are reshaping the operational landscape, with a strong focus on sustainability and automation. The adoption of specialized electric vehicle haulage is critical, as logistics providers invest in carriers designed to handle units weighing 20-30% more than conventional models. This shift toward zero-emission logistics is complemented by the integration of digital twin fleet management systems.
  • These platforms enable companies to run simulations on carrier availability and route efficiency, improving delivery time accuracy by up to 15%. Furthermore, the implementation of autonomous yard management systems at vehicle processing centers is addressing labor shortages and improving safety.
  • These trends collectively drive the digital logistics transformation, enhancing supply chain risk mitigation and supporting the industry's move toward more resilient and efficient operations through advanced fleet management software.

What challenges does the Finished Vehicles Logistics Industry face during its growth?

  • A persistent shortage of qualified drivers trained to operate specialized car carriers presents a significant challenge to industry growth.

  • The market faces significant operational headwinds that challenge efficiency and profitability. A critical issue is the persistent shortage of specialized transport drivers, with vacancy rates reaching nearly 15% in major regions, which directly constrains inland transport capacity and disrupts schedules. This labor shortage puts upward pressure on costs across the entire finished vehicle supply chain.
  • Compounding this is the high volatility in fuel prices, which complicates logistics cost reduction efforts for both road and maritime transport. Furthermore, severe port and terminal congestion remains a major bottleneck, with average terminal dwell times at some major ports increasing to 14 days.
  • This congestion not only delays shipments but also increases storage costs and the risk of vehicle damage, undermining supply chain resilience and complicating vehicle inventory management.

Exclusive Technavio Analysis on Customer Landscape

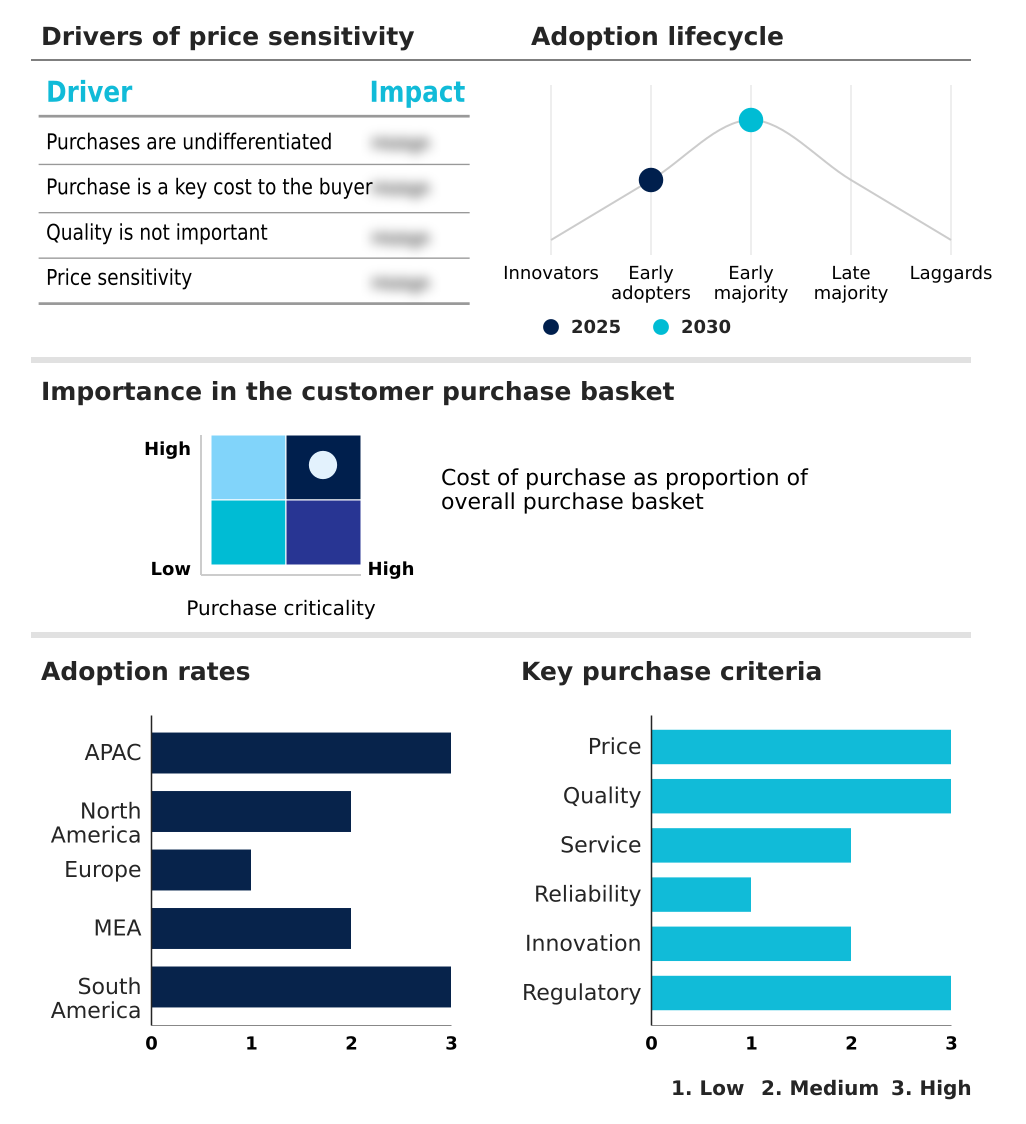
The finished vehicles logistics market forecasting report includes the adoption lifecycle of the market, covering from the innovator’s stage to the laggard’s stage. It focuses on adoption rates in different regions based on penetration. Furthermore, the finished vehicles logistics market report also includes key purchase criteria and drivers of price sensitivity to help companies evaluate and develop their market growth analysis strategies.

Customer Landscape of Finished Vehicles Logistics Industry

Competitive Landscape

Companies are implementing various strategies, such as strategic alliances, finished vehicles logistics market forecast, partnerships, mergers and acquisitions, geographical expansion, and product/service launches, to enhance their presence in the industry.

ACERTUS - Provides a tech-enabled automotive logistics platform for end-to-end vehicle movement, storage, reconditioning, and registration, ensuring a seamless finished vehicle supply chain.

The industry research and growth report includes detailed analyses of the competitive landscape of the market and information about key companies, including:

  • ACERTUS
  • AP Moller Maersk AS
  • ARS Altmann AG
  • Berge Logistics
  • CMA CGM Group
  • DHL International GmbH
  • DP World
  • DSV AS
  • Ekol Lojistik AS
  • Hellmann Worldwide Logistics
  • Jack Cooper Logistics
  • Koopman Logistics Group BV
  • Kuehne Nagel Management AG
  • Mitsui O.S.K. Lines Ltd.
  • Nippon Express Holdings Inc.
  • Omsan Lojistik AS
  • Ryder System Inc.
  • United Parcel Service Inc.
  • Wallenius Wilhelmsen ASA
  • XPO Inc.

Qualitative and quantitative analysis of companies has been conducted to help clients understand the wider business environment as well as the strengths and weaknesses of key industry players. Data is qualitatively analyzed to categorize companies as pure play, category-focused, industry-focused, and diversified; it is quantitatively analyzed to categorize companies as dominant, leading, strong, tentative, and weak.

Recent Development and News in Finished vehicles logistics market

  • In August 2024, Kuehne Nagel Management AG opened a new dedicated automotive logistics hub in the Middle East to support the growing regional demand for finished vehicle services.
  • In September 2024, Ryder System Inc. introduced a new digital platform for managing outbound vehicle logistics from assembly plants, enhancing real-time visibility for manufacturers.
  • In January 2025, Hellmann Worldwide Logistics SE and Co KG implemented a new artificial intelligence-based route optimization system for its vehicle haulage operations to improve efficiency.
  • In May 2025, Nippon Express Holdings Inc. expanded its cross-border rail services for vehicles in Central Asia, strengthening its multimodal transport network in the region.

Dive into Technavio’s robust research methodology, blending expert interviews, extensive data synthesis, and validated models for unparalleled Finished Vehicles Logistics Market insights. See full methodology.

Market Scope
Page number 301
Base year 2025
Historic period 2020-2024
Forecast period 2026-2030
Growth momentum & CAGR Accelerate at a CAGR of 5.2%
Market growth 2026-2030 USD 28506.0 million
Market structure Fragmented
YoY growth 2025-2026(%) 5.0%
Key countries China, Japan, India, South Korea, Australia, Indonesia, US, Canada, Mexico, Germany, UK, France, Italy, Spain, The Netherlands, Saudi Arabia, UAE, South Africa, Israel, Turkey, Brazil, Argentina and Chile
Competitive landscape Leading Companies, Market Positioning of Companies, Competitive Strategies, and Industry Risks

Request Free Sample

Research Analyst Overview

  • The finished vehicles logistics market is a highly specialized sector centered on the coordination of multimodal transport solutions, including roll-on roll-off shipping and high-capacity rail wagons, to ensure the efficient movement of vehicles.
  • A core boardroom-level concern is the capital expenditure required for electric vehicle haulage, which involves fleet upgrades with specialized car carriers and investment in high-speed charging infrastructure to handle unique axle weight regulations and lithium-ion battery safety protocols.
  • Operational integrity is maintained through advanced telematics and sensor networks, which feed data into cloud-based logistics platforms for real-time vehicle tracking and supply chain visibility. This addresses the demand for just-in-time delivery and lean inventory principles. Vehicle terminal operations are being transformed by automated damage inspection and vehicle storage yard optimization technologies.
  • The market is also seeing a 15% increase in the utilization of specialized terminals equipped for EV maintenance. Strategic challenges include managing port and terminal congestion, navigating complex customs and documentation for cross-border trade, and mitigating the impact of a global shortage of specialized transport drivers, all while adhering to strict fire safety protocols.

What are the Key Data Covered in this Finished Vehicles Logistics Market Research and Growth Report?

  • What is the expected growth of the Finished Vehicles Logistics Market between 2026 and 2030?

    • USD 28.51 billion, at a CAGR of 5.2%

  • What segmentation does the market report cover?

    • The report is segmented by Type (Road, Rail, Sea, and Air), Service (Warehousing, and Transport), Vehicle Type (Passenger cars, Light commercial vehicles, Heavy commercial vehicles, and Others) and Geography (APAC, North America, Europe, Middle East and Africa, South America)

  • Which regions are analyzed in the report?

    • APAC, North America, Europe, Middle East and Africa and South America

  • What are the key growth drivers and market challenges?

    • Rise in electric vehicle production, Shortage of specialized transport drivers

  • Who are the major players in the Finished Vehicles Logistics Market?

    • ACERTUS, AP Moller Maersk AS, ARS Altmann AG, Berge Logistics, CMA CGM Group, DHL International GmbH, DP World, DSV AS, Ekol Lojistik AS, Hellmann Worldwide Logistics, Jack Cooper Logistics, Koopman Logistics Group BV, Kuehne Nagel Management AG, Mitsui O.S.K. Lines Ltd., Nippon Express Holdings Inc., Omsan Lojistik AS, Ryder System Inc., United Parcel Service Inc., Wallenius Wilhelmsen ASA and XPO Inc.

Market Research Insights

  • The finished vehicles logistics market is shaped by a convergence of operational demands and technological advancements. The need for supply chain resilience and logistics cost reduction is paramount, compelling firms to enhance their end-to-end logistics services.
  • A critical dynamic is the push for greater transparency, with over 80% of manufacturers prioritizing real-time tracking, driving investment in sophisticated automotive logistics platform technology. This digital logistics transformation is essential for managing the complexities of global automotive trade.
  • Concurrently, the industry faces significant labor constraints, evidenced by a driver vacancy rate nearing 15% in key regions, which impacts road haulage efficiency. The strategic selection of transport modes is also evolving, with an increased focus on sustainability and carbon footprint reduction influencing decisions across the finished vehicle supply chain.

We can help! Our analysts can customize this finished vehicles logistics market research report to meet your requirements.

Get in touch

1. Executive Summary

1.1 Market overview

Executive Summary - Chart on Market Overview
Executive Summary - Data Table on Market Overview
Executive Summary - Chart on Global Market Characteristics
Executive Summary - Chart on Market by Geography
Executive Summary - Chart on Market Segmentation by Type
Executive Summary - Chart on Market Segmentation by Service
Executive Summary - Chart on Market Segmentation by Vehicle Type
Executive Summary - Chart on Incremental Growth
Executive Summary - Data Table on Incremental Growth
Executive Summary - Chart on Company Market Positioning

2. Technavio Analysis

2.1 Analysis of price sensitivity, lifecycle, customer purchase basket, adoption rates, and purchase criteria

2.2 Criticality of inputs and Factors of differentiation

Chart on Overview on criticality of inputs and factors of differentiation

2.3 Factors of disruption

Chart on Overview on factors of disruption

2.4 Impact of drivers and challenges

Chart on Impact of drivers and challenges in 2025 and 2030

3. Market Landscape

3.1 Market ecosystem

Chart on Parent Market
Data Table on - Parent Market

3.2 Market characteristics

Chart on Market characteristics analysis

3.3 Value chain analysis

Chart on Value chain analysis

4. Market Sizing

4.1 Market definition

Data Table on Offerings of companies included in the market definition

4.2 Market segment analysis

Market segments

4.3 Market size 2025

4.4 Market outlook: Forecast for 2025-2030

Chart on Global - Market size and forecast 2025-2030 ($ million)
Data Table on Global - Market size and forecast 2025-2030 ($ million)
Chart on Global Market: Year-over-year growth 2025-2030 (%)
Data Table on Global Market: Year-over-year growth 2025-2030 (%)

5. Historic Market Size

5.1 Global Finished Vehicles Logistics Market 2020 - 2024

Historic Market Size - Data Table on Global Finished Vehicles Logistics Market 2020 - 2024 ($ million)

5.2 Type segment analysis 2020 - 2024

Historic Market Size - Type Segment 2020 - 2024 ($ million)

5.3 Service segment analysis 2020 - 2024

Historic Market Size - Service Segment 2020 - 2024 ($ million)

5.4 Vehicle Type segment analysis 2020 - 2024

Historic Market Size - Vehicle Type Segment 2020 - 2024 ($ million)

5.5 Geography segment analysis 2020 - 2024

Historic Market Size - Geography Segment 2020 - 2024 ($ million)

5.6 Country segment analysis 2020 - 2024

Historic Market Size - Country Segment 2020 - 2024 ($ million)

6. Qualitative Analysis

6.1 Impact of AI on Global Finished Vehicles Logistics Market

7. Five Forces Analysis

7.1 Five forces summary

Five forces analysis - Comparison between 2025 and 2030

7.2 Bargaining power of buyers

Bargaining power of buyers - Impact of key factors 2025 and 2030

7.3 Bargaining power of suppliers

Bargaining power of suppliers - Impact of key factors in 2025 and 2030

7.4 Threat of new entrants

Threat of new entrants - Impact of key factors in 2025 and 2030

7.5 Threat of substitutes

Threat of substitutes - Impact of key factors in 2025 and 2030

7.6 Threat of rivalry

Threat of rivalry - Impact of key factors in 2025 and 2030

7.7 Market condition

Chart on Market condition - Five forces 2025 and 2030

8. Market Segmentation by Type

8.1 Market segments

Chart on Type - Market share 2025-2030 (%)
Data Table on Type - Market share 2025-2030 (%)

8.2 Comparison by Type

Chart on Comparison by Type
Data Table on Comparison by Type

8.3 Road - Market size and forecast 2025-2030

Chart on Road - Market size and forecast 2025-2030 ($ million)
Data Table on Road - Market size and forecast 2025-2030 ($ million)
Chart on Road - Year-over-year growth 2025-2030 (%)
Data Table on Road - Year-over-year growth 2025-2030 (%)

8.4 Rail - Market size and forecast 2025-2030

Chart on Rail - Market size and forecast 2025-2030 ($ million)
Data Table on Rail - Market size and forecast 2025-2030 ($ million)
Chart on Rail - Year-over-year growth 2025-2030 (%)
Data Table on Rail - Year-over-year growth 2025-2030 (%)

8.5 Sea - Market size and forecast 2025-2030

Chart on Sea - Market size and forecast 2025-2030 ($ million)
Data Table on Sea - Market size and forecast 2025-2030 ($ million)
Chart on Sea - Year-over-year growth 2025-2030 (%)
Data Table on Sea - Year-over-year growth 2025-2030 (%)

8.6 Air - Market size and forecast 2025-2030

Chart on Air - Market size and forecast 2025-2030 ($ million)
Data Table on Air - Market size and forecast 2025-2030 ($ million)
Chart on Air - Year-over-year growth 2025-2030 (%)
Data Table on Air - Year-over-year growth 2025-2030 (%)

8.7 Market opportunity by Type

Market opportunity by Type ($ million)
Data Table on Market opportunity by Type ($ million)

9. Market Segmentation by Service

9.1 Market segments

Chart on Service - Market share 2025-2030 (%)
Data Table on Service - Market share 2025-2030 (%)

9.2 Comparison by Service

Chart on Comparison by Service
Data Table on Comparison by Service

9.3 Warehousing - Market size and forecast 2025-2030

Chart on Warehousing - Market size and forecast 2025-2030 ($ million)
Data Table on Warehousing - Market size and forecast 2025-2030 ($ million)
Chart on Warehousing - Year-over-year growth 2025-2030 (%)
Data Table on Warehousing - Year-over-year growth 2025-2030 (%)

9.4 Transport - Market size and forecast 2025-2030

Chart on Transport - Market size and forecast 2025-2030 ($ million)
Data Table on Transport - Market size and forecast 2025-2030 ($ million)
Chart on Transport - Year-over-year growth 2025-2030 (%)
Data Table on Transport - Year-over-year growth 2025-2030 (%)

9.5 Market opportunity by Service

Market opportunity by Service ($ million)
Data Table on Market opportunity by Service ($ million)

10. Market Segmentation by Vehicle Type

10.1 Market segments

Chart on Vehicle Type - Market share 2025-2030 (%)
Data Table on Vehicle Type - Market share 2025-2030 (%)

10.2 Comparison by Vehicle Type

Chart on Comparison by Vehicle Type
Data Table on Comparison by Vehicle Type

10.3 Passenger cars - Market size and forecast 2025-2030

Chart on Passenger cars - Market size and forecast 2025-2030 ($ million)
Data Table on Passenger cars - Market size and forecast 2025-2030 ($ million)
Chart on Passenger cars - Year-over-year growth 2025-2030 (%)
Data Table on Passenger cars - Year-over-year growth 2025-2030 (%)

10.4 Light commercial vehicles - Market size and forecast 2025-2030

Chart on Light commercial vehicles - Market size and forecast 2025-2030 ($ million)
Data Table on Light commercial vehicles - Market size and forecast 2025-2030 ($ million)
Chart on Light commercial vehicles - Year-over-year growth 2025-2030 (%)
Data Table on Light commercial vehicles - Year-over-year growth 2025-2030 (%)

10.5 Heavy commercial vehicles - Market size and forecast 2025-2030

Chart on Heavy commercial vehicles - Market size and forecast 2025-2030 ($ million)
Data Table on Heavy commercial vehicles - Market size and forecast 2025-2030 ($ million)
Chart on Heavy commercial vehicles - Year-over-year growth 2025-2030 (%)
Data Table on Heavy commercial vehicles - Year-over-year growth 2025-2030 (%)

10.6 Others - Market size and forecast 2025-2030

Chart on Others - Market size and forecast 2025-2030 ($ million)
Data Table on Others - Market size and forecast 2025-2030 ($ million)
Chart on Others - Year-over-year growth 2025-2030 (%)
Data Table on Others - Year-over-year growth 2025-2030 (%)

10.7 Market opportunity by Vehicle Type

Market opportunity by Vehicle Type ($ million)
Data Table on Market opportunity by Vehicle Type ($ million)

11. Customer Landscape

11.1 Customer landscape overview

Analysis of price sensitivity, lifecycle, customer purchase basket, adoption rates, and purchase criteria

12. Geographic Landscape

12.1 Geographic segmentation

Chart on Market share by geography 2025-2030 (%)
Data Table on Market share by geography 2025-2030 (%)

12.2 Geographic comparison

Chart on Geographic comparison
Data Table on Geographic comparison

12.3 APAC - Market size and forecast 2025-2030

Chart on APAC - Market size and forecast 2025-2030 ($ million)
Data Table on APAC - Market size and forecast 2025-2030 ($ million)
Chart on APAC - Year-over-year growth 2025-2030 (%)
Data Table on APAC - Year-over-year growth 2025-2030 (%)
Chart on Regional Comparison - APAC
Data Table on Regional Comparison - APAC

12.3.1 China - Market size and forecast 2025-2030

Chart on China - Market size and forecast 2025-2030 ($ million)
Data Table on China - Market size and forecast 2025-2030 ($ million)
Chart on China - Year-over-year growth 2025-2030 (%)
Data Table on China - Year-over-year growth 2025-2030 (%)

12.3.2 Japan - Market size and forecast 2025-2030

Chart on Japan - Market size and forecast 2025-2030 ($ million)
Data Table on Japan - Market size and forecast 2025-2030 ($ million)
Chart on Japan - Year-over-year growth 2025-2030 (%)
Data Table on Japan - Year-over-year growth 2025-2030 (%)

12.3.3 India - Market size and forecast 2025-2030

Chart on India - Market size and forecast 2025-2030 ($ million)
Data Table on India - Market size and forecast 2025-2030 ($ million)
Chart on India - Year-over-year growth 2025-2030 (%)
Data Table on India - Year-over-year growth 2025-2030 (%)

12.3.4 South Korea - Market size and forecast 2025-2030

Chart on South Korea - Market size and forecast 2025-2030 ($ million)
Data Table on South Korea - Market size and forecast 2025-2030 ($ million)
Chart on South Korea - Year-over-year growth 2025-2030 (%)
Data Table on South Korea - Year-over-year growth 2025-2030 (%)

12.3.5 Australia - Market size and forecast 2025-2030

Chart on Australia - Market size and forecast 2025-2030 ($ million)
Data Table on Australia - Market size and forecast 2025-2030 ($ million)
Chart on Australia - Year-over-year growth 2025-2030 (%)
Data Table on Australia - Year-over-year growth 2025-2030 (%)

12.3.6 Indonesia - Market size and forecast 2025-2030

Chart on Indonesia - Market size and forecast 2025-2030 ($ million)
Data Table on Indonesia - Market size and forecast 2025-2030 ($ million)
Chart on Indonesia - Year-over-year growth 2025-2030 (%)
Data Table on Indonesia - Year-over-year growth 2025-2030 (%)

12.4 North America - Market size and forecast 2025-2030

Chart on North America - Market size and forecast 2025-2030 ($ million)
Data Table on North America - Market size and forecast 2025-2030 ($ million)
Chart on North America - Year-over-year growth 2025-2030 (%)
Data Table on North America - Year-over-year growth 2025-2030 (%)
Chart on Regional Comparison - North America
Data Table on Regional Comparison - North America

12.4.1 US - Market size and forecast 2025-2030

Chart on US - Market size and forecast 2025-2030 ($ million)
Data Table on US - Market size and forecast 2025-2030 ($ million)
Chart on US - Year-over-year growth 2025-2030 (%)
Data Table on US - Year-over-year growth 2025-2030 (%)

12.4.2 Canada - Market size and forecast 2025-2030

Chart on Canada - Market size and forecast 2025-2030 ($ million)
Data Table on Canada - Market size and forecast 2025-2030 ($ million)
Chart on Canada - Year-over-year growth 2025-2030 (%)
Data Table on Canada - Year-over-year growth 2025-2030 (%)

12.4.3 Mexico - Market size and forecast 2025-2030

Chart on Mexico - Market size and forecast 2025-2030 ($ million)
Data Table on Mexico - Market size and forecast 2025-2030 ($ million)
Chart on Mexico - Year-over-year growth 2025-2030 (%)
Data Table on Mexico - Year-over-year growth 2025-2030 (%)

12.5 Europe - Market size and forecast 2025-2030

Chart on Europe - Market size and forecast 2025-2030 ($ million)
Data Table on Europe - Market size and forecast 2025-2030 ($ million)
Chart on Europe - Year-over-year growth 2025-2030 (%)
Data Table on Europe - Year-over-year growth 2025-2030 (%)
Chart on Regional Comparison - Europe
Data Table on Regional Comparison - Europe

12.5.1 Germany - Market size and forecast 2025-2030

Chart on Germany - Market size and forecast 2025-2030 ($ million)
Data Table on Germany - Market size and forecast 2025-2030 ($ million)
Chart on Germany - Year-over-year growth 2025-2030 (%)
Data Table on Germany - Year-over-year growth 2025-2030 (%)

12.5.2 UK - Market size and forecast 2025-2030

Chart on UK - Market size and forecast 2025-2030 ($ million)
Data Table on UK - Market size and forecast 2025-2030 ($ million)
Chart on UK - Year-over-year growth 2025-2030 (%)
Data Table on UK - Year-over-year growth 2025-2030 (%)

12.5.3 France - Market size and forecast 2025-2030

Chart on France - Market size and forecast 2025-2030 ($ million)
Data Table on France - Market size and forecast 2025-2030 ($ million)
Chart on France - Year-over-year growth 2025-2030 (%)
Data Table on France - Year-over-year growth 2025-2030 (%)

12.5.4 Italy - Market size and forecast 2025-2030

Chart on Italy - Market size and forecast 2025-2030 ($ million)
Data Table on Italy - Market size and forecast 2025-2030 ($ million)
Chart on Italy - Year-over-year growth 2025-2030 (%)
Data Table on Italy - Year-over-year growth 2025-2030 (%)

12.5.5 Spain - Market size and forecast 2025-2030

Chart on Spain - Market size and forecast 2025-2030 ($ million)
Data Table on Spain - Market size and forecast 2025-2030 ($ million)
Chart on Spain - Year-over-year growth 2025-2030 (%)
Data Table on Spain - Year-over-year growth 2025-2030 (%)

12.5.6 The Netherlands - Market size and forecast 2025-2030

Chart on The Netherlands - Market size and forecast 2025-2030 ($ million)
Data Table on The Netherlands - Market size and forecast 2025-2030 ($ million)
Chart on The Netherlands - Year-over-year growth 2025-2030 (%)
Data Table on The Netherlands - Year-over-year growth 2025-2030 (%)

12.6 Middle East and Africa - Market size and forecast 2025-2030

Chart on Middle East and Africa - Market size and forecast 2025-2030 ($ million)
Data Table on Middle East and Africa - Market size and forecast 2025-2030 ($ million)
Chart on Middle East and Africa - Year-over-year growth 2025-2030 (%)
Data Table on Middle East and Africa - Year-over-year growth 2025-2030 (%)
Chart on Regional Comparison - Middle East and Africa
Data Table on Regional Comparison - Middle East and Africa

12.6.1 Saudi Arabia - Market size and forecast 2025-2030

Chart on Saudi Arabia - Market size and forecast 2025-2030 ($ million)
Data Table on Saudi Arabia - Market size and forecast 2025-2030 ($ million)
Chart on Saudi Arabia - Year-over-year growth 2025-2030 (%)
Data Table on Saudi Arabia - Year-over-year growth 2025-2030 (%)

12.6.2 UAE - Market size and forecast 2025-2030

Chart on UAE - Market size and forecast 2025-2030 ($ million)
Data Table on UAE - Market size and forecast 2025-2030 ($ million)
Chart on UAE - Year-over-year growth 2025-2030 (%)
Data Table on UAE - Year-over-year growth 2025-2030 (%)

12.6.3 South Africa - Market size and forecast 2025-2030

Chart on South Africa - Market size and forecast 2025-2030 ($ million)
Data Table on South Africa - Market size and forecast 2025-2030 ($ million)
Chart on South Africa - Year-over-year growth 2025-2030 (%)
Data Table on South Africa - Year-over-year growth 2025-2030 (%)

12.6.4 Israel - Market size and forecast 2025-2030

Chart on Israel - Market size and forecast 2025-2030 ($ million)
Data Table on Israel - Market size and forecast 2025-2030 ($ million)
Chart on Israel - Year-over-year growth 2025-2030 (%)
Data Table on Israel - Year-over-year growth 2025-2030 (%)

12.6.5 Turkey - Market size and forecast 2025-2030

Chart on Turkey - Market size and forecast 2025-2030 ($ million)
Data Table on Turkey - Market size and forecast 2025-2030 ($ million)
Chart on Turkey - Year-over-year growth 2025-2030 (%)
Data Table on Turkey - Year-over-year growth 2025-2030 (%)

12.7 South America - Market size and forecast 2025-2030

Chart on South America - Market size and forecast 2025-2030 ($ million)
Data Table on South America - Market size and forecast 2025-2030 ($ million)
Chart on South America - Year-over-year growth 2025-2030 (%)
Data Table on South America - Year-over-year growth 2025-2030 (%)
Chart on Regional Comparison - South America
Data Table on Regional Comparison - South America

12.7.1 Brazil - Market size and forecast 2025-2030

Chart on Brazil - Market size and forecast 2025-2030 ($ million)
Data Table on Brazil - Market size and forecast 2025-2030 ($ million)
Chart on Brazil - Year-over-year growth 2025-2030 (%)
Data Table on Brazil - Year-over-year growth 2025-2030 (%)

12.7.2 Argentina - Market size and forecast 2025-2030

Chart on Argentina - Market size and forecast 2025-2030 ($ million)
Data Table on Argentina - Market size and forecast 2025-2030 ($ million)
Chart on Argentina - Year-over-year growth 2025-2030 (%)
Data Table on Argentina - Year-over-year growth 2025-2030 (%)

12.7.3 Chile - Market size and forecast 2025-2030

Chart on Chile - Market size and forecast 2025-2030 ($ million)
Data Table on Chile - Market size and forecast 2025-2030 ($ million)
Chart on Chile - Year-over-year growth 2025-2030 (%)
Data Table on Chile - Year-over-year growth 2025-2030 (%)

12.8 Market opportunity by geography

Market opportunity by geography ($ million)
Data Tables on Market opportunity by geography ($ million)

13. Drivers, Challenges, and Opportunity

13.1 Market drivers

Rise in electric vehicle production
Expansion of cross border trade
Demand for real time visibility

13.2 Market challenges

Shortage of specialized transport drivers
Rising volatility in fuel prices
Port and terminal congestion issues

13.3 Impact of drivers and challenges

Impact of drivers and challenges in 2025 and 2030

13.4 Market opportunities

Adoption of electric vehicle haulage
Digital twin fleet management systems
Multimodal autonomous port shuttles integration

14. Competitive Landscape

14.1 Overview

14.2

Overview on criticality of inputs and factors of differentiation

14.3 Landscape disruption

Overview on factors of disruption

14.4 Industry risks

Impact of key risks on business

15. Competitive Analysis

15.1 Companies profiled

Companies covered

15.2 Company ranking index

15.3 Market positioning of companies

Matrix on companies position and classification

15.4 ACERTUS

ACERTUS - Overview
ACERTUS - Product / Service
ACERTUS - Key offerings
SWOT

15.5 AP Moller Maersk AS

AP Moller Maersk AS - Overview
AP Moller Maersk AS - Business segments
AP Moller Maersk AS - Key news
AP Moller Maersk AS - Key offerings
AP Moller Maersk AS - Segment focus
SWOT

15.6 ARS Altmann AG

ARS Altmann AG - Overview
ARS Altmann AG - Product / Service
ARS Altmann AG - Key offerings
SWOT

15.7 CMA CGM Group

CMA CGM Group - Overview
CMA CGM Group - Product / Service
CMA CGM Group - Key news
CMA CGM Group - Key offerings
SWOT

15.8 DHL International GmbH

DHL International GmbH - Overview
DHL International GmbH - Business segments
DHL International GmbH - Key news
DHL International GmbH - Key offerings
DHL International GmbH - Segment focus
SWOT

15.9 DP World

DP World - Overview
DP World - Product / Service
DP World - Key offerings
SWOT

15.10 DSV AS

DSV AS - Overview
DSV AS - Business segments
DSV AS - Key offerings
DSV AS - Segment focus
SWOT

15.11 Ekol Lojistik AS

Ekol Lojistik AS - Overview
Ekol Lojistik AS - Product / Service
Ekol Lojistik AS - Key offerings
SWOT

15.12 Hellmann Worldwide Logistics

Hellmann Worldwide Logistics - Overview
Hellmann Worldwide Logistics - Product / Service
Hellmann Worldwide Logistics - Key offerings
SWOT

15.13 Kuehne Nagel Management AG

Kuehne Nagel Management AG - Overview
Kuehne Nagel Management AG - Business segments
Kuehne Nagel Management AG - Key news
Kuehne Nagel Management AG - Key offerings
Kuehne Nagel Management AG - Segment focus
SWOT

15.14 Mitsui O.S.K. Lines Ltd.

Mitsui O.S.K. Lines Ltd. - Overview
Mitsui O.S.K. Lines Ltd. - Business segments
Mitsui O.S.K. Lines Ltd. - Key offerings
Mitsui O.S.K. Lines Ltd. - Segment focus
SWOT

15.15 Nippon Express Holdings Inc.

Nippon Express Holdings Inc. - Overview
Nippon Express Holdings Inc. - Business segments
Nippon Express Holdings Inc. - Key news
Nippon Express Holdings Inc. - Key offerings
Nippon Express Holdings Inc. - Segment focus
SWOT

15.16 Omsan Lojistik AS

Omsan Lojistik AS - Overview
Omsan Lojistik AS - Product / Service
Omsan Lojistik AS - Key offerings
SWOT

15.17 United Parcel Service Inc.

United Parcel Service Inc. - Overview
United Parcel Service Inc. - Business segments
United Parcel Service Inc. - Key news
United Parcel Service Inc. - Key offerings
United Parcel Service Inc. - Segment focus
SWOT

15.18 Wallenius Wilhelmsen ASA

Wallenius Wilhelmsen ASA - Overview
Wallenius Wilhelmsen ASA - Product / Service
Wallenius Wilhelmsen ASA - Key offerings
SWOT

16. Appendix

16.1 Scope of the report

Market definition
Objectives
Notes and caveats

16.2 Inclusions and exclusions checklist

Inclusions checklist
Exclusions checklist

16.3 Currency conversion rates for US$

16.4 Research methodology

16.5 Data procurement

Information sources

16.6 Data validation

16.7 Validation techniques employed for market sizing

16.8 Data synthesis

16.9 360 degree market analysis

16.10 List of abbreviations

Research Methodology

Technavio presents a detailed picture of the market by way of study, synthesis, and summation of data from multiple sources. The analysts have presented the various facets of the market with a particular focus on identifying the key industry influencers. The data thus presented is comprehensive, reliable, and the result of extensive research, both primary and secondary.

INFORMATION SOURCES

Primary sources

  • Manufacturers and suppliers
  • Channel partners
  • Industry experts
  • Strategic decision makers

Secondary sources

  • Industry journals and periodicals
  • Government data
  • Financial reports of key industry players
  • Historical data
  • Press releases

DATA ANALYSIS

Data Synthesis

  • Collation of data
  • Estimation of key figures
  • Analysis of derived insights

Data Validation

  • Triangulation with data models
  • Reference against proprietary databases
  • Corroboration with industry experts

REPORT WRITING

Qualitative

  • Market drivers
  • Market challenges
  • Market trends
  • Five forces analysis

Quantitative

  • Market size and forecast
  • Market segmentation
  • Geographical insights
  • Competitive landscape

Interested in this report?

Get your sample now to see our research methodology and insights!

Download Now

Frequently Asked Questions

Finished Vehicles Logistics market growth will increase by USD 28506.0 million during 2026-2030.

The Finished Vehicles Logistics market is expected to grow at a CAGR of 5.2% during 2026-2030.

Finished Vehicles Logistics market is segmented by Type (Road, Rail, Sea, Air) Service (Warehousing, Transport) Vehicle type (Passenger cars, Light commercial vehicles, Heavy commercial vehicles, Others)

ACERTUS, AP Moller Maersk AS, ARS Altmann AG, Berge Logistics, CMA CGM Group, DHL International GmbH, DP World, DSV AS, Ekol Lojistik AS, Hellmann Worldwide Logistics, Jack Cooper Logistics, Koopman Logistics Group BV, Kuehne Nagel Management AG, Mitsui O.S.K. Lines Ltd., Nippon Express Holdings Inc., Omsan Lojistik AS, Ryder System Inc., United Parcel Service Inc., Wallenius Wilhelmsen ASA, XPO Inc. are a few of the key vendors in the Finished Vehicles Logistics market.

APAC will register the highest growth rate of 55.5% among the other regions. Therefore, the Finished Vehicles Logistics market in APAC is expected to garner significant business opportunities for the vendors during the forecast period.

China, Japan, India, South Korea, Australia, Indonesia, US, Canada, Mexico, Germany, UK, France, Italy, Spain, The Netherlands, Saudi Arabia, UAE, South Africa, Israel, Turkey, Brazil, Argentina, Chile

  • Rise in electric vehicle production is the driving factor this market.

The Finished Vehicles Logistics market vendors should focus on grabbing business opportunities from the Type segment as it accounted for the largest market share in the base year.
RIA - Research AI Assistant
Ask RIA