Rheumatoid Arthritis Drugs Market Analysis North America, Europe, Asia, Rest of World (ROW) - US, UK, Germany, France, China - Size and Forecast 2024-2028

Rheumatoid Arthritis Drugs Market Analysis North America, Europe, Asia, Rest of World (ROW) - US, UK, Germany, France, China - Size and Forecast 2024-2028

Published: Oct 2023 162 Pages SKU: IRTNTR73313

Market Overview at a Glance

$16.05 B
Market Opportunity
7.5%
CAGR
6.4
YoY growth 2023-2024(%)

Rheumatoid Arthritis Drugs Market Size 2024-2028

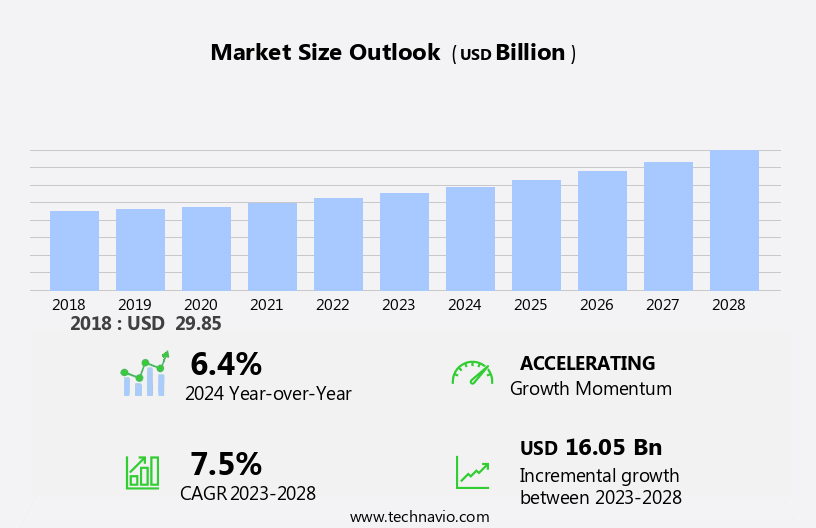
The rheumatoid arthritis drugs market size is forecast to increase by USD 16.05 billion at a CAGR of 7.5% between 2023 and 2028.

  • The market is experiencing significant growth due to several economic and healthcare factors. The increasing number of RA cases and the focus on improving patient outcomes through early diagnosis and treatment are key drivers. Additionally, an increasing number of rheumatologists and health plans offering coverage for RA treatments are contributing to market growth. The market is evolving with the integration of biotech innovations and advanced analytics, which are helping to accelerate drug development and improve personalized treatment options for patients. However, challenges persist in the form of patient non-adherence to treatment, regulatory factors, and legal requirements. ISO management and environmental regulations are crucial considerations for chemical process professionals in the production of RA drugs. Compliance with these regulations and legal requirements can be costly and time-consuming, but failure to do so can result in significant consequences. Industry professionals need to stay informed of the latest regulatory and legal developments to ensure their organizations remain competitive and compliant.

What will be the Size of the Rheumatoid Arthritis Drugs Market During the Forecast Period?

Rheumatoid Arthritis Drugs Market Size

 Request Free Sample

  • The market is witnessing significant advancements driven by the integration of technology and innovation in the pharmaceutical sector. The market is characterized by a focus on enhancing drug design, molecular modeling, and chemical analysis to develop effective treatments for RA. Chemistry plays a pivotal role in the development of RA drugs. Computer programs and molecular modeling are extensively used to simulate and analyze chemical reactions, enabling the design of new drugs with improved efficacy and reduced side effects. Molecular dynamics and quantum chemistry are advanced techniques that are gaining popularity in the industry due to their ability to provide insights into the behavior of molecules at the atomic level.
  • Data management is another critical aspect of the RA drugs market. Digitalization and automation have led to the adoption of cloud computing for storing and analyzing large datasets. This enables researchers to access real-time data and collaborate with their colleagues, leading to faster and more efficient drug development. Remote monitoring and data analytics are also transforming the RA drugs market. These technologies enable real-time monitoring of patients and their response to treatment, allowing for personalized care and improved patient outcomes. Collaboration tools facilitate communication and information sharing among healthcare professionals, leading to better coordinated care and improved patient outcomes.

How is this Rheumatoid Arthritis Drugs Industry segmented and which is the largest segment?

The industry research report provides comprehensive data (region-wise segment analysis), with forecasts and estimates in "USD billion" for the period 2024-2028, as well as historical data from 2018-2022 for the following segments.
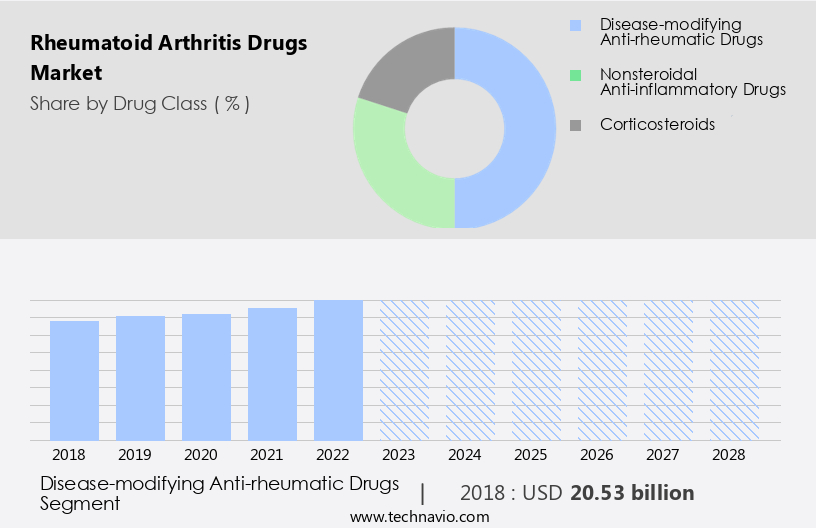
  • Drug Class
    • Disease-modifying anti-rheumatic drugs
    • Nonsteroidal anti-inflammatory drugs
    • Corticosteroids
  • Type
    • Biologics
    • Small Molecules
  • Geography
    • North America
      • US
    • Europe
      • Germany
      • UK
      • France
    • Asia
      • China
    • Rest of World (ROW)

By Drug Class Insights

  • The disease-modifying anti-rheumatic drugs segment is estimated to witness significant growth during the forecast period. Investment in the research and development of disease-modifying anti-rheumatic drugs (DMARDs) for rheumatoid arthritis continues to be a priority in the pharmaceutical industry. DMARDs, such as methotrexate, sulfasalazine, leflunomide, etanercept, and infliximab, have proven to not only alleviate the symptoms of active rheumatoid arthritis but also influence the course of the disease and improve radiological outcomes. These drugs act at the cellular level to inhibit the immune system's inflammatory response. The use of advanced technologies like chemistry, computer programs, molecular modeling, chemical analysis, data management, and laboratory automation has significantly enhanced the innovation in the development of DMARDs. Early diagnosis and treatment with DMARDs are crucial in preventing the progression of rheumatoid arthritis and minimizing the risk of irreversible joint damage.
  • When rheumatoid arthritis is diagnosed, initiating DMARD therapy is typically recommended. This proactive approach can slow or halt the disease's progression and reduce the likelihood of debilitating, persistent joint damage. The unique mechanisms of action of each DMARD make them effective in managing rheumatoid arthritis, making them essential components of treatment regimens. Investors and pharmaceutical companies are increasingly focusing on the development of DMARDs to address the unmet medical needs of rheumatoid arthritis patients. The market for these drugs is expected to grow steadily due to the increasing prevalence of rheumatoid arthritis and the need for effective treatment options.

Rheumatoid Arthritis Drugs Market Size

Get a glance at the market report of share of various segments Request Free Sample

The Disease-modifying anti-rheumatic drugs segment was valued at USD 20.53 billion in 2018 and showed a gradual increase during the forecast period.

Regional Analysis

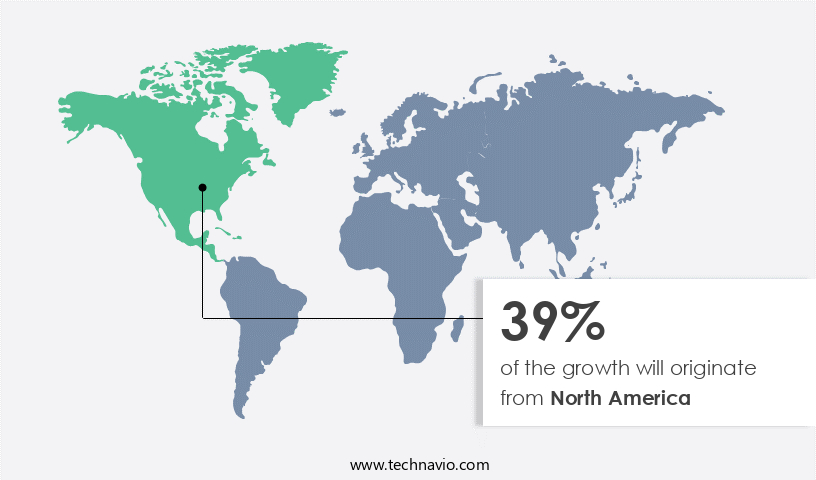
  • North America is estimated to contribute 39% to the growth of the global market during the forecast period. Technavio's analysts have elaborately explained the regional trends and drivers that shape the market during the forecast period.

Rheumatoid Arthritis Drugs Market Share by Geography

For more insights on the market size of various regions, Request Free Sample

In North America, the market holds a substantial share due to the presence of major players. The market expansion will primarily be driven by the introduction of novel biologics during the forecast period. However, the adoption of biosimilars will not be observed within the given timeframe. In terms of best business practices, cost-effectiveness, data security, safety standards, environmental impact, process optimization, inventory management, supply chain visibility, and predictive analytics are crucial elements for market success. Ensuring these aspects are addressed will enable companies to maintain a competitive edge in the RA Drugs Market.

Market Dynamics

Our researchers analyzed the data with 2023 as the base year, along with the key drivers, trends, and challenges. A holistic analysis of drivers will help companies refine their marketing strategies to gain a competitive advantage.

What are the key market drivers leading to the rise in the adoption of Rheumatoid Arthritis Drugs Industry?

  • Rising cases of RA and a focus on increasing the number of rheumatologists is the key driver of the market. Rheumatoid Arthritis (RA) is a widespread condition affecting an estimated 17.6 million individuals worldwide, as reported by the National Library of Medicine. The global age-standardized prevalence rate of RA was 208.8 cases per 100,000 population in 2020. The significant number of RA cases is anticipated to fuel the expansion of the market. Furthermore, according to the Centers for Disease Control and Prevention, there is a pressing requirement to expand the healthcare workforce, specifically in the field of rheumatology.
  • Rheumatologists, who specialize in diagnosing and managing joint, muscle, and bone diseases, are in high demand. This need for skilled healthcare professionals underscores the importance of the market. In the market, the integration of legacy software systems in the healthcare sector and the increasing disposable incomes of consumers are key factors driving the growth of the market. The use of specialty chemicals and petrochemicals in the production of these drugs is also a significant trend.

What are the market trends shaping the Rheumatoid Arthritis Drugs Industry?

  • Health plan offerings for RA is the upcoming market trend. In the United States, the expense of managing Rheumatoid Arthritis (RA) continues to escalate, despite regulatory efforts to contain costs. The cost of popular RA treatments, such as HUMIRA and Enbrel, has risen significantly. For instance, the wholesale price of HUMIRA has nearly doubled, increasing by approximately 65% in the US market. Although non-biologic drugs like NSAIDs have lower prices, their long-term use can lead to substantial health burdens. The high cost of RA treatment is a significant concern for patients and healthcare providers.
  • The escalating prices of RA drugs necessitate ongoing dialogue between stakeholders, including regulatory bodies, pharmaceutical companies, and healthcare providers, to find cost-effective solutions while ensuring the best possible patient care.

What challenges does the Rheumatoid Arthritis Drugs Industry face during its growth?

  • Patient nonadherence to treatment is a key challenge affecting the industry growth. In the economic landscape of Rheumatoid Arthritis (RA) drug therapy, ensuring patient adherence to treatment is a significant challenge. According to research, approximately 30-80% of RA patients do not fully comply with their prescribed medication regimens. This non adherence can be attributed to various factors, including patients' beliefs about medication, self-medication, and altering dosages without consulting healthcare professionals. Treatment adherence is crucial for achieving the full therapeutic benefit of drugs. It encompasses the initiation of medication, adherence to the prescribed dosing schedule, and proper discontinuation. The chemical process of RA drug production must adhere to stringent regulatory and legal factors, including ISO management and environmental regulations.
  • These requirements ensure the safety and efficacy of the drugs. As chemical professionals, it is essential to recognize the importance of patient adherence in the RA drug market. By addressing the root causes of nonadherence, such as improving patient education and communication, we can enhance the overall effectiveness of RA drug therapy. This, in turn, can lead to better patient outcomes and reduced healthcare costs. Maintaining a professional and formal tone, it is essential to acknowledge the importance of patient adherence in the RA drug market. Approximately 30-80% of RA patients do not fully comply with their prescribed medication regimens, which can be attributed to various factors, including patients' beliefs about medication, self-medication, and altering dosages without consulting healthcare professionals.

Exclusive Customer Landscape

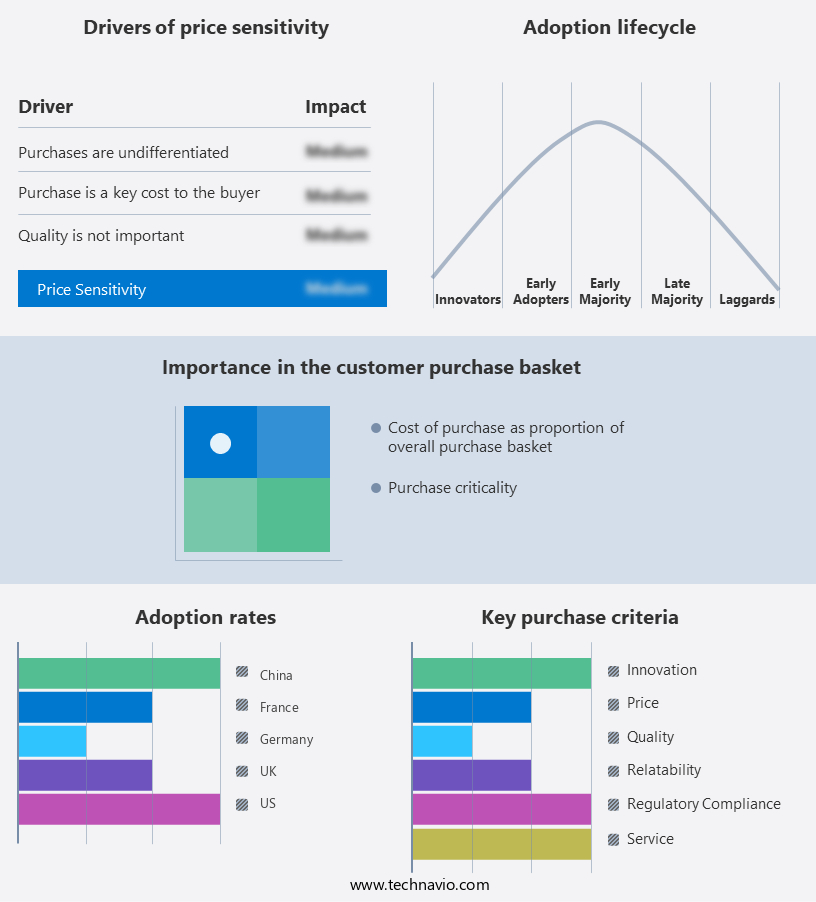
The market forecasting report includes the adoption lifecycle of the market, covering from the innovator's stage to the laggard's stage. It focuses on adoption rates in different regions based on penetration. Furthermore, the market report also includes key purchase criteria and drivers of price sensitivity to help companies evaluate and develop their market growth analysis strategies.

Rheumatoid Arthritis Drugs Market Share by Geography

 Customer Landscape

Key Companies & Market Insights

Companies are implementing various strategies, such as strategic alliances, market forecast, partnerships, mergers and acquisitions, geographical expansion, and product/service launches, to enhance their presence in the industry.

The industry research and growth report includes detailed analyses of the competitive landscape of the market and information about key companies, including:

  • AbbVie Inc.
  • Amgen Inc.
  • Astellas Pharma Inc.
  • Bristol Myers Squibb Co.
  • Eli Lilly and Co.
  • F. Hoffmann La Roche Ltd.
  • Galmed Pharmaceuticals Ltd.
  • Genor Biopharma Holdings Ltd.
  • Gilde Healthcare
  • Gilead Sciences Inc.
  • GlaxoSmithKline Plc
  • Johnson and Johnson
  • Kangstem Biotech Co. Ltd.
  • Novartis AG
  • Oryn Therapeutics
  • Pfizer Inc.
  • Sanofi
  • Sorrento Therapeutics Inc.
  • Taisho Pharmaceutical Holdings Co. Ltd.
  • UCB SA

Qualitative and quantitative analysis of companies has been conducted to help clients understand the wider business environment as well as the strengths and weaknesses of key industry players. Data is qualitatively analyzed to categorize companies as pure play, category-focused, industry-focused, and diversified; it is quantitatively analyzed to categorize companies as dominant, leading, strong, tentative, and weak.

Research Analyst Overview

The market is experiencing significant growth due to the increasing prevalence of rheumatoid arthritis and the ongoing research and development in advanced technologies for drug design and manufacturing. The market is driven by innovation and investment in chemistry, computer programs, molecular modeling, and chemical analysis. Leading companies are focusing on digitalization and automation to enhance process optimization, inventory management, and supply chain visibility. Advanced technologies such as molecular dynamics, quantum chemistry, and digitalization are revolutionizing the industry by enabling remote monitoring, data analytics, collaboration tools, and cloud computing. These technologies offer scalability, flexibility, cost-effectiveness, data security, safety standards, and environmental impact reduction.

Moreover, the market is competitive, with companies adopting various pricing strategies to gain a competitive edge. Factors influencing the market include regulatory factors, legal requirements, and environmental regulations. Chemical professionals are increasingly focusing on ISO management and regulatory compliance to ensure the safety and efficacy of rheumatoid arthritis drugs. Despite the challenges of legacy software integration issues and the high cost of advanced technologies, the market is expected to grow significantly due to the increasing disposable incomes of consumers in the consumer goods, automobiles, and petrochemicals industries. The market is also driven by the potential for new drug discoveries and the increasing demand for specialty chemicals.

Market Scope

Report Coverage

Details

Page number

162

Base year

2023

Historic period

2018-2022

Forecast period

2024-2028

Growth momentum & CAGR

Accelerate at a CAGR of 7.5%

Market growth 2024-2028

USD 16.05 billion

Market structure

Fragmented

YoY growth 2023-2024(%)

6.4

Key countries

US, UK, Germany, France, and China

Competitive landscape

Leading Companies, Market Positioning of Companies, Competitive Strategies, and Industry Risks

Request Free Sample

What are the Key Data Covered in this Rheumatoid Arthritis Drugs Market Research and Growth Report?

  • CAGR of the Rheumatoid Arthritis Drugs industry during the forecast period
  • Detailed information on factors that will drive the market growth and forecasting between 2024 and 2028
  • Precise estimation of the size of the market and its contribution of the industry in focus to the parent market
  • Accurate predictions about upcoming growth and trends and changes in consumer behaviour
  • Growth of the market across North America, Europe, Asia, and Rest of World (ROW)
  • Thorough analysis of the market's competitive landscape and detailed information about companies
  • Comprehensive analysis of factors that will challenge the rheumatoid arthritis drugs market growth of industry companies

We can help! Our analysts can customize this rheumatoid arthritis drugs market research report to meet your requirements.

Get in touch

1 Executive Summary

  • 1.1 Market overview
    • Exhibit 01: Executive Summary – Chart on Market Overview
    • Exhibit 02: Executive Summary – Data Table on Market Overview
    • Exhibit 03: Executive Summary – Chart on Global Market Characteristics
    • Exhibit 04: Executive Summary – Chart on Market by Geography
    • Exhibit 05: Executive Summary – Chart on Market Segmentation by Drug Class
    • Exhibit 06: Executive Summary – Chart on Market Segmentation by Type
    • Exhibit 07: Executive Summary – Chart on Incremental Growth
    • Exhibit 08: Executive Summary – Data Table on Incremental Growth
    • Exhibit 09: Executive Summary – Chart on Vendor Market Positioning

2 Market Landscape

  • 2.1 Market ecosystem
    • Exhibit 10: Parent market
    • Exhibit 11: Market Characteristics

3 Market Sizing

  • 3.1 Market definition
    • Exhibit 12: Offerings of vendors included in the market definition
  • 3.2 Market segment analysis
    • Exhibit 13: Market segments
  • 3.3 Market size 2023
    • 3.4 Market outlook: Forecast for 2023-2028
      • Exhibit 14: Chart on Global - Market size and forecast 2023-2028 ($ billion)
      • Exhibit 15: Data Table on Global - Market size and forecast 2023-2028 ($ billion)
      • Exhibit 16: Chart on Global Market: Year-over-year growth 2023-2028 (%)
      • Exhibit 17: Data Table on Global Market: Year-over-year growth 2023-2028 (%)

    4 Historic Market Size

    • 4.1 Global rheumatoid arthritis drugs market 2018 - 2022
      • Exhibit 18: Historic Market Size – Data Table on global rheumatoid arthritis drugs market 2018 - 2022 ($ billion)
    • 4.2 Drug Class Segment Analysis 2018 - 2022
      • Exhibit 19: Historic Market Size – Drug Class Segment 2018 - 2022 ($ billion)
    • 4.3 Type Segment Analysis 2018 - 2022
      • Exhibit 20: Historic Market Size – Type Segment 2018 - 2022 ($ billion)
    • 4.4 Geography Segment Analysis 2018 - 2022
      • Exhibit 21: Historic Market Size – Geography Segment 2018 - 2022 ($ billion)
    • 4.5 Country Segment Analysis 2018 - 2022
      • Exhibit 22: Historic Market Size – Country Segment 2018 - 2022 ($ billion)

    5 Five Forces Analysis

    • 5.1 Five forces summary
      • Exhibit 23: Five forces analysis - Comparison between 2023 and 2028
    • 5.2 Bargaining power of buyers
      • Exhibit 24: Chart on Bargaining power of buyers – Impact of key factors 2023 and 2028
    • 5.3 Bargaining power of suppliers
      • Exhibit 25: Bargaining power of suppliers – Impact of key factors in 2023 and 2028
    • 5.4 Threat of new entrants
      • Exhibit 26: Threat of new entrants – Impact of key factors in 2023 and 2028
    • 5.5 Threat of substitutes
      • Exhibit 27: Threat of substitutes – Impact of key factors in 2023 and 2028
    • 5.6 Threat of rivalry
      • Exhibit 28: Threat of rivalry – Impact of key factors in 2023 and 2028
    • 5.7 Market condition
      • Exhibit 29: Chart on Market condition - Five forces 2023 and 2028

    6 Market Segmentation by Drug Class

    • 6.1 Market segments
      • Exhibit 30: Chart on Drug Class - Market share 2023-2028 (%)
      • Exhibit 31: Data Table on Drug Class - Market share 2023-2028 (%)
    • 6.2 Comparison by Drug Class
      • Exhibit 32: Chart on Comparison by Drug Class
      • Exhibit 33: Data Table on Comparison by Drug Class
    • 6.3 Disease-modifying anti-rheumatic drugs - Market size and forecast 2023-2028
      • Exhibit 34: Chart on Disease-modifying anti-rheumatic drugs - Market size and forecast 2023-2028 ($ billion)
      • Exhibit 35: Data Table on Disease-modifying anti-rheumatic drugs - Market size and forecast 2023-2028 ($ billion)
      • Exhibit 36: Chart on Disease-modifying anti-rheumatic drugs - Year-over-year growth 2023-2028 (%)
      • Exhibit 37: Data Table on Disease-modifying anti-rheumatic drugs - Year-over-year growth 2023-2028 (%)
    • 6.4 Nonsteroidal anti-inflammatory drugs - Market size and forecast 2023-2028
      • Exhibit 38: Chart on Nonsteroidal anti-inflammatory drugs - Market size and forecast 2023-2028 ($ billion)
      • Exhibit 39: Data Table on Nonsteroidal anti-inflammatory drugs - Market size and forecast 2023-2028 ($ billion)
      • Exhibit 40: Chart on Nonsteroidal anti-inflammatory drugs - Year-over-year growth 2023-2028 (%)
      • Exhibit 41: Data Table on Nonsteroidal anti-inflammatory drugs - Year-over-year growth 2023-2028 (%)
    • 6.5 Corticosteroids - Market size and forecast 2023-2028
      • Exhibit 42: Chart on Corticosteroids - Market size and forecast 2023-2028 ($ billion)
      • Exhibit 43: Data Table on Corticosteroids - Market size and forecast 2023-2028 ($ billion)
      • Exhibit 44: Chart on Corticosteroids - Year-over-year growth 2023-2028 (%)
      • Exhibit 45: Data Table on Corticosteroids - Year-over-year growth 2023-2028 (%)
    • 6.6 Market opportunity by Drug Class
      • Exhibit 46: Market opportunity by Drug Class ($ billion)
      • Exhibit 47: Data Table on Market opportunity by Drug Class ($ billion)

    7 Market Segmentation by Type

    • 7.1 Market segments
      • Exhibit 48: Chart on Type - Market share 2023-2028 (%)
      • Exhibit 49: Data Table on Type - Market share 2023-2028 (%)
    • 7.2 Comparison by Type
      • Exhibit 50: Chart on Comparison by Type
      • Exhibit 51: Data Table on Comparison by Type
    • 7.3 Biologics - Market size and forecast 2023-2028
      • Exhibit 52: Chart on Biologics - Market size and forecast 2023-2028 ($ billion)
      • Exhibit 53: Data Table on Biologics - Market size and forecast 2023-2028 ($ billion)
      • Exhibit 54: Chart on Biologics - Year-over-year growth 2023-2028 (%)
      • Exhibit 55: Data Table on Biologics - Year-over-year growth 2023-2028 (%)
    • 7.4 Small Molecules - Market size and forecast 2023-2028
      • Exhibit 56: Chart on Small Molecules - Market size and forecast 2023-2028 ($ billion)
      • Exhibit 57: Data Table on Small Molecules - Market size and forecast 2023-2028 ($ billion)
      • Exhibit 58: Chart on Small Molecules - Year-over-year growth 2023-2028 (%)
      • Exhibit 59: Data Table on Small Molecules - Year-over-year growth 2023-2028 (%)
    • 7.5 Market opportunity by Type
      • Exhibit 60: Market opportunity by Type ($ billion)
      • Exhibit 61: Data Table on Market opportunity by Type ($ billion)

    8 Customer Landscape

    • 8.1 Customer landscape overview
      • Exhibit 62: Analysis of price sensitivity, lifecycle, customer purchase basket, adoption rates, and purchase criteria

    9 Geographic Landscape

    • 9.1 Geographic segmentation
      • Exhibit 63: Chart on Market share by geography 2023-2028 (%)
      • Exhibit 64: Data Table on Market share by geography 2023-2028 (%)
    • 9.2 Geographic comparison
      • Exhibit 65: Chart on Geographic comparison
      • Exhibit 66: Data Table on Geographic comparison
    • 9.3 North America - Market size and forecast 2023-2028
      • Exhibit 67: Chart on North America - Market size and forecast 2023-2028 ($ billion)
      • Exhibit 68: Data Table on North America - Market size and forecast 2023-2028 ($ billion)
      • Exhibit 69: Chart on North America - Year-over-year growth 2023-2028 (%)
      • Exhibit 70: Data Table on North America - Year-over-year growth 2023-2028 (%)
    • 9.4 Europe - Market size and forecast 2023-2028
      • Exhibit 71: Chart on Europe - Market size and forecast 2023-2028 ($ billion)
      • Exhibit 72: Data Table on Europe - Market size and forecast 2023-2028 ($ billion)
      • Exhibit 73: Chart on Europe - Year-over-year growth 2023-2028 (%)
      • Exhibit 74: Data Table on Europe - Year-over-year growth 2023-2028 (%)
    • 9.5 Asia - Market size and forecast 2023-2028
      • Exhibit 75: Chart on Asia - Market size and forecast 2023-2028 ($ billion)
      • Exhibit 76: Data Table on Asia - Market size and forecast 2023-2028 ($ billion)
      • Exhibit 77: Chart on Asia - Year-over-year growth 2023-2028 (%)
      • Exhibit 78: Data Table on Asia - Year-over-year growth 2023-2028 (%)
    • 9.6 Rest of World (ROW) - Market size and forecast 2023-2028
      • Exhibit 79: Chart on Rest of World (ROW) - Market size and forecast 2023-2028 ($ billion)
      • Exhibit 80: Data Table on Rest of World (ROW) - Market size and forecast 2023-2028 ($ billion)
      • Exhibit 81: Chart on Rest of World (ROW) - Year-over-year growth 2023-2028 (%)
      • Exhibit 82: Data Table on Rest of World (ROW) - Year-over-year growth 2023-2028 (%)
    • 9.7 US - Market size and forecast 2023-2028
      • Exhibit 83: Chart on US - Market size and forecast 2023-2028 ($ billion)
      • Exhibit 84: Data Table on US - Market size and forecast 2023-2028 ($ billion)
      • Exhibit 85: Chart on US - Year-over-year growth 2023-2028 (%)
      • Exhibit 86: Data Table on US - Year-over-year growth 2023-2028 (%)
    • 9.8 UK - Market size and forecast 2023-2028
      • Exhibit 87: Chart on UK - Market size and forecast 2023-2028 ($ billion)
      • Exhibit 88: Data Table on UK - Market size and forecast 2023-2028 ($ billion)
      • Exhibit 89: Chart on UK - Year-over-year growth 2023-2028 (%)
      • Exhibit 90: Data Table on UK - Year-over-year growth 2023-2028 (%)
    • 9.9 China - Market size and forecast 2023-2028
      • Exhibit 91: Chart on China - Market size and forecast 2023-2028 ($ billion)
      • Exhibit 92: Data Table on China - Market size and forecast 2023-2028 ($ billion)
      • Exhibit 93: Chart on China - Year-over-year growth 2023-2028 (%)
      • Exhibit 94: Data Table on China - Year-over-year growth 2023-2028 (%)
    • 9.10 Germany - Market size and forecast 2023-2028
      • Exhibit 95: Chart on Germany - Market size and forecast 2023-2028 ($ billion)
      • Exhibit 96: Data Table on Germany - Market size and forecast 2023-2028 ($ billion)
      • Exhibit 97: Chart on Germany - Year-over-year growth 2023-2028 (%)
      • Exhibit 98: Data Table on Germany - Year-over-year growth 2023-2028 (%)
    • 9.11 France - Market size and forecast 2023-2028
      • Exhibit 99: Chart on France - Market size and forecast 2023-2028 ($ billion)
      • Exhibit 100: Data Table on France - Market size and forecast 2023-2028 ($ billion)
      • Exhibit 101: Chart on France - Year-over-year growth 2023-2028 (%)
      • Exhibit 102: Data Table on France - Year-over-year growth 2023-2028 (%)
    • 9.12 Market opportunity by geography
      • Exhibit 103: Market opportunity by geography ($ billion)
      • Exhibit 104: Data Tables on Market opportunity by geography ($ billion)

    10 Drivers, Challenges, and Trends

    • 10.1 Market drivers
      • 10.2 Market challenges
        • 10.3 Impact of drivers and challenges
          • Exhibit 105: Impact of drivers and challenges in 2023 and 2028
        • 10.4 Market trends

          11 Vendor Landscape

          • 11.1 Overview
            • 11.2 Vendor landscape
              • Exhibit 106: Overview on Criticality of inputs and Factors of differentiation
            • 11.3 Landscape disruption
              • Exhibit 107: Overview on factors of disruption
            • 11.4 Industry risks
              • Exhibit 108: Impact of key risks on business

            12 Vendor Analysis

            • 12.1 Vendors covered
              • Exhibit 109: Vendors covered
            • 12.2 Market positioning of vendors
              • Exhibit 110: Matrix on vendor position and classification
            • 12.3 AbbVie Inc.
              • Exhibit 111: AbbVie Inc. - Overview
              • Exhibit 112: AbbVie Inc. - Product / Service
              • Exhibit 113: AbbVie Inc. - Key news
              • Exhibit 114: AbbVie Inc. - Key offerings
            • 12.4 Amgen Inc.
              • Exhibit 115: Amgen Inc. - Overview
              • Exhibit 116: Amgen Inc. - Product / Service
              • Exhibit 117: Amgen Inc. - Key offerings
            • 12.5 Bristol Myers Squibb Co.
              • Exhibit 118: Bristol Myers Squibb Co. - Overview
              • Exhibit 119: Bristol Myers Squibb Co. - Product / Service
              • Exhibit 120: Bristol Myers Squibb Co. - Key news
              • Exhibit 121: Bristol Myers Squibb Co. - Key offerings
            • 12.6 Eli Lilly and Co.
              • Exhibit 122: Eli Lilly and Co. - Overview
              • Exhibit 123: Eli Lilly and Co. - Product / Service
              • Exhibit 124: Eli Lilly and Co. - Key news
              • Exhibit 125: Eli Lilly and Co. - Key offerings
            • 12.7 F. Hoffmann La Roche Ltd.
              • Exhibit 126: F. Hoffmann La Roche Ltd. - Overview
              • Exhibit 127: F. Hoffmann La Roche Ltd. - Business segments
              • Exhibit 128: F. Hoffmann La Roche Ltd. - Key news
              • Exhibit 129: F. Hoffmann La Roche Ltd. - Key offerings
              • Exhibit 130: F. Hoffmann La Roche Ltd. - Segment focus
            • 12.8 Genor Biopharma Holdings Ltd.
              • Exhibit 131: Genor Biopharma Holdings Ltd. - Overview
              • Exhibit 132: Genor Biopharma Holdings Ltd. - Product / Service
              • Exhibit 133: Genor Biopharma Holdings Ltd. - Key offerings
            • 12.9 Gilead Sciences Inc.
              • Exhibit 134: Gilead Sciences Inc. - Overview
              • Exhibit 135: Gilead Sciences Inc. - Product / Service
              • Exhibit 136: Gilead Sciences Inc. - Key news
              • Exhibit 137: Gilead Sciences Inc. - Key offerings
            • 12.10 Johnson and Johnson
              • Exhibit 138: Johnson and Johnson - Overview
              • Exhibit 139: Johnson and Johnson - Business segments
              • Exhibit 140: Johnson and Johnson - Key news
              • Exhibit 141: Johnson and Johnson - Key offerings
              • Exhibit 142: Johnson and Johnson - Segment focus
            • 12.11 Kangstem Biotech Co. Ltd.
              • Exhibit 143: Kangstem Biotech Co. Ltd. - Overview
              • Exhibit 144: Kangstem Biotech Co. Ltd. - Product / Service
              • Exhibit 145: Kangstem Biotech Co. Ltd. - Key offerings
            • 12.12 Novartis AG
              • Exhibit 146: Novartis AG - Overview
              • Exhibit 147: Novartis AG - Business segments
              • Exhibit 148: Novartis AG - Key offerings
              • Exhibit 149: Novartis AG - Segment focus
            • 12.13 Oryn Therapeutics
              • Exhibit 150: Oryn Therapeutics - Overview
              • Exhibit 151: Oryn Therapeutics - Product / Service
              • Exhibit 152: Oryn Therapeutics - Key offerings
            • 12.14 Pfizer Inc.
              • Exhibit 153: Pfizer Inc. - Overview
              • Exhibit 154: Pfizer Inc. - Product / Service
              • Exhibit 155: Pfizer Inc. - Key news
              • Exhibit 156: Pfizer Inc. - Key offerings
            • 12.15 Sanofi
              • Exhibit 157: Sanofi - Overview
              • Exhibit 158: Sanofi - Business segments
              • Exhibit 159: Sanofi - Key news
              • Exhibit 160: Sanofi - Key offerings
              • Exhibit 161: Sanofi - Segment focus
            • 12.16 Sorrento Therapeutics Inc.
              • Exhibit 162: Sorrento Therapeutics Inc. - Overview
              • Exhibit 163: Sorrento Therapeutics Inc. - Business segments
              • Exhibit 164: Sorrento Therapeutics Inc. - Key offerings
              • Exhibit 165: Sorrento Therapeutics Inc. - Segment focus
            • 12.17 UCB SA
              • Exhibit 166: UCB SA - Overview
              • Exhibit 167: UCB SA - Product / Service
              • Exhibit 168: UCB SA - Key offerings

            13 Appendix

            • 13.1 Scope of the report
              • 13.2 Inclusions and exclusions checklist
                • Exhibit 169: Inclusions checklist
                • Exhibit 170: Exclusions checklist
              • 13.3 Currency conversion rates for US$
                • Exhibit 171: Currency conversion rates for US$
              • 13.4 Research methodology
                • Exhibit 172: Research methodology
                • Exhibit 173: Validation techniques employed for market sizing
                • Exhibit 174: Information sources
              • 13.5 List of abbreviations
                • Exhibit 175: List of abbreviations

              Research Methodology

              Technavio presents a detailed picture of the market by way of study, synthesis, and summation of data from multiple sources. The analysts have presented the various facets of the market with a particular focus on identifying the key industry influencers. The data thus presented is comprehensive, reliable, and the result of extensive research, both primary and secondary.

              INFORMATION SOURCES

              Primary sources

              • Manufacturers and suppliers
              • Channel partners
              • Industry experts
              • Strategic decision makers

              Secondary sources

              • Industry journals and periodicals
              • Government data
              • Financial reports of key industry players
              • Historical data
              • Press releases

              DATA ANALYSIS

              Data Synthesis

              • Collation of data
              • Estimation of key figures
              • Analysis of derived insights

              Data Validation

              • Triangulation with data models
              • Reference against proprietary databases
              • Corroboration with industry experts

              REPORT WRITING

              Qualitative

              • Market drivers
              • Market challenges
              • Market trends
              • Five forces analysis

              Quantitative

              • Market size and forecast
              • Market segmentation
              • Geographical insights
              • Competitive landscape

              Interested in this report?

              Get your sample now to see our research methodology and insights!

              Download Now

              Frequently Asked Questions

              Rheumatoid Arthritis Drugs market growth will increase by $ 16.05 bn during 2024-2028 .

              The Rheumatoid Arthritis Drugs market is expected to grow at a CAGR of 7.5% during 2024-2028 .

              Rheumatoid Arthritis Drugs market is segmented by Drug Class( Disease-modifying anti-rheumatic drugs, Nonsteroidal anti-inflammatory drugs, Corticosteroids) Type( Biologics, Small Molecules, Asia, Rest of World (ROW))

              AbbVie Inc., Amgen Inc., Astellas Pharma Inc., Bristol Myers Squibb Co., Eli Lilly and Co., F. Hoffmann La Roche Ltd., Galmed Pharmaceuticals Ltd., Genor Biopharma Holdings Ltd., Gilde Healthcare, Gilead Sciences Inc., GlaxoSmithKline Plc, Johnson and Johnson, Kangstem Biotech Co. Ltd., Novartis AG, Oryn Therapeutics, Pfizer Inc., Sanofi, Sorrento Therapeutics Inc., Taisho Pharmaceutical Holdings Co. Ltd., UCB SA are a few of the key vendors in the Rheumatoid Arthritis Drugs market.

              North America will register the highest growth rate of 39% among the other regions. Therefore, the Rheumatoid Arthritis Drugs market in North America is expected to garner significant business opportunities for the vendors during the forecast period.

              US, UK, Germany, France, China

              • Rising cases of RA and focus on increasing number of rheumatologistsRA is one of the most prevalent diseases worldwide. According to the National Library of Medicine is the driving factor this market.
              • an estimated 17.6 million people had RA globally in 2020. Moreover is the driving factor this market.
              • the age-standardized global prevalence rate of RA was 208.8 cases per 100 is the driving factor this market.
              • 000 population. The high number of cases of RA is expected to positively affect the growth of the rheumatoid arthritis drugs market globally. Also is the driving factor this market.
              • as per the Centers for Disease Control is the driving factor this market.
              • there is an urgent need to increase the workforce in the healthcare sector is the driving factor this market.
              • especially rheumatologists. Rheumatologists are physicians who are experienced in the diagnosis and treatment of arthritis and other diseases of the joints is the driving factor this market.
              • muscles is the driving factor this market.
              • and bones. The number and availability of rheumatologists should be increased to meet the demands of patients. There are several associations that include rheumatology specialists is the driving factor this market.
              • such as the Indian Rheumatology Association (IRA). IRA aims to fight against arthritis by means of regular scientific workshops is the driving factor this market.
              • conferences is the driving factor this market.
              • symposia is the driving factor this market.
              • and special interest groups. Such associations are increasingly emerging across the world. Thus is the driving factor this market.
              • the growing cases of RA and the focus on an increasing number of rheumatologists are expected to drive the growth of the global rheumatoid arthritis drugs market during the forecast period. is the driving factor this market.

              The Rheumatoid Arthritis Drugs market vendors should focus on grabbing business opportunities from the Disease-modifying anti-rheumatic drugs segment as it accounted for the largest market share in the base year.