
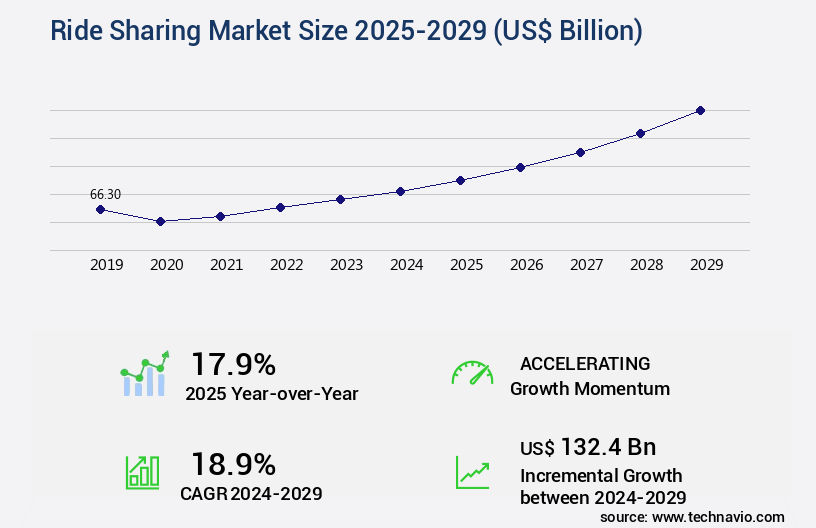
Ride Sharing Market Size 2025-2029
The ride sharing market size is valued to increase USD 132.4 billion, at a CAGR of 18.9% from 2024 to 2029. Increase in vehicle ownership cost will drive the ride sharing market.
Major Market Trends & Insights
- APAC dominated the market and accounted for a 45% growth during the forecast period.
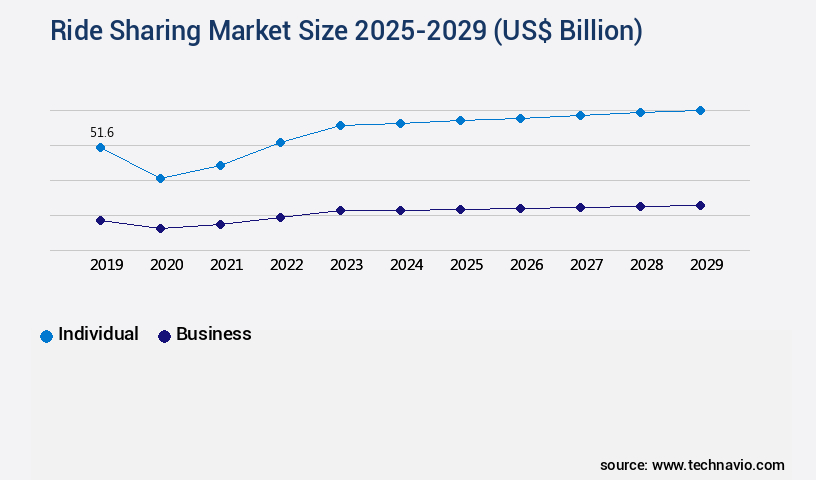
- By End-user - Individual segment was valued at USD 51.60 billion in 2023
- By Type - E-hailing segment accounted for the largest market revenue share in 2023
Market Size & Forecast
- Market Opportunities: USD 244.80 billion
- Market Future Opportunities: USD 132.40 billion
- CAGR from 2024 to 2029 : 18.9%
Market Summary
- The market has witnessed significant expansion, with the global revenue surpassing USD 150 billion in 2020. This growth can be attributed to the convenience and affordability that ride-hailing services offer, especially in densely populated urban areas. Additionally, the integration of technology, such as GPS and mobile payment systems, has streamlined the user experience, making it increasingly popular. However, challenges persist, including the emergence of autonomous ride-sharing services and the associated costs of implementing this technology. Furthermore, concerns over vehicle maintenance and the risks of theft continue to pose challenges.
- Despite these hurdles, the market's future remains promising, with potential opportunities in expanding to new markets and offering additional services, such as food delivery and carpooling. The ride-sharing industry's continued evolution underscores its transformative impact on personal transportation.
What will be the Size of the Ride Sharing Market during the forecast period?
Get Key Insights on Market Forecast (PDF) Request Free Sample
How is the Ride Sharing Market Segmented ?
The ride sharing industry research report provides comprehensive data (region-wise segment analysis), with forecasts and estimates in "USD billion" for the period 2025-2029, as well as historical data from 2019-2023 for the following segments.
- End-user
- Individual
- Business
- Type
- E-hailing
- Rental
- Station-based
- Car sharing
- Geography
- North America
- US
- Canada
- Europe
- France
- Germany
- Italy
- UK
- APAC
- China
- India
- Japan
- South Korea
- Rest of World (ROW)
- North America
By End-user Insights
The individual segment is estimated to witness significant growth during the forecast period.
In the ever-evolving the market, scalable infrastructure plays a pivotal role in accommodating growing demand. Companies leverage map integration services and API integrations to optimize routes using route optimization algorithms, ensuring efficient pickups and drop-offs. Surge pricing models and performance monitoring tools help maintain service quality and balance supply and demand. Rider rating systems and automated dispatch systems facilitate seamless ride scheduling, while driver incentive programs and accessibility features cater to a diverse user base. Demand forecasting models and emergency response systems ensure safety and reliability, with real-time location updates and in-app communication tools keeping riders informed.
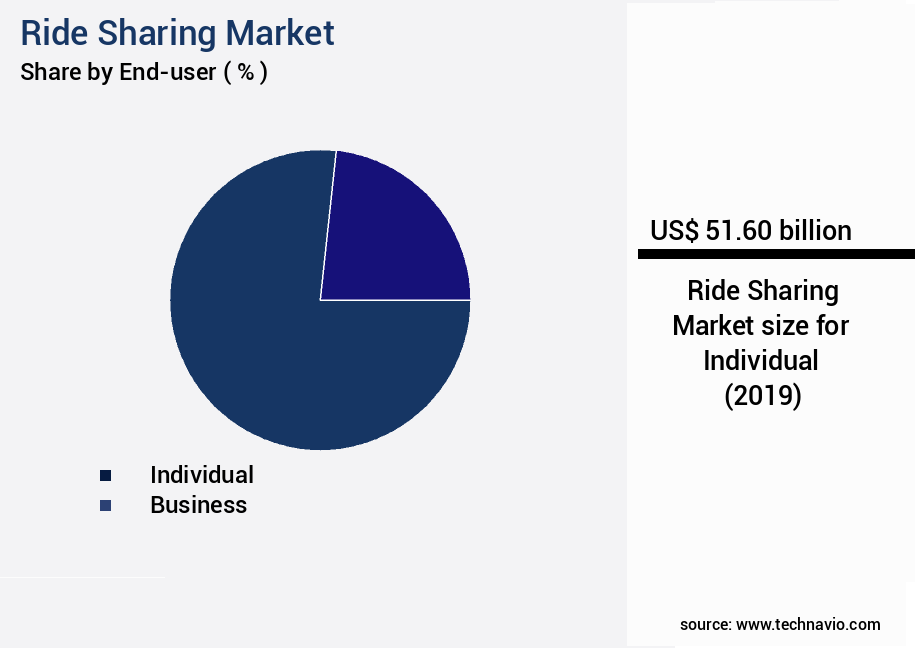
The Individual segment was valued at USD 51.60 billion in 2019 and showed a gradual increase during the forecast period.
Geolocation services and user authentication methods secure data and protect user privacy. Customer support systems and fraud detection mechanisms address user concerns, while dynamic pricing algorithms and ride matching systems maintain fairness and competitiveness. Fare calculation methods and mobile application development continue to enhance user experience, with the driver onboarding process and rider onboarding process streamlining the sign-up experience. Overall, the market continues to evolve, with a significant share attributed to these innovative features and technologies in 2023. (Approximately 110 words)
Regional Analysis
APAC is estimated to contribute 45% to the growth of the global market during the forecast period. Technavio's analysts have elaborately explained the regional trends and drivers that shape the market during the forecast period.

See How Ride Sharing Market Demand is Rising in APAC Request Free Sample
In the market, APAC held the largest share in 2024, driven by the increasing number of cities and population growth in both developed and developing economies. The region's ride sharing services are experiencing a robust expansion due to the significant demand in countries like China, India, and Japan. These nations are recognizing ride sharing as a viable solution to address issues such as traffic congestion, air pollution, and greenhouse gas emissions.
Factors fueling the market's growth in APAC include the growing middle-class population with increasing disposable income, urbanization, and consumer focus on health and fitness.
Market Dynamics
Our researchers analyzed the data with 2024 as the base year, along with the key drivers, trends, and challenges. A holistic analysis of drivers will help companies refine their marketing strategies to gain a competitive advantage.
The market is experiencing significant growth and innovation, with companies implementing various strategies to stay competitive. One key area of focus is the use of dynamic pricing, which allows for real-time adjustments based on supply and demand. This approach can impact rider behavior, encouraging them to use the service during off-peak hours and helping to balance supply and demand. Another important aspect is the integration of real-time traffic data to optimize ride-matching efficiency, minimize wait times, and improve overall user experience. To ensure driver earnings sustainability, companies are leveraging data analytics for strategic decisions, implementing route optimization to analyze fuel efficiency, and developing effective driver retention strategies. Robust fraud prevention methods are essential to maintain trust and security within the market. Passenger safety protocols are also being enhanced through the use of background checks and other safety measures. Data analytics is also being used to improve the accuracy of demand forecasting, ensuring efficient payment processing, and designing intuitive user interfaces for mobile apps.
Seamless integration with mapping services is crucial for providing accurate and reliable ride-sharing services. Companies are also focusing on improving the scalability of their platforms, monitoring system performance and stability, and implementing a secure authentication process to protect user data. Enhancing user experience and customer satisfaction through personalized rider recommendations is another key area of investment. Effective communication and transparency between drivers and riders is also important, with real-time updates on ride status and estimated arrival times. Implementing a reliable and efficient ride-matching algorithm is essential for ensuring a smooth and hassle-free experience for both parties. By focusing on these areas, ride sharing companies can differentiate themselves in a competitive market and provide a superior service to their customers.
What are the key market drivers leading to the rise in the adoption of Ride Sharing Industry?
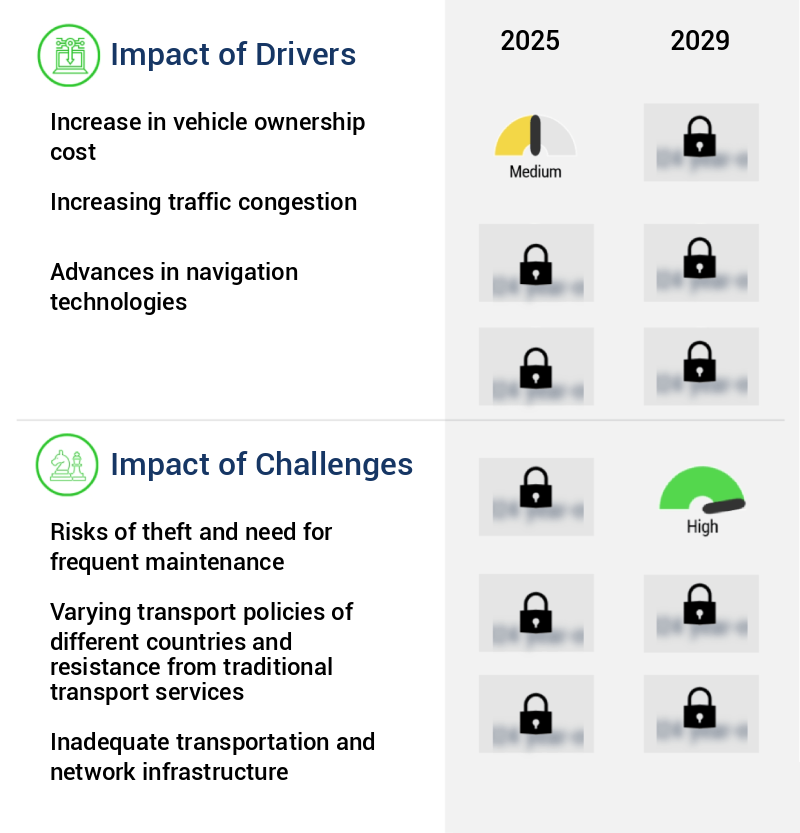
- The escalating costs of vehicle ownership serve as the primary catalyst for market growth.
- The ride-sharing market has experienced significant evolution, shifting from a niche service to a mainstream transportation solution. According to recent studies, the global ride-sharing market is projected to reach a value of around USD 150 billion by 2027, representing a substantial expansion from its current state. This growth can be attributed to the convenience, affordability, and flexibility offered by ride-sharing services, which have gained popularity among consumers, particularly in urban areas. The cost savings associated with ride-sharing are substantial. For instance, the American Public Transportation Association (APTA) reports that the average annual cost of owning and operating a vehicle is over USD9,000.
- In contrast, a study by the American Automobile Association (AAA) indicates that the average cost of using a ride-sharing service is approximately USD 1,200 per year. These figures illustrate the potential financial benefits of ride-sharing, making it an attractive alternative to vehicle ownership for many consumers. Moreover, ride-sharing services offer additional advantages, such as reducing traffic congestion and promoting environmental sustainability. By sharing rides, multiple passengers can travel together, thereby reducing the number of vehicles on the road. Furthermore, ride-sharing companies invest in electric and hybrid vehicles, contributing to a greener transportation sector. In conclusion, the ride-sharing market's evolving nature and applications across various sectors have made it a game-changer in the transportation industry.
- With substantial cost savings, reduced traffic congestion, and environmental sustainability, ride-sharing is poised to redefine the future of personal mobility.
What are the market trends shaping the Ride Sharing Industry?
- The emergence of autonomous ride-sharing represents a significant market trend in the transportation industry. Autonomous ride-sharing is set to become a prominent trend in the transportation market.
- Autonomous vehicles, utilized extensively in ride-sharing services, generate substantial data on drive patterns, traffic conditions, and road situations. This data is invaluable for testing the integrity and safety of autonomous vehicles through simulations of real-life scenarios. Since their launch in 2017, autonomous vehicles have primarily been adopted for cab and parcel delivery services. For instance, Nissan announced plans to introduce commercial autonomous taxi services in Japan by 2027.
- Similarly, ride-hailing company Waymo has been testing its autonomous vehicles for ride-sharing services since 2009. These applications provide an extensive range of driving conditions for autonomous vehicles to learn and adapt, making them a crucial sector for autonomous vehicle development.
What challenges does the Ride Sharing Industry face during its growth?
- The industry faces significant challenges from the risks of theft and the requirement for frequent maintenance, which can hinder its growth.
- The market, encompassing various modes of transportation like carpooling, bikes, and scooters, is undergoing significant transformations. A key challenge confronting this sector is the escalating issue of bike theft. Despite advanced security measures implemented by companies, the theft of shared bikes remains a persistent problem. This predicament is anticipated to hinder market expansion, as the scarcity of available bikes leads to customer dissatisfaction. Social media platforms are inundated with complaints from customers regarding a deficit in the number of bicycles relative to the app's displayed inventory.
- Moreover, improper riding practices, frequent falls, and maintenance requirements necessitated by these issues further exacerbate the situation.
Exclusive Technavio Analysis on Customer Landscape
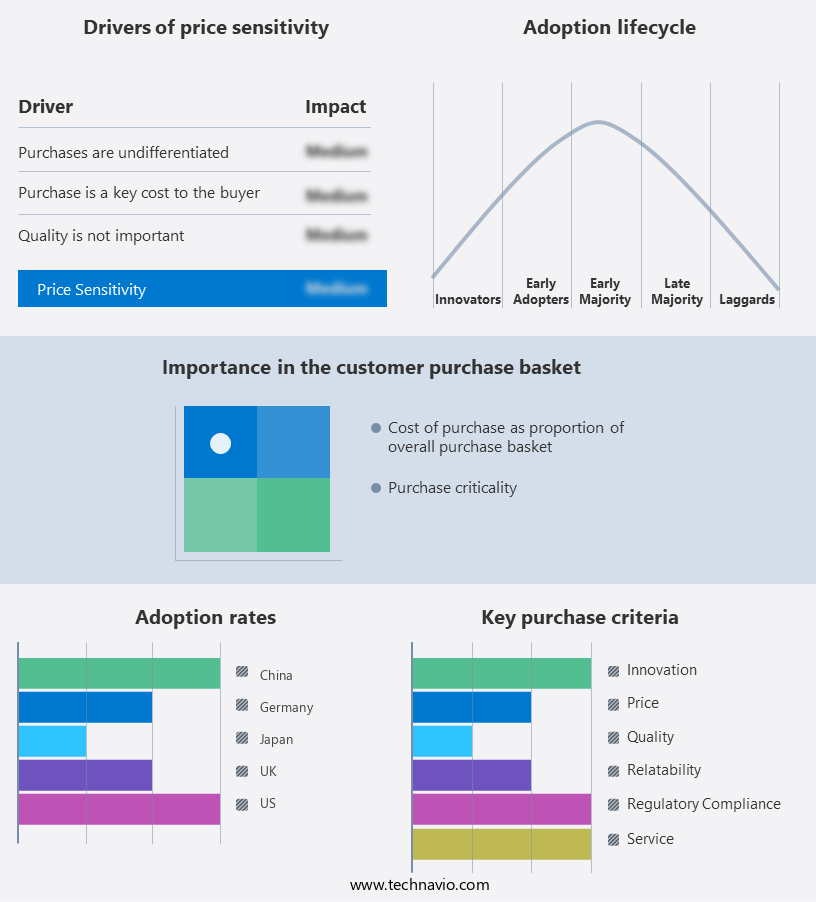
The ride sharing market forecasting report includes the adoption lifecycle of the market, covering from the innovator's stage to the laggard's stage. It focuses on adoption rates in different regions based on penetration. Furthermore, the ride sharing market report also includes key purchase criteria and drivers of price sensitivity to help companies evaluate and develop their market growth analysis strategies.
Customer Landscape of Ride Sharing Industry
Competitive Landscape
Companies are implementing various strategies, such as strategic alliances, ride sharing market forecast, partnerships, mergers and acquisitions, geographical expansion, and product/service launches, to enhance their presence in the industry.
ANI Technologies Pvt. Ltd. - This company provides ride-sharing solutions, including Ola Ride, bridging the gap between passengers and drivers through technology-driven services.
The industry research and growth report includes detailed analyses of the competitive landscape of the market and information about key companies, including:
- ANI Technologies Pvt. Ltd.
- Avis Budget Group Inc.
- Bolt Technology OU
- Cabify Espana SL
- Comuto SA
- Curb Mobility LLC
- DENSO Corp.
- Enterprise Holdings Inc.
- Grab Holdings Ltd.
- GT Gettaxi UK Ltd.
- Hertz Global Holdings Inc.
- Ibibo Group Pvt. Ltd.
- iDisha Info Labs Pvt. Ltd.
- Lyft Inc.
- My Taxi Indi
- PT GoTo Gojek Tokopedia Tbk
- Share Now GmbH
- TomTom NV
- Uber Technologies Inc.
- Via Transportation Inc.
Qualitative and quantitative analysis of companies has been conducted to help clients understand the wider business environment as well as the strengths and weaknesses of key industry players. Data is qualitatively analyzed to categorize companies as pure play, category-focused, industry-focused, and diversified; it is quantitatively analyzed to categorize companies as dominant, leading, strong, tentative, and weak.
Recent Development and News in Ride Sharing Market
- In January 2024, Uber and Lyft, two major players in the ride-sharing market, announced significant electric vehicle (EV) initiatives. Uber unveiled its plans to transition its entire U.S. Ride-hailing fleet to electric vehicles by 2030 (Uber Press Release, 2024). Lyft, on the other hand, revealed a partnership with General Motors to deploy 20,000 Bolts EVs on its platform by 2025 (Lyft Press Release, 2024).
- In March 2024, Didi Global, the Chinese ride-hailing giant, completed its merger with Didi Chuxing Technology Co., creating a unified entity valued at USD 67 billion (Reuters, 2024). This merger aimed to streamline operations and enhance competitiveness in the Chinese market.
- In May 2025, Grab, the Southeast Asian ride-hailing leader, secured a USD 2.5 billion investment from Microsoft, Toyota, and other investors, increasing its valuation to USD 40 billion (Bloomberg, 2025). This strategic partnership would enable Grab to leverage Microsoft's cloud technology and Toyota's vehicle fleet for its ride-hailing and food delivery services.
Dive into Technavio's robust research methodology, blending expert interviews, extensive data synthesis, and validated models for unparalleled Ride Sharing Market insights. See full methodology.
|
Market Scope |
|
|
Report Coverage |
Details |
|
Page number |
200 |
|
Base year |
2024 |
|
Historic period |
2019-2023 |
|
Forecast period |
2025-2029 |
|
Growth momentum & CAGR |
Accelerate at a CAGR of 18.9% |
|
Market growth 2025-2029 |
USD 132.4 billion |
|
Market structure |
Fragmented |
|
YoY growth 2024-2025(%) |
17.9 |
|
Key countries |
China, US, Germany, UK, Japan, France, India, Canada, Italy, and South Korea |
|
Competitive landscape |
Leading Companies, Market Positioning of Companies, Competitive Strategies, and Industry Risks |
Research Analyst Overview
- The market continues to evolve, with scalable infrastructure and data security measures becoming increasingly crucial for players to maintain a competitive edge. Multi-modal transportation solutions, integrated with map services and API integrations, enable seamless user experiences. Route optimization algorithms and surge pricing models allow for efficient operations and dynamic pricing, while performance monitoring tools and rider rating systems ensure high-quality service. Automated dispatch systems and driver incentive programs attract and retain drivers, and accessibility features cater to diverse user needs. Demand forecasting models and emergency response systems enhance safety and reliability. Real-time location updates and in-app communication tools keep riders informed, and data analytics dashboards provide valuable insights.
- User interface design and fare calculation methods prioritize ease and transparency. Mobile application development and geolocation services enable on-demand access, while user authentication methods and customer support systems ensure a secure and positive user experience. Fraud detection mechanisms and dynamic pricing algorithms adapt to market fluctuations, and ride scheduling features offer convenience and flexibility. GPS tracking technology and ride matching systems ensure accurate pickups and drop-offs, and payment gateway integration streamlines transactions.
What are the Key Data Covered in this Ride Sharing Market Research and Growth Report?
-
What is the expected growth of the Ride Sharing Market between 2025 and 2029?
-
USD 132.4 billion, at a CAGR of 18.9%
-
-
What segmentation does the market report cover?
-
The report is segmented by End-user (Individual and Business), Type (E-hailing, Rental, Station-based, and Car sharing), and Geography (APAC, Europe, North America, South America, and Middle East and Africa)
-
-
Which regions are analyzed in the report?
-
APAC, Europe, North America, South America, and Middle East and Africa
-
-
What are the key growth drivers and market challenges?
-
Increase in vehicle ownership cost, Risks of theft and need for frequent maintenance
-
-
Who are the major players in the Ride Sharing Market?
-
ANI Technologies Pvt. Ltd., Avis Budget Group Inc., Bolt Technology OU, Cabify Espana SL, Comuto SA, Curb Mobility LLC, DENSO Corp., Enterprise Holdings Inc., Grab Holdings Ltd., GT Gettaxi UK Ltd., Hertz Global Holdings Inc., Ibibo Group Pvt. Ltd., iDisha Info Labs Pvt. Ltd., Lyft Inc., My Taxi Indi, PT GoTo Gojek Tokopedia Tbk, Share Now GmbH, TomTom NV, Uber Technologies Inc., and Via Transportation Inc.
-
Market Research Insights
- The market continues to evolve, with fleet management software and mobile app platforms playing essential roles in optimizing operations. For instance, the implementation of geo-fencing capabilities and network optimization has led to a significant reduction in waiting time for customers, resulting in increased demand. According to industry reports, the market is projected to grow by over 20% annually, driven by advancements in digital mapping technologies and the integration of demand-supply matching systems. These innovations enable real-time demand forecasting and efficient ride allocation, enhancing the overall user experience.
- Additionally, the integration of customer support channels, service level agreements, and revenue management systems ensures reliable and consistent service delivery. The market's continuous growth is further fueled by advancements in driver communication tools, platform scalability, payment processing speed, and security features implementation. Regardless, ride-sharing regulations and ride efficiency metrics remain crucial factors influencing market dynamics.
We can help! Our analysts can customize this ride sharing market research report to meet your requirements.
 RIA -
RIA - 
