
Risk Analytics Market Size 2024-2028
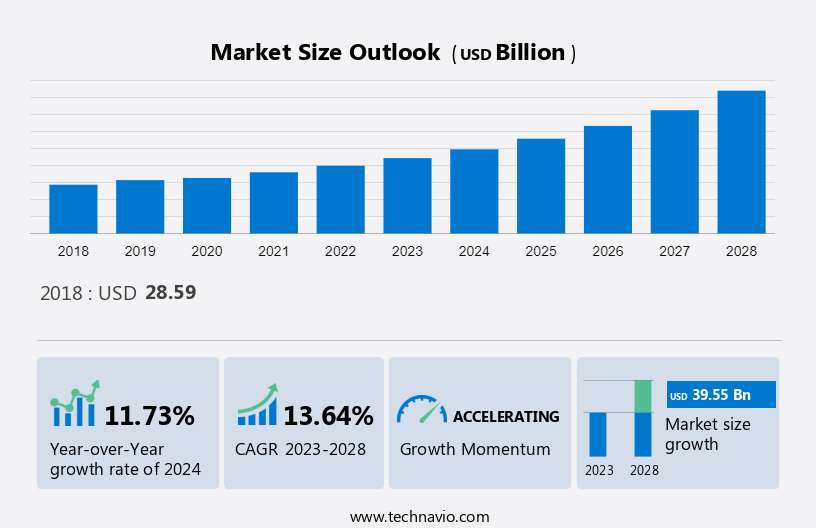
The risk analytics market size is estimated to grow by USD 39.55 billion at a CAGR of 11.73% between 2023 and 2028. Market growth is influenced by various factors, including the rising incidence of data breaches and security lapses among enterprises, the increasing need for stringent compliance with government regulations, and the growing complexities inherent in modern business processes. These challenges drive demand for robust security solutions and compliance frameworks, stimulating market expansion. Additionally, the escalating threat landscape underscores the criticality of adopting comprehensive security measures, further fueling market growth. The need to navigate intricate regulatory environments and protect sensitive data propels organizations to invest in advanced security solutions and compliance strategies, driving market dynamics. It also includes an in-depth analysis of drivers, trends, and challenges. Furthermore, the report includes historic market data from 2018 to 2022.
What will be the Size of the Market During the Forecast Period?
To learn more about this report, View Report Sample
Market Segmentation
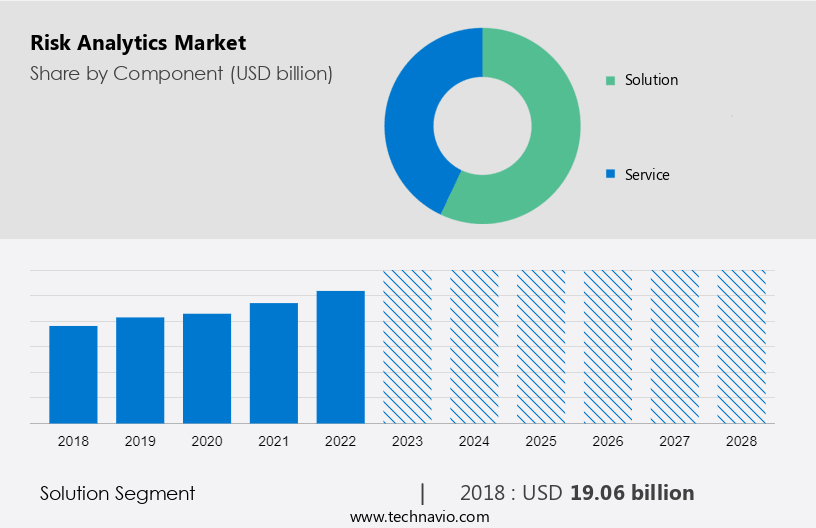
By Component
The market share growth by the solution segments is estimated to witness significant growth during the forecast period. The solution segment is a crucial component in the global risk analytics market. With the increasing demand for solutions that can help mitigate risks and improve overall organizational performance, the solution segment is expected to experience significant growth during the forecast period. This growth is fueled by advancements in technology, increasing data volumes, and the need for effective risk analysis and management.
Get a glance at the market contribution of various segments View Free PDF Sample
The solution segments showed a gradual increase in the market share of USD 19.06 billion in 2018. The ability to assist in the automation of processes that are not too difficult or complicated, and require a significant amount of time is one of the biggest advantages of using risk analytics solutions. Compliance management solutions, for instance, are considered to be a means of ensuring that an organization complies with applicable legislation. This allows the software to simplify compliance procedures, reduce errors and eliminate the need for costly and time-consuming manual processes.
By Deployment
The on-premises segment in the market refers to a solution that is installed and deployed on the organization's own server and managed by its IT department. To ensure that organizational policies and security standards are respected, this arrangement allows any part of a risk management system or data to be controlled by an organization. One of the most significant advantages offered by an on-premises segment is to be able to configure threat management systems in line with company-specific requirements, which allows for a more tailored solution.
By Region
For more insights on the market share of various regions Download PDF Sample now!
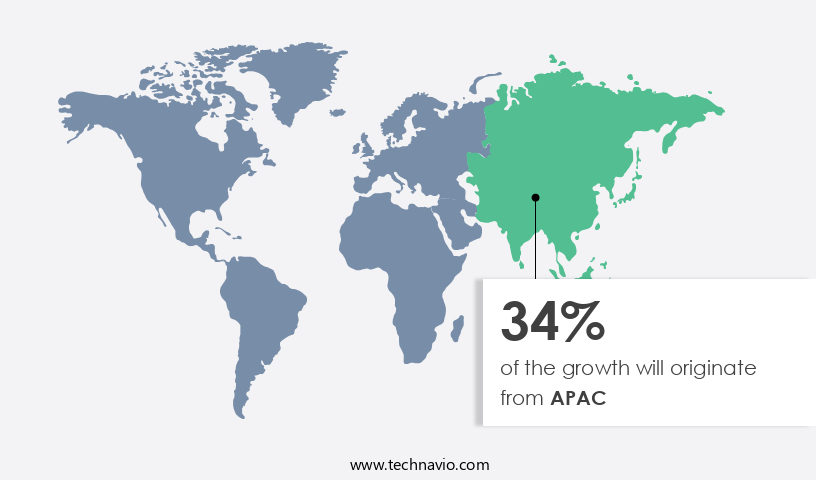
APAC is estimated to contribute 34% to the growth of the global market during the forecast period. Technavio’s analysts have elaborately explained the regional trends and drivers that shape the market during the forecast period. Yet another significant region is North America, which dominated the market in terms of revenue share. This is due to the presence of a large number of organizations belonging to the BFSI, IT, healthcare, and other industries. Organizations belonging to these end-user industries are the major buyers of these analytics solutions in this region, as it enables cash management, payments, financial instruments, accounting, banking, risk management, and hedge accounting.
Market Dynamics and Customer Landscape
The Risk Analytics Market is witnessing significant growth due to the increasing adoption of technology in risk management. Machine Learning (ML), Big Data, and Cloud computing are key technologies driving the market. ML algorithms enable real-time analysis of vast amounts of data, helping enterprises identify and mitigate risks more effectively. Cloud deployment of risk analytics software is gaining popularity due to its flexibility and cost-effectiveness. However, on-premise solutions continue to be preferred by some enterprises due to data security concerns. Risk analytics software is used to manage both physical and operational risks. Physical risks include climate change and natural disasters, while operational risks include internal factors such as human errors, systems failures, and fraud cybercrime. Cybersecurity is a major concern for enterprises, and risk analytics software plays a crucial role in mitigating cyber risks. Security data sources, such as firewalls, intrusion detection systems, and security information and event management (SIEM) systems, provide valuable data for risk analysis. Risk managers rely on risk analytics software to identify, assess, and prioritize risks, enabling them to make informed decisions and take appropriate actions to mitigate risks and protect their organizations.
Key Market Driver
The increase in data and security breaches among enterprises is driving growth in the market. As more BFSI, IT companies rely on big data analytics and cloud computing to gain a competitive edge, the threat of cyber-attacks has also increased. Financial firms can suffer not only the loss of a valued client but also their reputation and years' worth of good work as a result of data thefts, security breaches, and risks such as credit risk, market risk, strategic risk, reputational risk, environmental risk, and third-party risk impacting their business processes. Furthermore, there has been an increasing number of compliance and legal challenges faced by companies in addition to data breaches. These challenges are wide-ranging from data protection laws such as General Data Protection RegulationGDPR to industry-specific regulations, e.g. the Health Insurance Portability and Accountability ActHIPAA for healthcare organizations.
Moreover, to deal with these challenges, a growing number of BFSI, healthcare, and others are opting for risk management tools offering compliance automation capabilities that allow them to more closely track and enforce compliance effectively. Many banks use risk management platforms incorporating artificial intelligence and machine learning to detect and flag potentially suspicious transactions to comply with these regulations. These tools not only reduce the risk of non-compliance but also help banks avoid costly penalties and reputational damage. Thus, such factors are expected to drive the growth of the market during the forecast period.
Significant Market Trends
Technological innovation in risk analytics platforms is a primary trend in the market. Risk analytics solution is used to ensure the efficient management of policies and regulatory compliance and reduce exposure to cybercrime. Over the past years, there has been a surge in data leakage and internet fraud incidents reported in banks and organizations worldwide.
Further, an AI-based analysis can also be used to generate high-quality reports that can analyze more about organizations' risks, financial reporting controls, and operating environment. The adoption of AI in risk analytics solutions is emerging across the world in numerous organizations.
Major Market Restrain
The threat from open-source risk management solutions is a major challenge in the market. The availability of open-source application solutions is one of the major challenges hindering the growth of the global risk analytics market. Open-source application solutions are being developed and offered by IT organizations free of cost. The high cost of risk analytics solutions has led to an increase in the adoption of open-source applications, especially among organizations with low IT budgets. Most start-ups and SMEs, which operate with low budgets for IT and marketing expenditure, do not make investments in permanent software licenses or subscription costs.
Further, the market in which we are focusing is characterized by a wide variety of open-source risk management solutions. They're cost-effective but have limited functionality and lack advanced features. Organizations are moving toward cost-effective open-source risk management solutions, due to growing demand for risk management and the need to keep track of financial institutions' assets. Thus, the availability of open-source risk management solutions is expected to be a major challenge for the growth of the global risk analytics market during the forecast period.
Key Market Customer Landscape
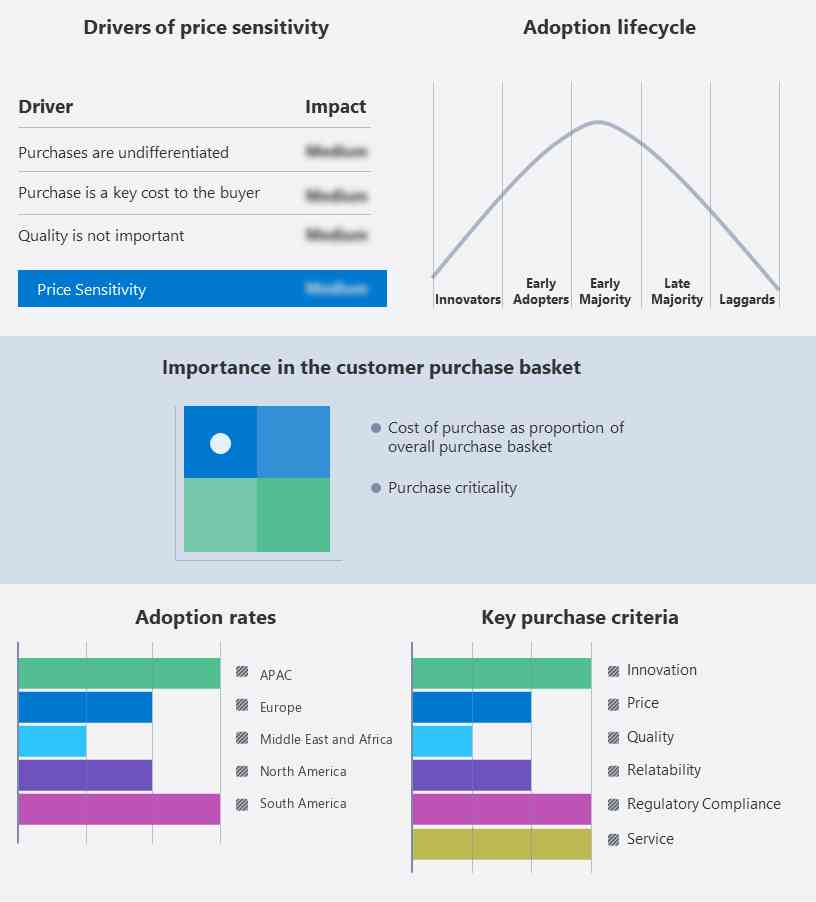
The market industry report includes the adoption lifecycle of the market, covering from the innovator’s stage to the laggard’s stage. It focuses on adoption rates in different regions based on penetration. Furthermore, the report also includes key purchase criteria and drivers of price sensitivity to help companies evaluate and develop their growth strategies.
Global Market Customer Landscape
Who are the Major Market Companies?
Companies are implementing various strategies, such as strategic alliances, partnerships, mergers and acquisitions, geographical expansion, and product/service launches, to enhance their presence in the market.
Accenture Plc - The company offers risk analytics such as Cyber risk, Operational risk and resilience, Fraud and Financial Crime, Regulatory and compliance, and financial risk.
Adenza Group Inc. - The company offers risk analytics such as risk management and regulatory compliance platforms under its brand called AIBs.
Fidelity National Information Services Inc. - The company offers risk analytics such as risk analytics with risk services under FIS Risk Management.
The research report also includes detailed analyses of the competitive landscape of the market and information about 15 market companies, including:
- Finastra
- Genpact Ltd.
- GURUCUL
- International Business Machines Corp.
- Moodys Corp.
- National Instruments Corp.
- OneSpan Inc.
- Oracle Corp.
- Provenir Group
- Recorded Future Inc.
- Risk Edge Solutions
- SAP SE
Qualitative and quantitative analysis of companies has been conducted to help clients understand the wider business environment as well as the strengths and weaknesses of key market players. Data is qualitatively analyzed to categorize companies as pure play, category-focused, industry-focused, and diversified; it is quantitatively analyzed to categorize companies as dominant, leading, strong, tentative, and weak.
Segment Overview
The market research report provides comprehensive data (region wise segment analysis), with forecasts and estimates in "USD billion" for the period 2024 to 2028, as well as historical data from 2018 to 2022 for the following segments
- Component Outlook
- Solution
- Service
- Deployment Outlook
- On-premises
- Cloud
- Region Outlook
- North America
- The U.S.
- Canada
- Europe
- The U.K.
- Germany
- France
- Rest of Europe
- APAC
- China
- India
- Middle East & Africa
- Saudi Arabia
- South Africa
- Rest of the Middle East & Africa
- South America
- Argentina
- Brazil
- Chili
- North America
You may also interested in below market reports:
- Governance Risk and Compliance (GRC) Platform Market Analysis North America, Europe, APAC, South America, Middle East and Africa - US, UK, China, Germany, India - Size and Forecast
- Risk Management Software Market Analysis North America, Europe, APAC, South America, Middle East and Africa - US, UK, Japan, Germany, Canada - Size and Forecast
- Treasury and Risk Management Software Market Analysis North America, Europe, APAC, Middle East and Africa, South America - US, Canada, China, UK, Germany - Size and Forecast
Market Analyst Overview
The arket is experiencing profound transformation with the advent of Machine Learning (ML) and real-time analysis capabilities. Integrated risk analytics platforms are crucial for assessing physical and transitional risks across various sectors including financial services, logistics firms, and mining industries. Enterprises are increasingly adopting solutions that leverage Natural Language Understanding (NLU) for intelligence-driven decisions based on structured data accumulated through accumulation platforms. Amidst challenges like coronavirus disease impacts and cyber security risks, the industry is pivoting towards operational risk management and combating new account fraud and account takeover with machine learning-based strategies. The Global Association of Risk Professionals influences technological adoption in large enterprises, advocating for predictive analytics and advanced risk analytics vendors. From clinical decisions in healthcare to safeguarding critical infrastructure, the shift from manual approaches to automated approaches in risk analytics underscores its pivotal role in modern business intelligence and digital solutions for mitigating enterprise-wide risks.
Further, a Focus on ML, Big Data, and Cloud Computing Risk management is a critical function for enterprises, particularly in the face of increasing operational risks, cyber risks, physical risks, transitional risks, and financial risks. Technology plays a pivotal role in managing these risks effectively. Machine Learning (ML), Big Data, and Cloud Computing are the key technologies driving the evolution of risk management. ML algorithms help in analyzing vast amounts of data and identifying patterns, enabling early risk detection and mitigation. Big Data, with its ability to accumulate and process large volumes of structured and unstructured data, provides valuable insights for risk assessment. Cloud computing, with its deployment models - Cloud and On-premise, offers flexibility and scalability for risk management software. Cybersecurity is a significant concern for financial institutions and enterprises. ML and Big Data are used to analyze security data sources and detect cyber risks in real-time. Cloud-based security operations centers provide intelligence-driven decisions, enabling quick response to advanced cyber threats such as account compromise, malicious insiders, and fraud cybercrime. Regulatory pressure from frameworks like PCI DSS and NIST Cybersecurity Framework necessitates robust risk management. The software revolution in risk management is shifting from rules-based approaches to advanced analytics and AI-driven systems. Climate change and internal factors like human errors and systems failures also pose risks, necessitating effective risk management strategies.
|
Industry Scope |
|
|
Report Coverage |
Details |
|
Page number |
165 |
|
Base year |
2023 |
|
Historic period |
2018 - 2022 |
|
Forecast period |
2024-2028 |
|
Growth momentum & CAGR |
Accelerate at a CAGR of 13.64% |
|
Market growth 2024-2028 |
USD 39.55 billion |
|
Market structure |
Fragmented |
|
YoY growth 2023-2024(%) |
11.73 |
|
Regional analysis |
North America, Europe, APAC, South America, and Middle East and Africa |
|
Performing market contribution |
APAC at 34% |
|
Key countries |
US, China, Germany, Canada, and UK |
|
Competitive landscape |
Leading Companies, Market Positioning of Companies, Competitive Strategies, and Industry Risks |
|
Key companies profiled |
Accenture Plc, Adenza Group Inc., CoreLogic Inc., Fidelity National Information Services Inc., Finastra, Genpact Ltd., GURUCUL, International Business Machines Corp., Intrado Life and Safety Inc., Moodys Corp., National Instruments Corp., OneSpan Inc., Oracle Corp., Provenir Group, Recorded Future Inc., Risk Edge Solutions, SAP SE, SAS Institute Inc., Tata Consultancy Services Ltd., and Verisk Analytics Inc. |
|
Market dynamics |
Parent market analysis, Market growth inducers and obstacles, Fast-growing and slow-growing segment analysis, Market growth and Forecasting, COVID 19 impact and recovery analysis and future consumer dynamics, Market condition analysis for forecast period |
|
Customization purview |
If our report has not included the data that you are looking for, you can reach out to our analysts and get segments customized. |
What are the Key Data Covered in this Market Research Report?
- CAGR of the market during the forecast period
- Detailed information on factors that will drive the market growth and forecasting of the market between 2023 and 2027
- Precise estimation of the market size and its contribution to the parent market
- Accurate predictions about upcoming market trends and analysis and changes in consumer behavior
- Growth of the market across Europe, North America, APAC, South America, and Middle East and Africa
- Thorough market growth analysis of the market’s competitive landscape and detailed information about companies
- Comprehensive market analysis and report on the factors that will challenge the market research and growth of market companies
We can help! Our analysts can customize this market research report to meet your requirements.
 RIA -
RIA - 
