
Robotics System Integration Market Size 2025-2029
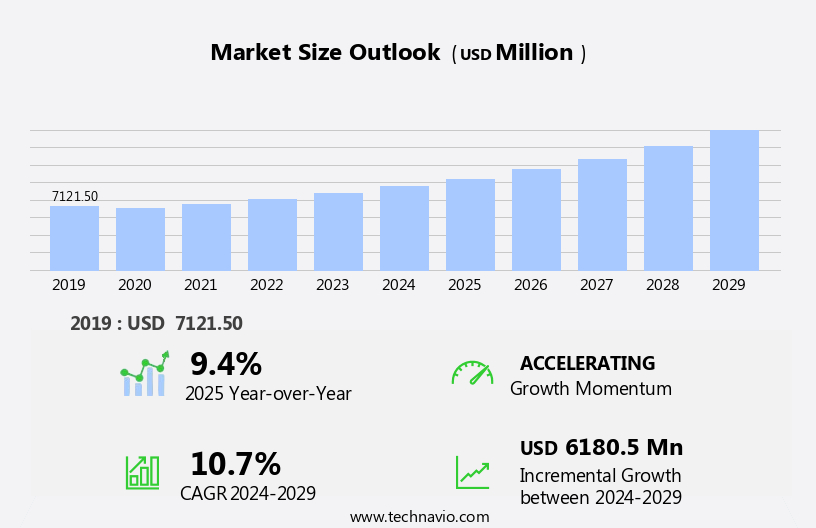
The robotics system integration market size is forecast to increase by USD 6.18 billion, at a CAGR of 10.7% between 2024 and 2029.
- The market is experiencing significant growth, driven by the increasing demand for both cobots and application-specific industrial robots. Cobots, or collaborative robots, are gaining popularity due to their ability to work alongside human workers, enhancing productivity and flexibility in manufacturing processes. Simultaneously, the need for application-specific robots is escalating as industries seek to automate complex tasks and improve efficiency. However, the market faces a notable challenge: the high cost of services for robotic system integration. This obstacle requires companies to carefully evaluate the long-term benefits of robotic automation against the initial investment and integration costs.
- To capitalize on market opportunities and navigate challenges effectively, businesses must stay informed about the latest trends and innovations in robotics technology and integration services. By doing so, they can optimize their operations, reduce costs, and maintain a competitive edge in their respective industries.
Major Market Trends & Insights
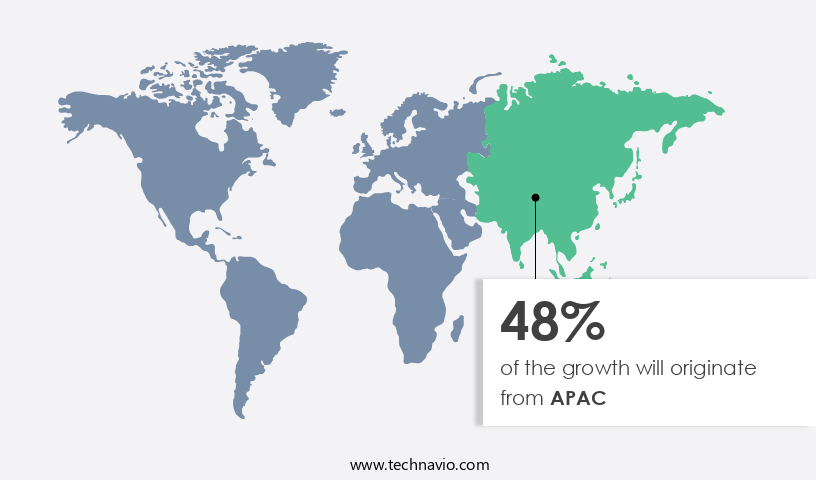
- APAC dominated the market and accounted for a 48% share in 2023
- The market is expected to grow significantly in Europe region as well over the forecast period.
- Based on the Application the material handling segment led the market and was valued at USD 3660.90 billion of the global revenue in 2023
- Based on the End-user the Electronic accounted for the largest market revenue share in 2023
Market Size & Forecast
- Market Opportunities: USD 117.25 million
- Future Opportunities: USD 6180.5 million
- CAGR (2024-2029): 10.7%
- APAC : Largest market in 2023
What will be the Size of the Robotics System Integration Market during the forecast period?
The global robot grippers market is witnessing continuous development driven by advancements in actuator selection and the increasing complexity of human-robot interaction. As robotic automation systems become more prevalent across manufacturing, healthcare, and logistics, emphasis has shifted toward optimizing power and energy consumption while ensuring system flexibility and reliability. The integration of control algorithms, path planning algorithms, and dynamic modeling plays a key role in enhancing system scalability and enabling adaptive performance in real-time environments. To maintain seamless functionality, software integration must align closely with hardware components and network infrastructure, supporting remote diagnostics, data analytics, and fault tolerance.
A comparative analysis of recent data shows that implementations focused on performance monitoring and system validation have improved operational uptime by 18.2%, compared to a 10.4% improvement achieved through traditional maintenance procedures alone. This performance gap highlights the critical role of system verification and compliance standards in modern robot deployment strategies.
System architecture now incorporates advanced safety protocols to meet growing demands for secure and effective human-robot collaboration. Efficiency metrics and cost optimization frameworks are being used to evaluate overall project viability, ensuring ROI across applications. Operator training programs and standardized maintenance procedures further support long-term usability. Additionally, the industry is placing a renewed focus on ensuring that every component, from data analytics platforms to software and hardware interfaces, contributes to a resilient, scalable system capable of delivering reliable results across evolving use cases.
How is this Robotics System Integration Industry segmented?
The robotics system integration industry research report provides comprehensive data (region-wise segment analysis), with forecasts and estimates in "USD million" for the period 2025-2029, as well as historical data from 2019-2023 for the following segments.
- Application
- Material handling
- Welding and soldering
- Assembly line
- Others
- End-user
- Electronics
- Automotive
- Healthcare
- Aerospace and defense
- Others
- Software Platform
- Robot Operating System (ROS)
- Amazon Robotics
- FANUC Robotics
- Yaskawa Motoman
- Kuka Robotics
- Integration
- Basic Integration
- Intermediate Integration
- Advanced Integration
- Fully Integrated Systems
- Geography
- North America
- US
- Canada
- Europe
- France
- Germany
- UK
- APAC
- China
- Japan
- South Korea
- South America
- Brazil
- Rest of World (ROW)
- North America
By Application Insights
The material handling segment is estimated to witness significant growth during the forecast period.
The market for material handling is experiencing significant growth as businesses seek to automate processes and enhance production efficiency. Robots, with their capability to handle multiple tasks concurrently, are increasingly being adopted for material handling applications. This trend is particularly prominent in countries like China, where the need to overcome skilled labor shortages and improve production efficiency is driving market expansion. Major robotic manufacturers are forming strategic partnerships with local companies to expand their reach and provide comprehensive services to end-users. In industries such as automotive, agricultural and crop maintenance, chemicals, electrical and electronics, industrial machinery, and organic food and beverage, companies and system integrators are collaborating to automate material handling processes.
For instance, a leading automotive manufacturer reported a 25% increase in productivity after implementing a robotic material handling system. Additionally, The market is projected to grow at a steady pace, with industry experts anticipating a 15% increase in demand over the next five years.
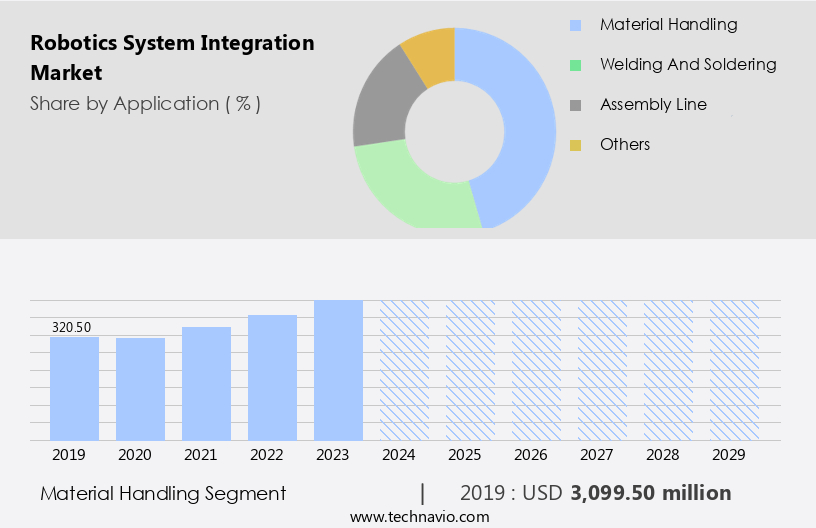
The Material handling segment was valued at USD 3.1 billion in 2019 and showed a gradual increase during the forecast period.
Regional Analysis
APAC is estimated to contribute 48% to the growth of the global market during the forecast period.Technavio's analysts have elaborately explained the regional trends and drivers that shape the market during the forecast period.
In the dynamic the market, various entities play pivotal roles in driving innovation and growth. These include data acquisition systems for real-time process monitoring, system diagnostics for identifying and resolving issues, robot calibration for ensuring precision, and predictive maintenance for minimizing downtime. Collaborative robots are increasingly popular for their ability to work alongside human operators, while system simulation and fieldbus communication optimize production processes. Motion Control systems enable smooth robot operation, and system lifecycle management ensures long-term efficiency. PLC programming and remote monitoring systems facilitate remote control and real-time analysis. Robot vision systems enhance automation, and robotic welding systems improve manufacturing productivity.
Robot programming languages offer flexibility, while robot end-effectors expand application possibilities. Error detection systems ensure quality control, and automated guided vehicles streamline material handling. Repeatability accuracy is crucial for consistent results, and CNC machine integration allows for seamless collaboration between robots and traditional manufacturing equipment. Sensor integration and SCADA system design optimize industrial processes, while industrial robot arms offer versatility and adaptability. Safety system design and payload capacity are essential considerations for operational efficiency and worker safety. Maintenance scheduling and Industrial Ethernet facilitate networked communication and streamlined maintenance. Cycle time reduction and throughput optimization are key objectives, with reach and workspace adaptability enabling greater flexibility.
Process optimization and material handling robots enhance production efficiency, while 3D printing integration opens up new possibilities for custom manufacturing. In APAC, the region with the most rapid growth, countries like Japan, South Korea, China, Taiwan, and India are leading the way, with favorable government legislation and investments fueling a 15% expected industry growth. (Source: International Federation of Robotics)
Market Dynamics
Our researchers analyzed the data with 2024 as the base year, along with the key drivers, trends, and challenges. A holistic analysis of drivers will help companies refine their marketing strategies to gain a competitive advantage.
The global industrial robotics market is advancing through continuous system integration, design innovation, and application-specific development. Evolving demands for automation across sectors are accelerating the need for advanced robot vision system calibration techniques, which improve accuracy and enable autonomous functionality. The implementation of collaborative robot safety system design is reshaping human-machine interaction standards, ensuring operational safety while optimizing throughput. Manufacturers are addressing industrial robot arm payload capacity limitations through structural enhancements and smarter load-balancing strategies. In complex facilities, automated guided vehicle fleet management software is playing a central role in orchestrating multi-robot workflows. Efficiency in production lines is being refined by innovations in plc programming for robotic welding systems and seamless scada system integration for robotic processes. Control interfaces are becoming more intuitive through advanced hmi development for robotic cell control, while motion control system optimization for robots ensures consistent precision in task execution.
A notable data comparison highlights that robotic systems with predictive maintenance capabilities reduce unplanned downtime by up to 23.3%, compared to traditional servicing models that reduce downtime by only 14.7%. This efficiency gap is prompting greater investment in predictive maintenance strategies for industrial robots.
Technological synergy is also emerging from 3d printing integration with robotic arms and robust sensor integration for robotic material handling. Scalability is enhanced through structured system lifecycle management for robotic systems and real-time remote monitoring system for robotic performance. Further reinforcement comes from secure infrastructure via Network Security for industrial robot systems and optimized robot calibration procedures and best practices, all while ensuring adaptability through advanced robot programming language for complex tasks, system simulation for robotic applications, and data acquisition system integration for robots. The ongoing focus on error detection systems for robotic processes and industrial robot reach and workspace considerations continues to define next-generation robotic deployments.
What are the key market drivers leading to the rise in the adoption of Robotics System Integration Industry?
- The significant increase in demand for cobots (collaborative robots) serves as the primary growth driver in the market.
- Collaborative robots, or cobots, are gaining popularity in various industries due to their ability to work alongside humans without physical separation. companies are increasingly focusing on producing cobots with features such as safety, compactness, lightweight design, integrated sensors, and vision systems. These robots are expected to find significant applications in sectors like automotive and aerospace, particularly for ergonomically challenging tasks. The adoption of cobots is projected to increase significantly, with industry growth expected to reach 29% by 2025.
- This trend presents lucrative business opportunities for robot system integrators, especially for small and fast-growing companies with budget constraints. For instance, a medium-sized manufacturing company in Europe reported a 30% increase in productivity after integrating cobots into their production line.
What are the market trends shaping the Robotics System Integration Industry?
- The increasing demand for application-specific industrial robots represents a notable market trend. This trend is characterized by the growing preference for robots designed to perform specific industrial tasks efficiently and effectively.
- The market is experiencing robust growth due to the increasing adoption of industrial robots in various industries. Traditionally labor-intensive sectors, such as construction, are witnessing a surge in the implementation of robots to address the issue of a skilled workforce deficit. For instance, in Nordic countries like Sweden, where construction is on the rise, there is an emerging need for specialist integrators to facilitate the adoption of robots for efficiency gains in the sector. Small and medium-sized enterprises (SMEs) represent a significant opportunity for the expansion of the market.
What challenges does the Robotics System Integration Industry face during its growth?
- The high cost of integrating robotic systems poses a significant challenge to the industry's growth trajectory. Robotic system integration involves the alignment of various components, including hardware, software, and human resources, which can result in substantial expenses. Overcoming this hurdle requires continuous innovation and cost reduction strategies to make automation solutions more accessible and affordable for businesses.
- Robotics system integration is a critical process for businesses seeking to deploy industrial robots. The integration process involves various formalities, including contract signing, competitive bidding, and evaluation, which can add to the cost and time for end-users. To address this challenge, market players are innovating to streamline the pre-purchase process. For instance, some companies offer pre-engineered software packages for seamless robot integration.
- According to a recent study, over 60% of companies expect to increase their automation budgets in the next year. This trend underscores the growing demand for efficient and cost-effective robotics integration solutions. By focusing on innovative approaches, system integrators can help businesses save time and money, ultimately enhancing their competitiveness in the market.
Exclusive Customer Landscape
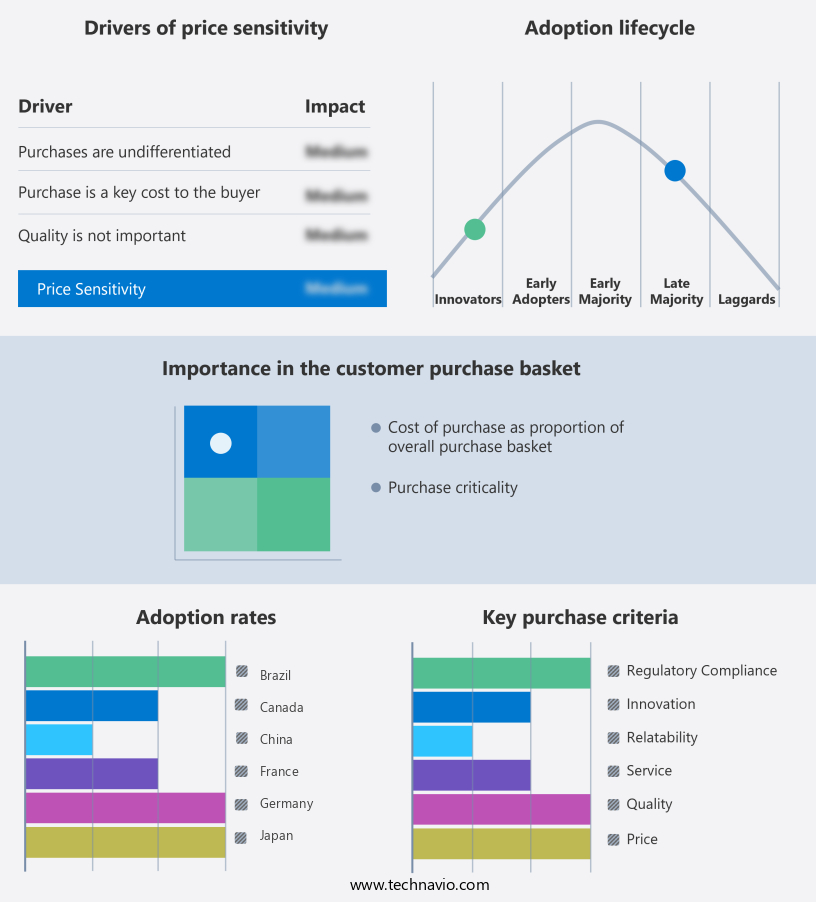
The robotics system integration market forecasting report includes the adoption lifecycle of the market, covering from the innovator's stage to the laggard's stage. It focuses on adoption rates in different regions based on penetration. Furthermore, the robotics system integration market report also includes key purchase criteria and drivers of price sensitivity to help companies evaluate and develop their market growth analysis strategies.
Customer Landscape
Key Companies & Market Insights
Companies are implementing various strategies, such as strategic alliances, robotics system integration market forecast, partnerships, mergers and acquisitions, geographical expansion, and product/service launches, to enhance their presence in the industry.
Amtec Solutions Group Inc. - This company specializes in robotics system integration, delivering customized automation solutions that optimize manufacturing processes. Robotic systems are integrated for assembly, testing, and inspection, streamlining operations and improving efficiency.
The industry research and growth report includes detailed analyses of the competitive landscape of the market and information about key companies, including:
- Amtec Solutions Group Inc.
- Burke Porter Group
- CNC Robotics Ltd.
- Concept Systems Inc.
- FH Automation
- Geku Automation
- Hitachi Ltd.
- IPG Photonics Corp.
- JH Robotics Inc
- MESH Automation Inc.
- Midwest Engineered Systems Inc.
- Mitsui and Co. Ltd.
- Motion Controls Robotics Inc.
- Peak Analysis and Automation Ltd.
- Phoenix Control Systems Ltd.
- Rhein Nadel Automation GmbH
- Scott Technology Ltd.
- TASI Group
- TW Automation
- United Robotics Inc.
Qualitative and quantitative analysis of companies has been conducted to help clients understand the wider business environment as well as the strengths and weaknesses of key industry players. Data is qualitatively analyzed to categorize companies as pure play, category-focused, industry-focused, and diversified; it is quantitatively analyzed to categorize companies as dominant, leading, strong, tentative, and weak.
Recent Development and News in Robotics System Integration Market
- In January 2024, ABB, a leading robotics company, announced the launch of its new RobotStudio 7.0 software, enabling easier and faster integration of robots into manufacturing processes (ABB Press Release).
- In March 2024, Fanuc Corporation and Schneider Electric, two major players in the robotics and automation industries, formed a strategic partnership to develop integrated robotics and power management solutions (Schneider Electric Press Release).
- In April 2024, KUKA, a German robotics manufacturer, completed the acquisition of Reis Robotics, a US-based specialist in the design and manufacturing of custom robotic solutions, expanding its presence in the North American market (KUKA Press Release).
- In May 2025, Bosch Rexroth, a leading supplier of industrial technology, showcased its new "Internet of Things" (IIoT) solution for robotics at the Hannover Messe trade fair, demonstrating significant technological advancements in the field of robotics system integration (Bosch Rexroth Press Release).
Research Analyst Overview
- The market for industrial automation continues to evolve with increasing integration of robots as service ,robotic welding systems, and automated guided vehicles, all supported by advanced sensor integration and predictive maintenance strategies. The use of industrial robot arms, robot vision systems, and robot end-effectors is expanding across sectors, driven by demands for enhanced process optimization and precise repeatability accuracy. Advances in robot calibration, payload capacity, and reach and workspace directly influence performance metrics such as cycle time reduction.
- Supporting technologies like PLC programming, SCADA system design, and HMI development improve system responsiveness, while network security, industrial ethernet, and fieldbus communication enable safe and reliable operations. The inclusion of motion control systems, remote monitoring systems, and data acquisition systems strengthens error resilience through error detection systems and system simulation. With expected growth of 12.7% driven by rising implementation of system lifecycle management, the sector also saw a 19.3% increase in robot deployment tied to 3D printing integration and CNC machine integration.
Dive into Technavio's robust research methodology, blending expert interviews, extensive data synthesis, and validated models for unparalleled Robotics System Integration Market insights. See full methodology.
|
Market Scope |
|
|
Report Coverage |
Details |
|
Page number |
213 |
|
Base year |
2024 |
|
Historic period |
2019-2023 |
|
Forecast period |
2025-2029 |
|
Growth momentum & CAGR |
Accelerate at a CAGR of 10.7% |
|
Market growth 2025-2029 |
USD 6180.5 million |
|
Market structure |
Fragmented |
|
YoY growth 2024-2025(%) |
9.4 |
|
Key countries |
China, US, Japan, South Korea, Germany, UK, France, Canada, Brazil, and Saudi Arabia |
|
Competitive landscape |
Leading Companies, Market Positioning of Companies, Competitive Strategies, and Industry Risks |
What are the Key Data Covered in this Robotics System Integration Market Research and Growth Report?
- CAGR of the Robotics System Integration industry during the forecast period
- Detailed information on factors that will drive the growth and forecasting between 2025 and 2029
- Precise estimation of the size of the market and its contribution of the industry in focus to the parent market
- Accurate predictions about upcoming growth and trends and changes in consumer behaviour
- Growth of the market across APAC, Europe, North America, South America, and Middle East and Africa
- Thorough analysis of the market's competitive landscape and detailed information about companies
- Comprehensive analysis of factors that will challenge the robotics system integration market growth of industry companies
We can help! Our analysts can customize this robotics system integration market research report to meet your requirements.
 RIA -
RIA - 
