Rotavator Market Analysis, Size, and Forecast 2026-2030: APAC (China, Japan, and India), North America (US, Canada, and Mexico), Europe (Germany, France, and UK), South America (Brazil and Argentina), Middle East and Africa (South Africa, Saudi Arabia, and UAE), and Rest of World (ROW)

Rotavator Market Analysis, Size, and Forecast 2026-2030:
APAC (China, Japan, and India), North America (US, Canada, and Mexico), Europe (Germany, France, and UK), South America (Brazil and Argentina), Middle East and Africa (South Africa, Saudi Arabia, and UAE), and Rest of World (ROW)

Published: Dec 2025 293 Pages SKU: IRTNTR74215

Market Overview at a Glance

$491.4 Mn
Market Opportunity
4.5%
CAGR 2025 - 2030
55.5%
APAC Growth
$1.04 B
Hydraulic segment 2024

Rotavator Market Size 2026-2030

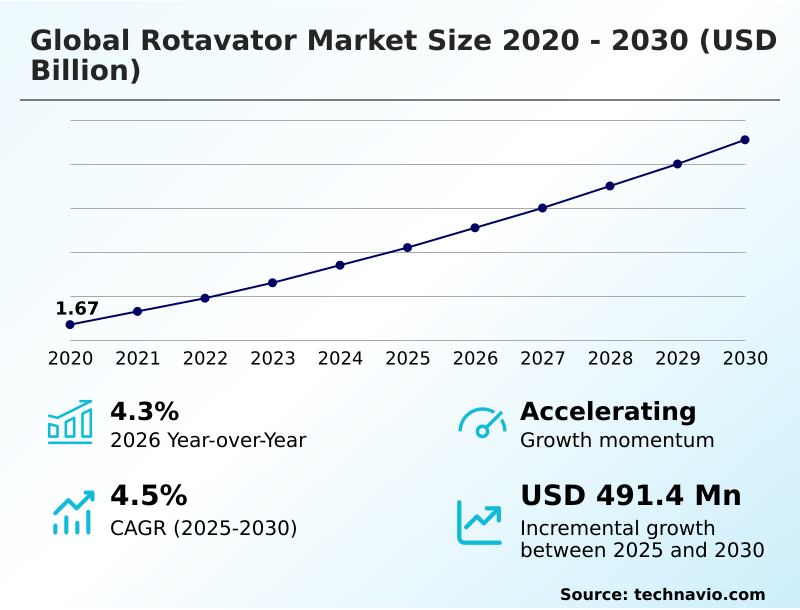
The rotavator market size is valued to increase by USD 491.4 million, at a CAGR of 4.5% from 2025 to 2030. Growing need for nutrient protection in agriculture fields will drive the rotavator market.

Major Market Trends & Insights

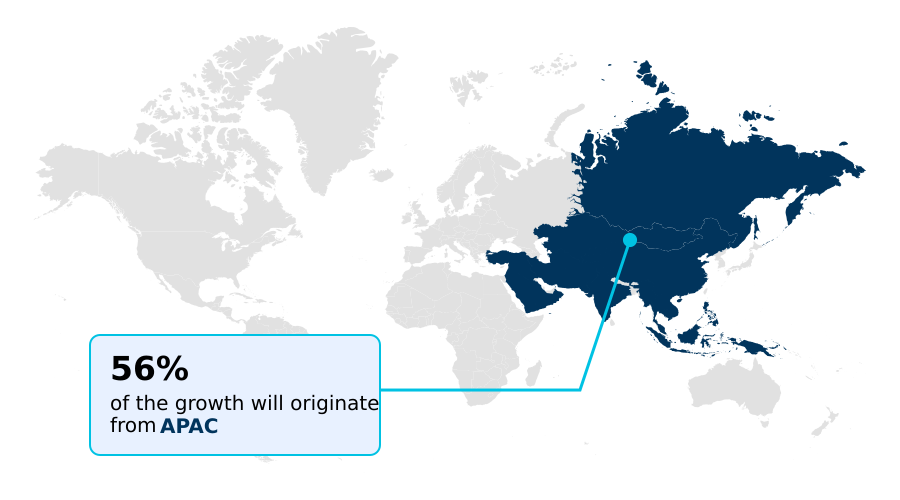
  • APAC dominated the market and accounted for a 55.5% growth during the forecast period.
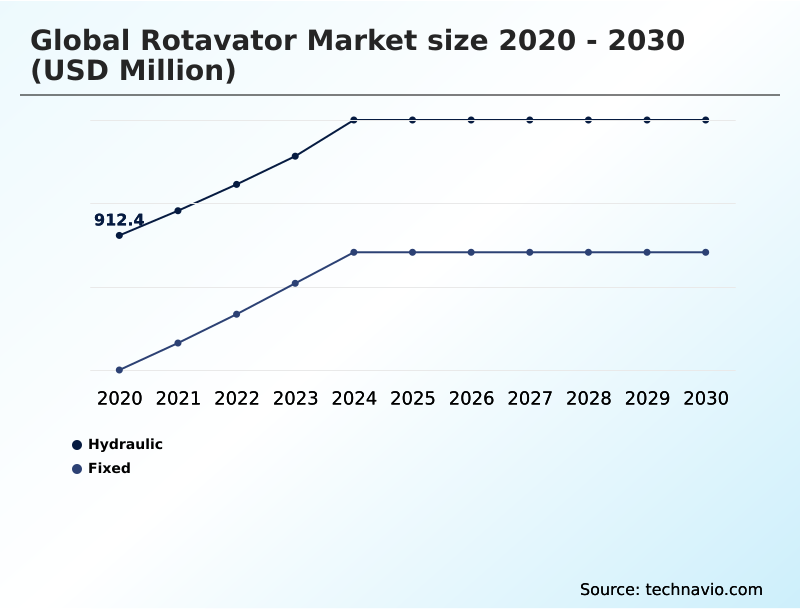
  • By Product - Hydraulic segment was valued at USD 1.04 billion in 2024
  • By Type - L type segment accounted for the largest market revenue share in 2024

Market Size & Forecast

  • Market Opportunities: USD 838.7 million
  • Market Future Opportunities: USD 491.4 million
  • CAGR from 2025 to 2030 : 4.5%

Market Summary

  • The rotavator market is fundamentally shaped by the global shift toward intensive farm mechanization and operational efficiency. As a tractor-mounted implement, the rotary tiller is critical for modern seedbed preparation, offering a single-pass tillage solution that significantly reduces time and fuel consumption compared to traditional methods.
  • Key drivers include the need for effective crop residue incorporation and improved soil conditioning, which are vital for sustainable agriculture. The market is also seeing a trend toward automated features, such as automated depth adjustment and multi-speed gearbox options, which enhance precision and ease of use.
  • For instance, a farming cooperative can leverage rotavators to shorten the turnaround time between harvesting one crop and sowing the next, effectively enabling an additional cropping cycle and boosting annual profitability. This is achieved by optimizing soil pulverization and aeration via the power take-off (PTO).
  • However, the market faces challenges from the availability of alternative secondary tillage equipment and the high initial investment cost, which can be a barrier for smaller farming operations.

What will be the Size of the Rotavator Market during the forecast period?

Get Key Insights on Market Forecast (PDF) Request Free Sample

How is the Rotavator Market Segmented?

The rotavator industry research report provides comprehensive data (region-wise segment analysis), with forecasts and estimates in "USD million" for the period 2026-2030, as well as historical data from 2020-2024 for the following segments.

  • Product
    • Hydraulic
    • Fixed
  • Type
    • L type
    • C type
  • Application
    • Seedbed preparation
    • Soil conditioning
    • Crop residue management
    • Horticulture
    • Others
  • Geography
    • APAC
      • China
      • Japan
      • India
    • North America
      • US
      • Canada
      • Mexico
    • Europe
      • Germany
      • France
      • UK
    • South America
      • Brazil
      • Argentina
    • Middle East and Africa
      • South Africa
      • Saudi Arabia
      • UAE
    • Rest of World (ROW)

By Product Insights

The hydraulic segment is estimated to witness significant growth during the forecast period.

The hydraulic segment is integral to the rotavator market, addressing the demands of precision agriculture.

This technology, featuring a hydraulic offset, allows the tractor-mounted implement to perform inter-row cultivation with high accuracy, which is essential for vineyard cultivation and orchard floor management.

The design incorporates a side-shift mechanism for effective tillage depth control in hard-to-reach areas, reducing the need for manual labor. This capability not only supports sustainable farming by minimizing chemical use but also boosts productivity.

Adopting this tractor-implement system has been shown to enhance operational uptime by over 15% by preventing crop and equipment damage. The focus on specialized horticulture tillage makes this segment a key area of innovation and market value.

Request Free Sample

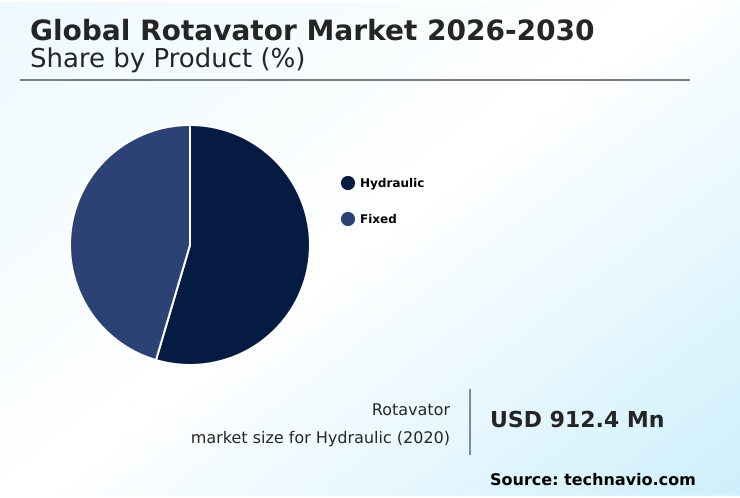
The Hydraulic segment was valued at USD 1.04 billion in 2024 and showed a gradual increase during the forecast period.

Request Free Sample

Regional Analysis

APAC is estimated to contribute 55.5% to the growth of the global market during the forecast period.Technavio’s analysts have elaborately explained the regional trends and drivers that shape the market during the forecast period.

See How Rotavator Market Demand is Rising in APAC Request Free Sample

The geographic landscape of the rotavator market is led by the APAC region, which accounts for over 55% of the incremental growth.

This dominance is fueled by government-backed farm mechanization initiatives in agricultural powerhouses like India and China, where the technology is essential for both wetland cultivation and dry-land farming.

In contrast, the North America market, contributing approximately 19% of growth, is characterized by demand for specialized implements used in high-value sectors such as vineyard cultivation and horticulture tillage.

The adoption of tractor-mounted implements is accelerating globally, driven by the need for efficient puddling operations and soil aeration.

Differences in tractor compatibility and regional soil types influence the demand for specific blade configurations and implement sizes across these key markets.

Market Dynamics

Our researchers analyzed the data with 2025 as the base year, along with the key drivers, trends, and challenges. A holistic analysis of drivers will help companies refine their marketing strategies to gain a competitive advantage.

  • Optimizing agricultural productivity hinges on selecting the right equipment, making the choice between a hydraulic offset rotavator for vineyards and a heavy-duty rotavator for sugarcane residue a critical operational decision. The debate over L-type vs C-type rotavator blades is central to performance, directly influencing rotavator maintenance for blade longevity and the overall impact of rotavator on soil health.
  • Modern implements offer cost-saving features in modern rotavators, with automated depth control in rotary tillers ensuring precise single pass tillage with rotavator. This automation can improve crop emergence uniformity by more than 10% compared to manually operated systems. When evaluating rotavator vs power tiller efficiency, factors such as fuel consumption and time savings become paramount.
  • Furthermore, choosing rotavator for tractor horsepower ensures the entire system operates at peak efficiency. These implements are also increasingly used for mechanical weed control in organic farming. In specialized applications like rotavator for wetland paddy cultivation and general rotavator application in horticulture, the correct implement configuration is key to maximizing yield and adhering to certified rotavator safety standards.

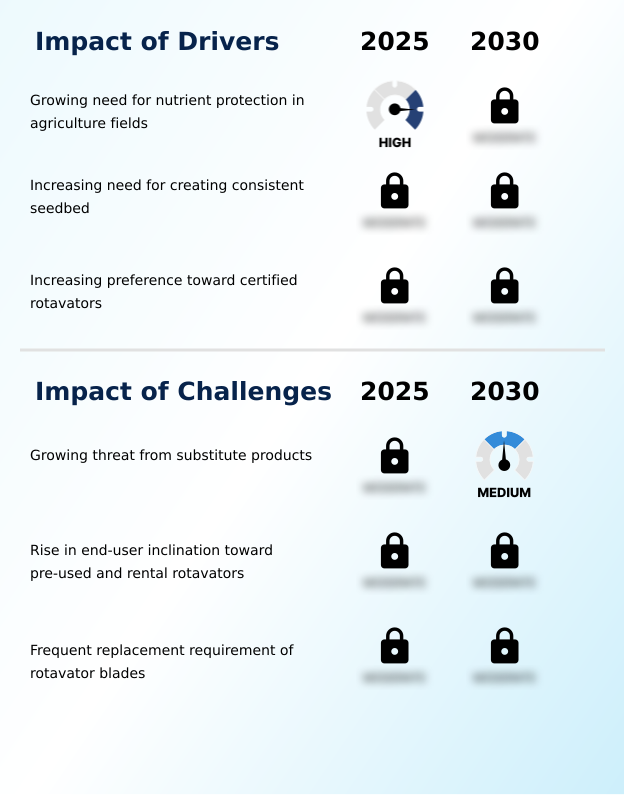
What are the key market drivers leading to the rise in the adoption of Rotavator Industry?

  • The increasing requirement for effective nutrient protection in agricultural fields to improve soil health and crop productivity is a primary driver for market growth.

  • A primary market driver is the intensified focus on nutrient management and sustainable soil health.
  • Rotavators enable effective crop residue incorporation and nutrient mixing, practices that improve soil conditioning and can increase nutrient availability by up to 20% compared to some zero-tillage alternatives.
  • The consistent demand for high-quality seedbed preparation for both wetland cultivation and dry-land farming continues to fuel adoption.
  • Concurrently, the increasing preference for implements with certified safety guards and an ISO-certified design is a significant driver, enhancing operator confidence and reducing operational risk.
  • Efficient puddling operations in rice farming, facilitated by optimized rotary tiller blades powered by the power take-off (PTO), directly support the overarching goal of boosting agricultural productivity through better soil aeration and stubble management.

What are the market trends shaping the Rotavator Industry?

  • The increasing global emphasis on agricultural mechanization is a significant trend, driving the adoption of efficient farm implements to enhance productivity and operational speed.

  • Key market trends revolve around the integration of automation and cost-saving features into modern agricultural implements. The influx of automated depth adjustment and side-shift mechanism technologies is enhancing precision, particularly in horticulture tillage and orchard floor management. This level of farm mechanization improves fuel consumption efficiency by approximately 10-15% by optimizing the tractor horsepower requirement.
  • Another significant trend is the focus on implement durability, with advanced wear-resistant blades and robust gearboxes extending the operational life of a tractor-implement system by up to 25%. This reduces long-term maintenance costs and minimizes operational time reduction.
  • Ensuring tractor compatibility remains a priority for manufacturers, as seamless integration is crucial for maximizing the benefits of these advanced primary tillage tools and improving overall soil tilth.

What challenges does the Rotavator Industry face during its growth?

  • The growing availability of and threat from substitute tillage products presents a significant challenge to the market's growth trajectory.

  • A significant market challenge is the rising threat from substitute products, such as vertical tillage machines, which are often promoted as superior conservation tillage methods that prevent hard pan formation and can reduce surface compaction by 15% under certain conditions.
  • Another headwind is the growing end-user preference for rental or pre-owned equipment, a trend that can suppress new unit sales by 10-20% in some regions by altering considerations around initial investment versus long-term maintenance costs.
  • The recurring expense associated with the frequent replacement of rotary tiller blades, a necessary part of secondary tillage and topsoil manipulation, remains a barrier for many small-scale farmers. This issue influences purchasing decisions regarding the durability of components like the heavy-duty gearcase and the choice between L-type blades and C-type blades on any new agricultural implement.

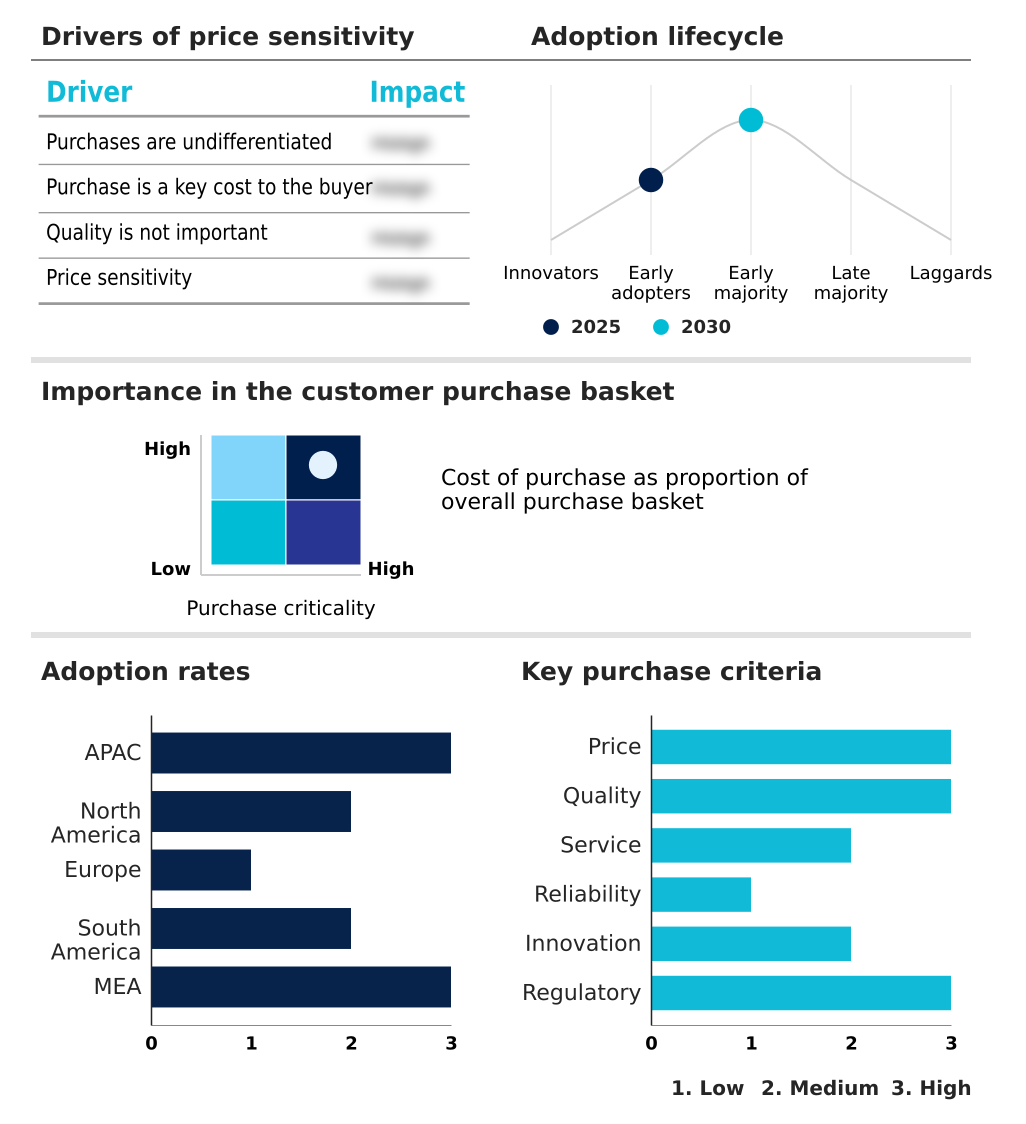
Exclusive Technavio Analysis on Customer Landscape

The rotavator market forecasting report includes the adoption lifecycle of the market, covering from the innovator’s stage to the laggard’s stage. It focuses on adoption rates in different regions based on penetration. Furthermore, the rotavator market report also includes key purchase criteria and drivers of price sensitivity to help companies evaluate and develop their market growth analysis strategies.

Customer Landscape of Rotavator Industry

Competitive Landscape

Companies are implementing various strategies, such as strategic alliances, rotavator market forecast, partnerships, mergers and acquisitions, geographical expansion, and product/service launches, to enhance their presence in the industry.

Action Construction Equipment Ltd. - A key portfolio includes advanced agricultural implements, featuring rotavators with hydraulic and multi-speed capabilities designed for enhanced operational efficiency in modern farming.

The industry research and growth report includes detailed analyses of the competitive landscape of the market and information about key companies, including:

  • Action Construction Equipment Ltd.
  • AGCO Corp.
  • Beri Udyog Pvt. Ltd.
  • CLAAS KGaA
  • CNH Industrial NV
  • Deere and Co.
  • Greaves Cotton Ltd.
  • Kubota Corp.
  • KUHN SAS
  • Landforce
  • Mahindra and Mahindra Ltd.
  • Maschio Gaspardo S.p.A.
  • Piara Singh and Sons
  • Preet Agro Industries Pvt. Ltd.
  • Sonalika International Tractors Ltd.
  • Tirth Agro Technology Pvt. Ltd.
  • Tractors and Farm Equipment Ltd.
  • Yanmar Holdings Co. Ltd.

Qualitative and quantitative analysis of companies has been conducted to help clients understand the wider business environment as well as the strengths and weaknesses of key industry players. Data is qualitatively analyzed to categorize companies as pure play, category-focused, industry-focused, and diversified; it is quantitatively analyzed to categorize companies as dominant, leading, strong, tentative, and weak.

Recent Development and News in Rotavator market

  • In April 2025, CNH Industrial NV strengthened its presence in South America with the launch of new digital farming solutions and compatible implements, including advanced rotary tillers designed for the region's diverse agricultural needs.
  • In February 2025, Kubota Corp. showcased enhanced interoperability between its latest utility tractors and specialized rear-mounted implements at the World Ag Expo, demonstrating advanced rotary tillers for specialty crop applications.
  • In January 2025, Mahindra and Mahindra Ltd. reported a significant surge in its farm equipment sector sales, attributing the robust performance to strong demand for tractors and implements like rotavators, driven by favorable conditions for the Rabi crop harvest.
  • In January 2025, Sonalika International Tractors Ltd. announced a strategic expansion of its heavy-duty farm implement portfolio, with a specific focus on exporting advanced rotavator series to European and American markets.

Dive into Technavio’s robust research methodology, blending expert interviews, extensive data synthesis, and validated models for unparalleled Rotavator Market insights. See full methodology.

Market Scope
Page number 293
Base year 2025
Historic period 2020-2024
Forecast period 2026-2030
Growth momentum & CAGR Accelerate at a CAGR of 4.5%
Market growth 2026-2030 USD 491.4 million
Market structure Fragmented
YoY growth 2025-2026(%) 4.3%
Key countries China, Japan, India, South Korea, Australia, Indonesia, US, Canada, Mexico, Germany, France, UK, Italy, Spain, The Netherlands, Brazil, Argentina, Chile, South Africa, Saudi Arabia, UAE, Israel and Turkey
Competitive landscape Leading Companies, Market Positioning of Companies, Competitive Strategies, and Industry Risks

Request Free Sample

Research Analyst Overview

  • The rotavator market reflects a strategic pivot toward high-efficiency tillage solutions that address core operational and financial objectives. This tractor-mounted implement has become indispensable for achieving single-pass tillage, directly impacting cost-control measures. The integration of advanced components such as a multi-speed gearbox and durable, wear-resistant blades is critical, with newer implements demonstrating a reduction in maintenance needs by over 25%.
  • Innovations in tillage depth control and hydraulic offset capabilities allow for precise soil conditioning and crop residue incorporation, which are essential for sustainable farming. The choice between C-type blades and L-type blades is tailored to specific soil types to optimize soil aeration and support mechanical weed control.
  • Effective utilization of the power take-off (PTO) to power rotary tiller blades for soil pulverization is fundamental to superior seedbed preparation, enhancing both productivity and crop quality across both wetland cultivation and dry-land farming scenarios.

What are the Key Data Covered in this Rotavator Market Research and Growth Report?

  • What is the expected growth of the Rotavator Market between 2026 and 2030?

    • USD 491.4 million, at a CAGR of 4.5%

  • What segmentation does the market report cover?

    • The report is segmented by Product (Hydraulic, and Fixed), Type (L type, and C type), Application (Seedbed preparation, Soil conditioning, Crop residue management, Horticulture, and Others) and Geography (APAC, North America, Europe, South America, Middle East and Africa)

  • Which regions are analyzed in the report?

    • APAC, North America, Europe, South America and Middle East and Africa

  • What are the key growth drivers and market challenges?

    • Growing need for nutrient protection in agriculture fields, Growing threat from substitute products

  • Who are the major players in the Rotavator Market?

    • Action Construction Equipment Ltd., AGCO Corp., Beri Udyog Pvt. Ltd., CLAAS KGaA, CNH Industrial NV, Deere and Co., Greaves Cotton Ltd., Kubota Corp., KUHN SAS, Landforce, Mahindra and Mahindra Ltd., Maschio Gaspardo S.p.A., Piara Singh and Sons, Preet Agro Industries Pvt. Ltd., Sonalika International Tractors Ltd., Tirth Agro Technology Pvt. Ltd., Tractors and Farm Equipment Ltd. and Yanmar Holdings Co. Ltd.

Market Research Insights

  • Market dynamics are increasingly shaped by a focus on maximizing agricultural output through advanced implements. The adoption of rotavators with automated side-shift mechanisms can improve operational efficiency in horticulture tillage by up to 25% compared to manual adjustments. Furthermore, the integration of certified safety guards and ISO-certified designs reduces equipment downtime and enhances operator safety, contributing to better overall performance.
  • Transitioning from conventional primary tillage to rotavator-based secondary tillage practices can lower fuel consumption efficiency by over 15%, directly impacting operational time reduction. These advancements in agricultural machinery influence purchasing decisions, with a growing emphasis on implement durability and compatibility with existing tractor horsepower requirements to optimize soil tilth and stubble management.

We can help! Our analysts can customize this rotavator market research report to meet your requirements.

Get in touch

1. Executive Summary

1.1 Market overview

Executive Summary - Chart on Market Overview
Executive Summary - Data Table on Market Overview
Executive Summary - Chart on Global Market Characteristics
Executive Summary - Chart on Market by Geography
Executive Summary - Chart on Market Segmentation by Product
Executive Summary - Chart on Market Segmentation by Type
Executive Summary - Chart on Market Segmentation by Application
Executive Summary - Chart on Incremental Growth
Executive Summary - Data Table on Incremental Growth
Executive Summary - Chart on Company Market Positioning

2. Technavio Analysis

2.1 Analysis of price sensitivity, lifecycle, customer purchase basket, adoption rates, and purchase criteria

2.2 Criticality of inputs and Factors of differentiation

Chart on Overview on criticality of inputs and factors of differentiation

2.3 Factors of disruption

Chart on Overview on factors of disruption

2.4 Impact of drivers and challenges

Chart on Impact of drivers and challenges in 2025 and 2030

3. Market Landscape

3.1 Market ecosystem

Chart on Parent Market
Data Table on - Parent Market

3.2 Market characteristics

Chart on Market characteristics analysis

3.3 Value chain analysis

Chart on Value chain analysis

4. Market Sizing

4.1 Market definition

Data Table on Offerings of companies included in the market definition

4.2 Market segment analysis

Market segments

4.3 Market size 2025

4.4 Market outlook: Forecast for 2025-2030

Chart on Global - Market size and forecast 2025-2030 ($ million)
Data Table on Global - Market size and forecast 2025-2030 ($ million)
Chart on Global Market: Year-over-year growth 2025-2030 (%)
Data Table on Global Market: Year-over-year growth 2025-2030 (%)

5. Historic Market Size

5.1 Global Rotavator Market 2020 - 2024

Historic Market Size - Data Table on Global Rotavator Market 2020 - 2024 ($ million)

5.2 Product segment analysis 2020 - 2024

Historic Market Size - Product Segment 2020 - 2024 ($ million)

5.3 Type segment analysis 2020 - 2024

Historic Market Size - Type Segment 2020 - 2024 ($ million)

5.4 Application segment analysis 2020 - 2024

Historic Market Size - Application Segment 2020 - 2024 ($ million)

5.5 Geography segment analysis 2020 - 2024

Historic Market Size - Geography Segment 2020 - 2024 ($ million)

5.6 Country segment analysis 2020 - 2024

Historic Market Size - Country Segment 2020 - 2024 ($ million)

6. Qualitative Analysis

6.1 Impact of AI on global rotavator market

7. Five Forces Analysis

7.1 Five forces summary

Five forces analysis - Comparison between 2025 and 2030

7.2 Bargaining power of buyers

Bargaining power of buyers - Impact of key factors 2025 and 2030

7.3 Bargaining power of suppliers

Bargaining power of suppliers - Impact of key factors in 2025 and 2030

7.4 Threat of new entrants

Threat of new entrants - Impact of key factors in 2025 and 2030

7.5 Threat of substitutes

Threat of substitutes - Impact of key factors in 2025 and 2030

7.6 Threat of rivalry

Threat of rivalry - Impact of key factors in 2025 and 2030

7.7 Market condition

Chart on Market condition - Five forces 2025 and 2030

8. Market Segmentation by Product

8.1 Market segments

Chart on Product - Market share 2025-2030 (%)
Data Table on Product - Market share 2025-2030 (%)

8.2 Comparison by Product

Chart on Comparison by Product
Data Table on Comparison by Product

8.3 Hydraulic - Market size and forecast 2025-2030

Chart on Hydraulic - Market size and forecast 2025-2030 ($ million)
Data Table on Hydraulic - Market size and forecast 2025-2030 ($ million)
Chart on Hydraulic - Year-over-year growth 2025-2030 (%)
Data Table on Hydraulic - Year-over-year growth 2025-2030 (%)

8.4 Fixed - Market size and forecast 2025-2030

Chart on Fixed - Market size and forecast 2025-2030 ($ million)
Data Table on Fixed - Market size and forecast 2025-2030 ($ million)
Chart on Fixed - Year-over-year growth 2025-2030 (%)
Data Table on Fixed - Year-over-year growth 2025-2030 (%)

8.5 Market opportunity by Product

Market opportunity by Product ($ million)
Data Table on Market opportunity by Product ($ million)

9. Market Segmentation by Type

9.1 Market segments

Chart on Type - Market share 2025-2030 (%)
Data Table on Type - Market share 2025-2030 (%)

9.2 Comparison by Type

Chart on Comparison by Type
Data Table on Comparison by Type

9.3 L type - Market size and forecast 2025-2030

Chart on L type - Market size and forecast 2025-2030 ($ million)
Data Table on L type - Market size and forecast 2025-2030 ($ million)
Chart on L type - Year-over-year growth 2025-2030 (%)
Data Table on L type - Year-over-year growth 2025-2030 (%)

9.4 C type - Market size and forecast 2025-2030

Chart on C type - Market size and forecast 2025-2030 ($ million)
Data Table on C type - Market size and forecast 2025-2030 ($ million)
Chart on C type - Year-over-year growth 2025-2030 (%)
Data Table on C type - Year-over-year growth 2025-2030 (%)

9.5 Market opportunity by Type

Market opportunity by Type ($ million)
Data Table on Market opportunity by Type ($ million)

10. Market Segmentation by Application

10.1 Market segments

Chart on Application - Market share 2025-2030 (%)
Data Table on Application - Market share 2025-2030 (%)

10.2 Comparison by Application

Chart on Comparison by Application
Data Table on Comparison by Application

10.3 Seedbed preparation - Market size and forecast 2025-2030

Chart on Seedbed preparation - Market size and forecast 2025-2030 ($ million)
Data Table on Seedbed preparation - Market size and forecast 2025-2030 ($ million)
Chart on Seedbed preparation - Year-over-year growth 2025-2030 (%)
Data Table on Seedbed preparation - Year-over-year growth 2025-2030 (%)

10.4 Soil conditioning - Market size and forecast 2025-2030

Chart on Soil conditioning - Market size and forecast 2025-2030 ($ million)
Data Table on Soil conditioning - Market size and forecast 2025-2030 ($ million)
Chart on Soil conditioning - Year-over-year growth 2025-2030 (%)
Data Table on Soil conditioning - Year-over-year growth 2025-2030 (%)

10.5 Crop residue management - Market size and forecast 2025-2030

Chart on Crop residue management - Market size and forecast 2025-2030 ($ million)
Data Table on Crop residue management - Market size and forecast 2025-2030 ($ million)
Chart on Crop residue management - Year-over-year growth 2025-2030 (%)
Data Table on Crop residue management - Year-over-year growth 2025-2030 (%)

10.6 Horticulture - Market size and forecast 2025-2030

Chart on Horticulture - Market size and forecast 2025-2030 ($ million)
Data Table on Horticulture - Market size and forecast 2025-2030 ($ million)
Chart on Horticulture - Year-over-year growth 2025-2030 (%)
Data Table on Horticulture - Year-over-year growth 2025-2030 (%)

10.7 Others - Market size and forecast 2025-2030

Chart on Others - Market size and forecast 2025-2030 ($ million)
Data Table on Others - Market size and forecast 2025-2030 ($ million)
Chart on Others - Year-over-year growth 2025-2030 (%)
Data Table on Others - Year-over-year growth 2025-2030 (%)

10.8 Market opportunity by Application

Market opportunity by Application ($ million)
Data Table on Market opportunity by Application ($ million)

11. Customer Landscape

11.1 Customer landscape overview

Analysis of price sensitivity, lifecycle, customer purchase basket, adoption rates, and purchase criteria

12. Geographic Landscape

12.1 Geographic segmentation

Chart on Market share by geography 2025-2030 (%)
Data Table on Market share by geography 2025-2030 (%)

12.2 Geographic comparison

Chart on Geographic comparison
Data Table on Geographic comparison

12.3 APAC - Market size and forecast 2025-2030

Chart on APAC - Market size and forecast 2025-2030 ($ million)
Data Table on APAC - Market size and forecast 2025-2030 ($ million)
Chart on APAC - Year-over-year growth 2025-2030 (%)
Data Table on APAC - Year-over-year growth 2025-2030 (%)
Chart on Regional Comparison - APAC
Data Table on Regional Comparison - APAC

12.3.1 China - Market size and forecast 2025-2030

Chart on China - Market size and forecast 2025-2030 ($ million)
Data Table on China - Market size and forecast 2025-2030 ($ million)
Chart on China - Year-over-year growth 2025-2030 (%)
Data Table on China - Year-over-year growth 2025-2030 (%)

12.3.2 Japan - Market size and forecast 2025-2030

Chart on Japan - Market size and forecast 2025-2030 ($ million)
Data Table on Japan - Market size and forecast 2025-2030 ($ million)
Chart on Japan - Year-over-year growth 2025-2030 (%)
Data Table on Japan - Year-over-year growth 2025-2030 (%)

12.3.3 India - Market size and forecast 2025-2030

Chart on India - Market size and forecast 2025-2030 ($ million)
Data Table on India - Market size and forecast 2025-2030 ($ million)
Chart on India - Year-over-year growth 2025-2030 (%)
Data Table on India - Year-over-year growth 2025-2030 (%)

12.3.4 South Korea - Market size and forecast 2025-2030

Chart on South Korea - Market size and forecast 2025-2030 ($ million)
Data Table on South Korea - Market size and forecast 2025-2030 ($ million)
Chart on South Korea - Year-over-year growth 2025-2030 (%)
Data Table on South Korea - Year-over-year growth 2025-2030 (%)

12.3.5 Australia - Market size and forecast 2025-2030

Chart on Australia - Market size and forecast 2025-2030 ($ million)
Data Table on Australia - Market size and forecast 2025-2030 ($ million)
Chart on Australia - Year-over-year growth 2025-2030 (%)
Data Table on Australia - Year-over-year growth 2025-2030 (%)

12.3.6 Indonesia - Market size and forecast 2025-2030

Chart on Indonesia - Market size and forecast 2025-2030 ($ million)
Data Table on Indonesia - Market size and forecast 2025-2030 ($ million)
Chart on Indonesia - Year-over-year growth 2025-2030 (%)
Data Table on Indonesia - Year-over-year growth 2025-2030 (%)

12.4 North America - Market size and forecast 2025-2030

Chart on North America - Market size and forecast 2025-2030 ($ million)
Data Table on North America - Market size and forecast 2025-2030 ($ million)
Chart on North America - Year-over-year growth 2025-2030 (%)
Data Table on North America - Year-over-year growth 2025-2030 (%)
Chart on Regional Comparison - North America
Data Table on Regional Comparison - North America

12.4.1 US - Market size and forecast 2025-2030

Chart on US - Market size and forecast 2025-2030 ($ million)
Data Table on US - Market size and forecast 2025-2030 ($ million)
Chart on US - Year-over-year growth 2025-2030 (%)
Data Table on US - Year-over-year growth 2025-2030 (%)

12.4.2 Canada - Market size and forecast 2025-2030

Chart on Canada - Market size and forecast 2025-2030 ($ million)
Data Table on Canada - Market size and forecast 2025-2030 ($ million)
Chart on Canada - Year-over-year growth 2025-2030 (%)
Data Table on Canada - Year-over-year growth 2025-2030 (%)

12.4.3 Mexico - Market size and forecast 2025-2030

Chart on Mexico - Market size and forecast 2025-2030 ($ million)
Data Table on Mexico - Market size and forecast 2025-2030 ($ million)
Chart on Mexico - Year-over-year growth 2025-2030 (%)
Data Table on Mexico - Year-over-year growth 2025-2030 (%)

12.5 Europe - Market size and forecast 2025-2030

Chart on Europe - Market size and forecast 2025-2030 ($ million)
Data Table on Europe - Market size and forecast 2025-2030 ($ million)
Chart on Europe - Year-over-year growth 2025-2030 (%)
Data Table on Europe - Year-over-year growth 2025-2030 (%)
Chart on Regional Comparison - Europe
Data Table on Regional Comparison - Europe

12.5.1 Germany - Market size and forecast 2025-2030

Chart on Germany - Market size and forecast 2025-2030 ($ million)
Data Table on Germany - Market size and forecast 2025-2030 ($ million)
Chart on Germany - Year-over-year growth 2025-2030 (%)
Data Table on Germany - Year-over-year growth 2025-2030 (%)

12.5.2 France - Market size and forecast 2025-2030

Chart on France - Market size and forecast 2025-2030 ($ million)
Data Table on France - Market size and forecast 2025-2030 ($ million)
Chart on France - Year-over-year growth 2025-2030 (%)
Data Table on France - Year-over-year growth 2025-2030 (%)

12.5.3 UK - Market size and forecast 2025-2030

Chart on UK - Market size and forecast 2025-2030 ($ million)
Data Table on UK - Market size and forecast 2025-2030 ($ million)
Chart on UK - Year-over-year growth 2025-2030 (%)
Data Table on UK - Year-over-year growth 2025-2030 (%)

12.5.4 Italy - Market size and forecast 2025-2030

Chart on Italy - Market size and forecast 2025-2030 ($ million)
Data Table on Italy - Market size and forecast 2025-2030 ($ million)
Chart on Italy - Year-over-year growth 2025-2030 (%)
Data Table on Italy - Year-over-year growth 2025-2030 (%)

12.5.5 Spain - Market size and forecast 2025-2030

Chart on Spain - Market size and forecast 2025-2030 ($ million)
Data Table on Spain - Market size and forecast 2025-2030 ($ million)
Chart on Spain - Year-over-year growth 2025-2030 (%)
Data Table on Spain - Year-over-year growth 2025-2030 (%)

12.5.6 The Netherlands - Market size and forecast 2025-2030

Chart on The Netherlands - Market size and forecast 2025-2030 ($ million)
Data Table on The Netherlands - Market size and forecast 2025-2030 ($ million)
Chart on The Netherlands - Year-over-year growth 2025-2030 (%)
Data Table on The Netherlands - Year-over-year growth 2025-2030 (%)

12.6 South America - Market size and forecast 2025-2030

Chart on South America - Market size and forecast 2025-2030 ($ million)
Data Table on South America - Market size and forecast 2025-2030 ($ million)
Chart on South America - Year-over-year growth 2025-2030 (%)
Data Table on South America - Year-over-year growth 2025-2030 (%)
Chart on Regional Comparison - South America
Data Table on Regional Comparison - South America

12.6.1 Brazil - Market size and forecast 2025-2030

Chart on Brazil - Market size and forecast 2025-2030 ($ million)
Data Table on Brazil - Market size and forecast 2025-2030 ($ million)
Chart on Brazil - Year-over-year growth 2025-2030 (%)
Data Table on Brazil - Year-over-year growth 2025-2030 (%)

12.6.2 Argentina - Market size and forecast 2025-2030

Chart on Argentina - Market size and forecast 2025-2030 ($ million)
Data Table on Argentina - Market size and forecast 2025-2030 ($ million)
Chart on Argentina - Year-over-year growth 2025-2030 (%)
Data Table on Argentina - Year-over-year growth 2025-2030 (%)

12.6.3 Chile - Market size and forecast 2025-2030

Chart on Chile - Market size and forecast 2025-2030 ($ million)
Data Table on Chile - Market size and forecast 2025-2030 ($ million)
Chart on Chile - Year-over-year growth 2025-2030 (%)
Data Table on Chile - Year-over-year growth 2025-2030 (%)

12.7 Middle East and Africa - Market size and forecast 2025-2030

Chart on Middle East and Africa - Market size and forecast 2025-2030 ($ million)
Data Table on Middle East and Africa - Market size and forecast 2025-2030 ($ million)
Chart on Middle East and Africa - Year-over-year growth 2025-2030 (%)
Data Table on Middle East and Africa - Year-over-year growth 2025-2030 (%)
Chart on Regional Comparison - Middle East and Africa
Data Table on Regional Comparison - Middle East and Africa

12.7.1 South Africa - Market size and forecast 2025-2030

Chart on South Africa - Market size and forecast 2025-2030 ($ million)
Data Table on South Africa - Market size and forecast 2025-2030 ($ million)
Chart on South Africa - Year-over-year growth 2025-2030 (%)
Data Table on South Africa - Year-over-year growth 2025-2030 (%)

12.7.2 Saudi Arabia - Market size and forecast 2025-2030

Chart on Saudi Arabia - Market size and forecast 2025-2030 ($ million)
Data Table on Saudi Arabia - Market size and forecast 2025-2030 ($ million)
Chart on Saudi Arabia - Year-over-year growth 2025-2030 (%)
Data Table on Saudi Arabia - Year-over-year growth 2025-2030 (%)

12.7.3 UAE - Market size and forecast 2025-2030

Chart on UAE - Market size and forecast 2025-2030 ($ million)
Data Table on UAE - Market size and forecast 2025-2030 ($ million)
Chart on UAE - Year-over-year growth 2025-2030 (%)
Data Table on UAE - Year-over-year growth 2025-2030 (%)

12.7.4 Israel - Market size and forecast 2025-2030

Chart on Israel - Market size and forecast 2025-2030 ($ million)
Data Table on Israel - Market size and forecast 2025-2030 ($ million)
Chart on Israel - Year-over-year growth 2025-2030 (%)
Data Table on Israel - Year-over-year growth 2025-2030 (%)

12.7.5 Turkey - Market size and forecast 2025-2030

Chart on Turkey - Market size and forecast 2025-2030 ($ million)
Data Table on Turkey - Market size and forecast 2025-2030 ($ million)
Chart on Turkey - Year-over-year growth 2025-2030 (%)
Data Table on Turkey - Year-over-year growth 2025-2030 (%)

12.8 Market opportunity by geography

Market opportunity by geography ($ million)
Data Tables on Market opportunity by geography ($ million)

13. Drivers, Challenges, and Opportunity

13.1 Market drivers

Growing need for nutrient protection in agriculture fields
Increasing need for creating consistent seedbed
Increasing preference toward certified rotavators

13.2 Market challenges

Growing threat from substitute products
Rise in end-user inclination toward pre-used and rental rotavators
Frequent replacement requirement of rotavator blades

13.3 Impact of drivers and challenges

Impact of drivers and challenges in 2025 and 2030

13.4 Market opportunities

Growing focus on agricultural mechanization
Influx of rotavators with automated features
Growing preference for rotavators with cost-saving features

14. Competitive Landscape

14.1 Overview

14.2

Overview on criticality of inputs and factors of differentiation

14.3 Landscape disruption

Overview on factors of disruption

14.4 Industry risks

Impact of key risks on business

15. Competitive Analysis

15.1 Companies profiled

Companies covered

15.2 Company ranking index

15.3 Market positioning of companies

Matrix on companies position and classification

15.4 AGCO Corp.

AGCO Corp. - Overview
AGCO Corp. - Business segments
AGCO Corp. - Key news
AGCO Corp. - Key offerings
AGCO Corp. - Segment focus
SWOT

15.5 Beri Udyog Pvt. Ltd.

Beri Udyog Pvt. Ltd. - Overview
Beri Udyog Pvt. Ltd. - Product / Service
Beri Udyog Pvt. Ltd. - Key offerings
SWOT

15.6 CLAAS KGaA

CLAAS KGaA - Overview
CLAAS KGaA - Product / Service
CLAAS KGaA - Key offerings
SWOT

15.7 CNH Industrial NV

CNH Industrial NV - Overview
CNH Industrial NV - Business segments
CNH Industrial NV - Key offerings
CNH Industrial NV - Segment focus
SWOT

15.8 Deere and Co.

Deere and Co. - Overview
Deere and Co. - Business segments
Deere and Co. - Key news
Deere and Co. - Key offerings
Deere and Co. - Segment focus
SWOT

15.9 Kubota Corp.

Kubota Corp. - Overview
Kubota Corp. - Business segments
Kubota Corp. - Key offerings
Kubota Corp. - Segment focus
SWOT

15.10 KUHN SAS

KUHN SAS - Overview
KUHN SAS - Product / Service
KUHN SAS - Key offerings
SWOT

15.11 Landforce

Landforce - Overview
Landforce - Product / Service
Landforce - Key offerings
SWOT

15.12 Mahindra and Mahindra Ltd.

Mahindra and Mahindra Ltd. - Overview
Mahindra and Mahindra Ltd. - Business segments
Mahindra and Mahindra Ltd. - Key news
Mahindra and Mahindra Ltd. - Key offerings
Mahindra and Mahindra Ltd. - Segment focus
SWOT

15.13 Maschio Gaspardo S.p.A.

Maschio Gaspardo S.p.A. - Overview
Maschio Gaspardo S.p.A. - Product / Service
Maschio Gaspardo S.p.A. - Key offerings
SWOT

15.14 Preet Agro Industries Pvt. Ltd.

Preet Agro Industries Pvt. Ltd. - Overview
Preet Agro Industries Pvt. Ltd. - Product / Service
Preet Agro Industries Pvt. Ltd. - Key offerings
SWOT

15.15 Sonalika International Tractors Ltd.

Sonalika International Tractors Ltd. - Overview
Sonalika International Tractors Ltd. - Product / Service
Sonalika International Tractors Ltd. - Key offerings
SWOT

15.16 Tirth Agro Technology Pvt. Ltd.

Tirth Agro Technology Pvt. Ltd. - Overview
Tirth Agro Technology Pvt. Ltd. - Product / Service
Tirth Agro Technology Pvt. Ltd. - Key offerings
SWOT

15.17 Tractors and Farm Equipment Ltd.

Tractors and Farm Equipment Ltd. - Overview
Tractors and Farm Equipment Ltd. - Product / Service
Tractors and Farm Equipment Ltd. - Key offerings
SWOT

15.18 Yanmar Holdings Co. Ltd.

Yanmar Holdings Co. Ltd. - Overview
Yanmar Holdings Co. Ltd. - Product / Service
Yanmar Holdings Co. Ltd. - Key offerings
SWOT

16. Appendix

16.1 Scope of the report

Market definition
Objectives
Notes and caveats

16.2 Inclusions and exclusions checklist

Inclusions checklist
Exclusions checklist

16.3 Currency conversion rates for US$

16.4 Research methodology

16.5 Data procurement

Information sources

16.6 Data validation

16.7 Validation techniques employed for market sizing

16.8 Data synthesis

16.9 360 degree market analysis

16.10 List of abbreviations

Research Methodology

Technavio presents a detailed picture of the market by way of study, synthesis, and summation of data from multiple sources. The analysts have presented the various facets of the market with a particular focus on identifying the key industry influencers. The data thus presented is comprehensive, reliable, and the result of extensive research, both primary and secondary.

INFORMATION SOURCES

Primary sources

  • Manufacturers and suppliers
  • Channel partners
  • Industry experts
  • Strategic decision makers

Secondary sources

  • Industry journals and periodicals
  • Government data
  • Financial reports of key industry players
  • Historical data
  • Press releases

DATA ANALYSIS

Data Synthesis

  • Collation of data
  • Estimation of key figures
  • Analysis of derived insights

Data Validation

  • Triangulation with data models
  • Reference against proprietary databases
  • Corroboration with industry experts

REPORT WRITING

Qualitative

  • Market drivers
  • Market challenges
  • Market trends
  • Five forces analysis

Quantitative

  • Market size and forecast
  • Market segmentation
  • Geographical insights
  • Competitive landscape

Interested in this report?

Get your sample now to see our research methodology and insights!

Download Now

Frequently Asked Questions

Rotavator market growth will increase by USD 491.4 million during 2026-2030.

The Rotavator market is expected to grow at a CAGR of 4.5% during 2026-2030.

Rotavator market is segmented by Product (Hydraulic, Fixed) Type (L type, C type) Application (Seedbed preparation, Soil conditioning, Crop residue management, Horticulture, Others)

Action Construction Equipment Ltd., AGCO Corp., Beri Udyog Pvt. Ltd., CLAAS KGaA, CNH Industrial NV, Deere and Co., Greaves Cotton Ltd., Kubota Corp., KUHN SAS, Landforce, Mahindra and Mahindra Ltd., Maschio Gaspardo S.p.A., Piara Singh and Sons, Preet Agro Industries Pvt. Ltd., Sonalika International Tractors Ltd., Tirth Agro Technology Pvt. Ltd., Tractors and Farm Equipment Ltd., Yanmar Holdings Co. Ltd. are a few of the key vendors in the Rotavator market.

APAC will register the highest growth rate of 55.5% among the other regions. Therefore, the Rotavator market in APAC is expected to garner significant business opportunities for the vendors during the forecast period.

China, Japan, India, South Korea, Australia, Indonesia, US, Canada, Mexico, Germany, France, UK, Italy, Spain, The Netherlands, Brazil, Argentina, Chile, South Africa, Saudi Arabia, UAE, Israel, Turkey

  • Growing need for nutrient protection in agriculture fields is the driving factor this market.

The Rotavator market vendors should focus on grabbing business opportunities from the Product segment as it accounted for the largest market share in the base year.