Agricultural Machinery Market Analysis, Size, and Forecast 2026-2030: APAC (China, India, and Japan), Europe (Germany, France, and Italy), North America (US, Canada, and Mexico), South America (Brazil, Argentina, and Colombia), Middle East and Africa (Saudi Arabia, Turkey, and UAE), and Rest of World (ROW)

Agricultural Machinery Market Analysis, Size, and Forecast 2026-2030:
APAC (China, India, and Japan), Europe (Germany, France, and Italy), North America (US, Canada, and Mexico), South America (Brazil, Argentina, and Colombia), Middle East and Africa (Saudi Arabia, Turkey, and UAE), and Rest of World (ROW)

Published: Mar 2026 313 Pages SKU: IRTNTR72828

Market Overview at a Glance

$55.46 B
Market Opportunity
5.8%
CAGR 2025 - 2030
36.4%
APAC Growth
$120.13 B
Tractors segment 2024

Agricultural Machinery Market Size 2026-2030

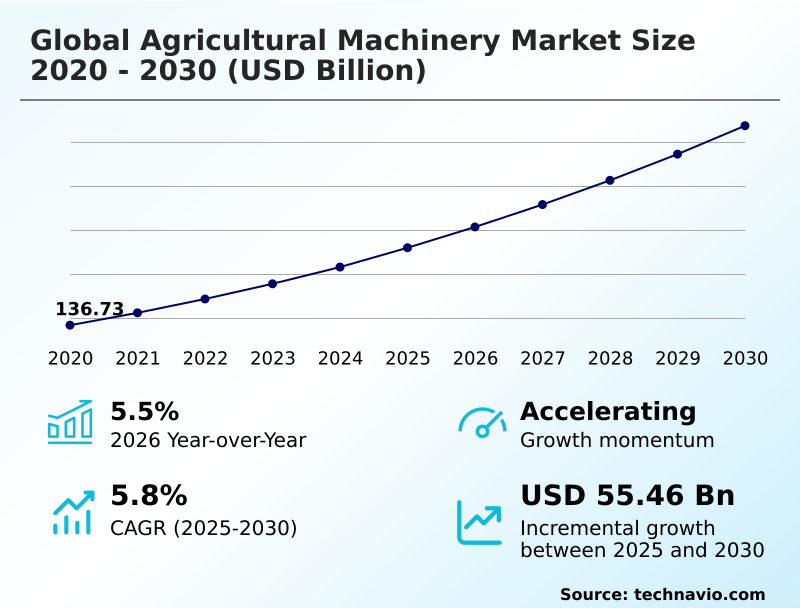
The agricultural machinery market size is valued to increase by USD 55.46 billion, at a CAGR of 5.8% from 2025 to 2030. Increasing global population and imperative for food security will drive the agricultural machinery market.

Major Market Trends & Insights

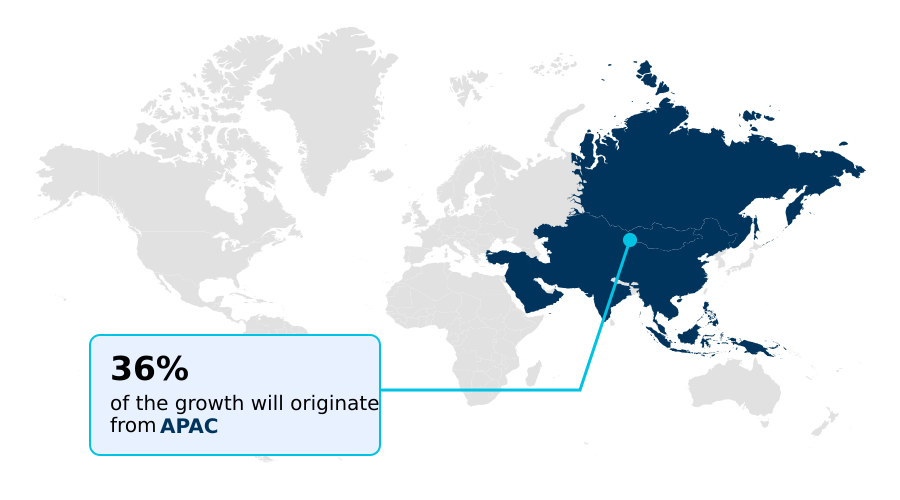
  • APAC dominated the market and accounted for a 36.4% growth during the forecast period.
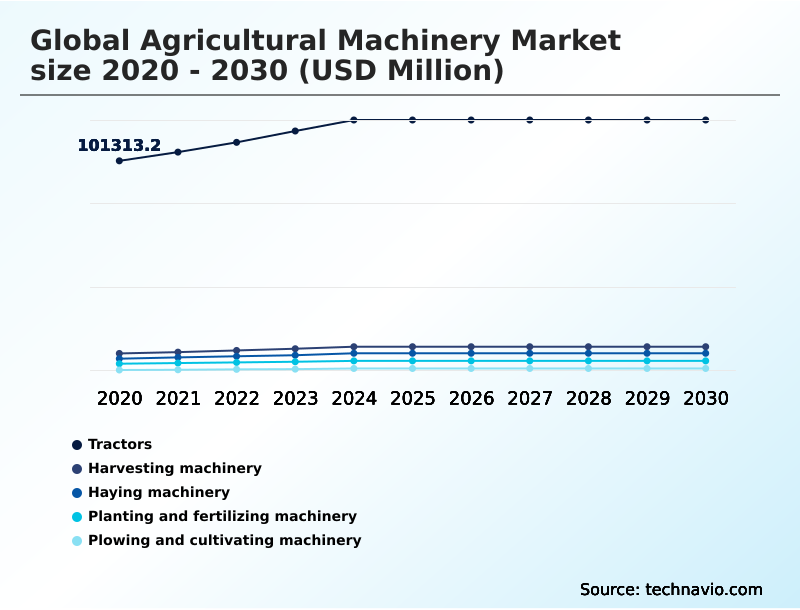
  • By Type - Tractors segment was valued at USD 120.13 billion in 2024
  • By Application - Land development and seedbed preparation segment accounted for the largest market revenue share in 2024

Market Size & Forecast

  • Market Opportunities: USD 90.66 billion
  • Market Future Opportunities: USD 55.46 billion
  • CAGR from 2025 to 2030 : 5.8%

Market Summary

  • The agricultural machinery market is undergoing a profound transformation, shifting from a focus on mechanical power to the development of intelligent, connected platforms. This evolution is driven by the need for enhanced productivity and sustainability in global food production. The integration of precision agriculture technologies, such as variable rate application and advanced sensor suites, is central to this change.
  • For instance, a large-scale agribusiness can now leverage real-time telematics from its entire fleet of combine harvesters and tractors to optimize logistics, schedule proactive maintenance, and analyze performance data, thereby maximizing uptime during critical operational windows. This data-driven approach allows for more efficient use of resources and informed decision-making.
  • However, the high capital investment required for this advanced equipment and the need for new operator skills present significant adoption hurdles. The market's future trajectory is defined by the ongoing development of autonomous systems and data-centric business models, which promise to further redefine agricultural efficiency.
  • This includes a move towards next-generation farm implements that are not only powerful but also integral components of a wider digital ecosystem focused on farm data management.

What will be the Size of the Agricultural Machinery Market during the forecast period?

Get Key Insights on Market Forecast (PDF) Request Free Sample

How is the Agricultural Machinery Market Segmented?

The agricultural machinery industry research report provides comprehensive data (region-wise segment analysis), with forecasts and estimates in "USD million" for the period 2026-2030, as well as historical data from 2020-2024 for the following segments.

  • Type
    • Tractors
    • Harvesting machinery
    • Haying machinery
    • Planting and fertilizing machinery
    • Plowing and cultivating machinery
  • Application
    • Land development and seedbed preparation
    • Sowing and planting
    • Harvesting and threshing
    • Others
  • Product type
    • Manual
    • Semi-automatic
    • Fully automatic
  • Geography
    • APAC
      • China
      • India
      • Japan
    • Europe
      • Germany
      • France
      • Italy
    • North America
      • US
      • Canada
      • Mexico
    • South America
      • Brazil
      • Argentina
      • Colombia
    • Middle East and Africa
      • Saudi Arabia
      • Turkey
      • UAE
    • Rest of World (ROW)

By Type Insights

The tractors segment is estimated to witness significant growth during the forecast period.

Tractors serve as the fundamental power source in agriculture, but their role is evolving from mere motive force to central hubs of data-driven farming. This segment is increasingly defined by horsepower and the integration of smart agricultural machinery features.

Advanced GPS guidance systems and automated headland turning are now standard, enhancing operational precision. The industry is moving towards fully autonomous tractors to address labor shortages, with developments in fleet management solutions enabling remote oversight.

This technological shift, supported by emerging farm equipment interoperability standards and robust OEM data platforms, has improved efficiency, with precision techniques reducing input waste by up to 15%.

The growth of connected farm equipment ecosystems, alongside custom hiring centers, is also expanding access to these advanced capabilities.

Request Free Sample

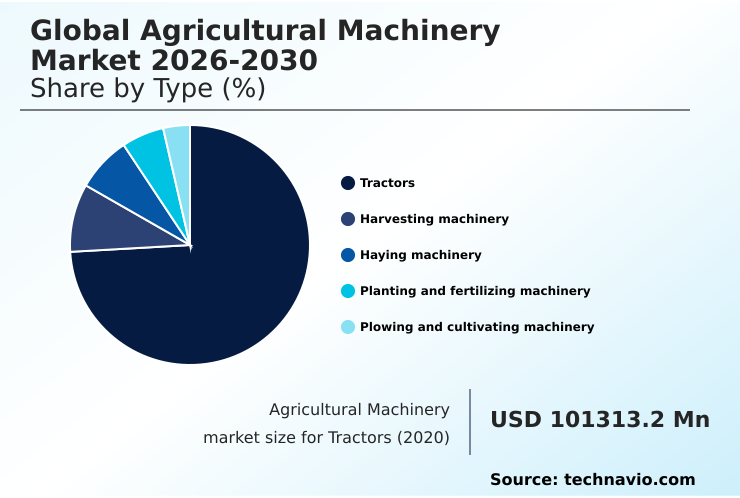
The Tractors segment was valued at USD 120.13 billion in 2024 and showed a gradual increase during the forecast period.

Request Free Sample

Regional Analysis

APAC is estimated to contribute 36.4% to the growth of the global market during the forecast period.Technavio’s analysts have elaborately explained the regional trends and drivers that shape the market during the forecast period.

See How Agricultural Machinery Market Demand is Rising in APAC Request Free Sample

The global agricultural machinery market exhibits distinct regional dynamics. In APAC, which accounts for over 36% of incremental growth, the focus is on smallholder mechanization solutions and developing appropriate business models like pay-per-use service platforms.

North America leads in the adoption of large-scale automation and precision nutrient management to manage vast acreages efficiently.

Meanwhile, Europe's market is heavily influenced by sustainability regulations that are driving innovation in advanced forage harvesting techniques and equipment that supports a circular nutrient system.

These regulations are pushing for a 20% reduction in chemical inputs, which accelerates demand for precision sprayers and implements that improve soil health.

This diverse landscape requires manufacturers to tailor their product development and connected farm equipment ecosystems to specific regional needs, from robust no-till planters in the Americas to compact, versatile machines in Asia.

Market Dynamics

Our researchers analyzed the data with 2025 as the base year, along with the key drivers, trends, and challenges. A holistic analysis of drivers will help companies refine their marketing strategies to gain a competitive advantage.

  • Strategic decision-making in the global agricultural machinery market 2026-2030 is becoming increasingly complex, as enterprises evaluate the long-term value of technological investments. A critical topic is the global agricultural machinery market 2026-2030 electric vs diesel tractor efficiency debate, where total cost of ownership is weighed against sustainability mandates.
  • Concurrently, a global agricultural machinery market 2026-2030 autonomous tractor ROI analysis is essential for justifying high capital outlays, particularly as the global agricultural machinery market 2026-2030 role of AI in crop harvesting becomes more pronounced.
  • For many, the global agricultural machinery market 2026-2030 precision agriculture adoption barriers remain high, prompting a need for a thorough global agricultural machinery market 2026-2030 digital farm management software comparison to find user-friendly solutions.
  • The question of global agricultural machinery market 2026-2030 data ownership in smart farming is a boardroom-level concern, directly linked to the global agricultural machinery market 2026-2030 impact of telematics on farm profitability. As the global agricultural machinery market 2026-2030 future of regenerative agriculture equipment takes shape, understanding global agricultural machinery market 2026-2030 soil health and conservation tillage becomes non-negotiable.
  • This is amplified by the global agricultural machinery market 2026-2030 challenges of mechanizing small farms, where different solutions are needed. Integrating new tools requires looking at the global agricultural machinery market 2026-2030 benefits of controlled traffic farming and the global agricultural machinery market 2026-2030 ISOBUS standards and compatibility issues.
  • The global agricultural machinery market 2026-2030 telematics for predictive maintenance offers clear value, with some integrated operations reporting efficiency gains more than twice those of non-connected fleets.
  • The industry is also exploring the global agricultural machinery market 2026-2030 variable rate technology for fertilization, the global agricultural machinery market 2026-2030 sustainable energy for farm equipment, and the global agricultural machinery market 2026-2030 reducing soil compaction with machinery.
  • Looking ahead, the rise of global agricultural machinery market 2026-2030 swarm robotics in agriculture and the details of global agricultural machinery market 2026-2030 OEM data platforms for agriculture, global agricultural machinery market 2026-2030 integrating drones with farm machinery and global agricultural machinery market 2026-2030 carbon-neutral farming equipment analysis, will define the next wave of innovation.

What are the key market drivers leading to the rise in the adoption of Agricultural Machinery Industry?

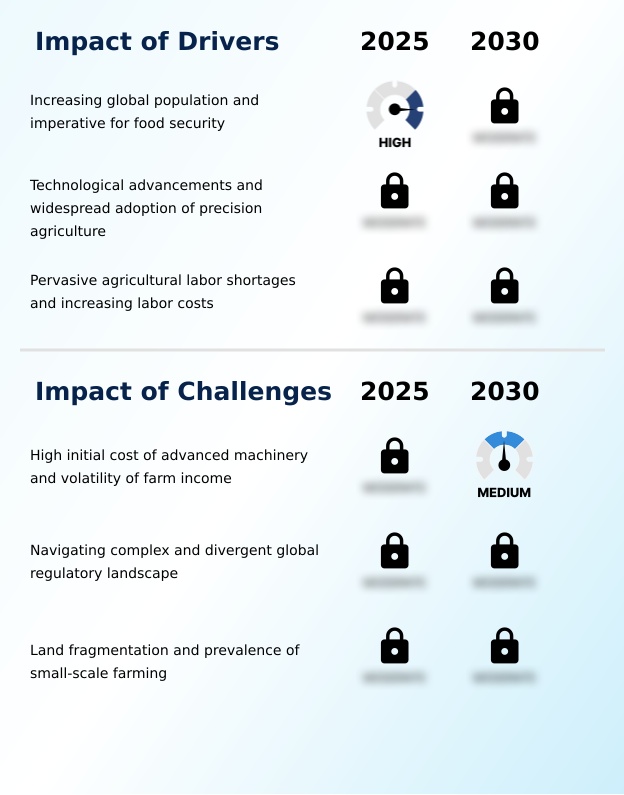
  • The relentless growth of the global population and the corresponding imperative for food security serves as a fundamental driver for the agricultural machinery market.

  • The market is propelled by fundamental drivers, including the need to enhance food security and address structural labor shortages.
  • The adoption of precision agriculture is central, with advanced systems enabling farmers to increase yields by up to 15% on existing land.
  • Technological advancements like high-speed planting systems and smart agricultural machinery allow for timely and efficient operations within narrow agronomic windows.
  • The scarcity of skilled labor makes agricultural robotics and autonomous tractors essential, reducing dependency on manual work for certain harvesting tasks by over 70%.
  • Furthermore, governments are encouraging sustainable farm mechanization through incentives, supporting the adoption of technologies that promote soil health and efficient resource use.
  • The development of see-and-spray technology and other precision application technologies directly supports these goals by minimizing chemical inputs and environmental impact.

What are the market trends shaping the Agricultural Machinery Industry?

  • The rise of electrification and alternative propulsion systems represents a significant market trend. This movement is steered by heightened sustainability objectives and evolving regulatory frameworks.

  • Key trends are reshaping the agricultural machinery market, led by the push toward full autonomy and alternative power. The development of hybrid diesel-electric architecture in high-horsepower equipment is improving fuel efficiency by up to 20%, while fully electrified farm equipment is becoming viable for smaller-scale operations.
  • The move toward unmanned agricultural vehicles promises to enhance asset utilization by over 40% by enabling 24/7 field operations. Another transformative trend is the growth of data-centric service models, where manufacturers offer subscription-based services built on OEM data platforms. This shift, along with the rise of agricultural robotics-as-a-service (RaaS) and equipment-as-a-service models, is changing how farmers access technology.
  • The increasing focus on precision seeding equipment and advanced tillage implements further underscores the industry's direction toward resource optimization and higher productivity.

What challenges does the Agricultural Machinery Industry face during its growth?

  • The high initial capital cost of advanced machinery, coupled with the inherent volatility of farm income, presents a key structural challenge to industry growth.

  • Despite strong growth drivers, the agricultural machinery market faces significant challenges that temper adoption rates. The high capital cost of advanced machinery, such as self-propelled sprayers and combine harvesters, remains a primary barrier, particularly when farm incomes are volatile.
  • Navigating divergent global regulations for emissions and safety can increase R&D costs for a single product line by over 25%, complicating market entry and scaling. Furthermore, the physical reality of land fragmentation in many regions is incompatible with the design of large-scale equipment, limiting the market for high-horsepower tractors.
  • Addressing this requires a focus on smallholder mechanization business models and a departure from conventional R&D trajectories. Issues surrounding farm machinery data security protocols and the push for the right to repair farm equipment also introduce complexity for manufacturers.

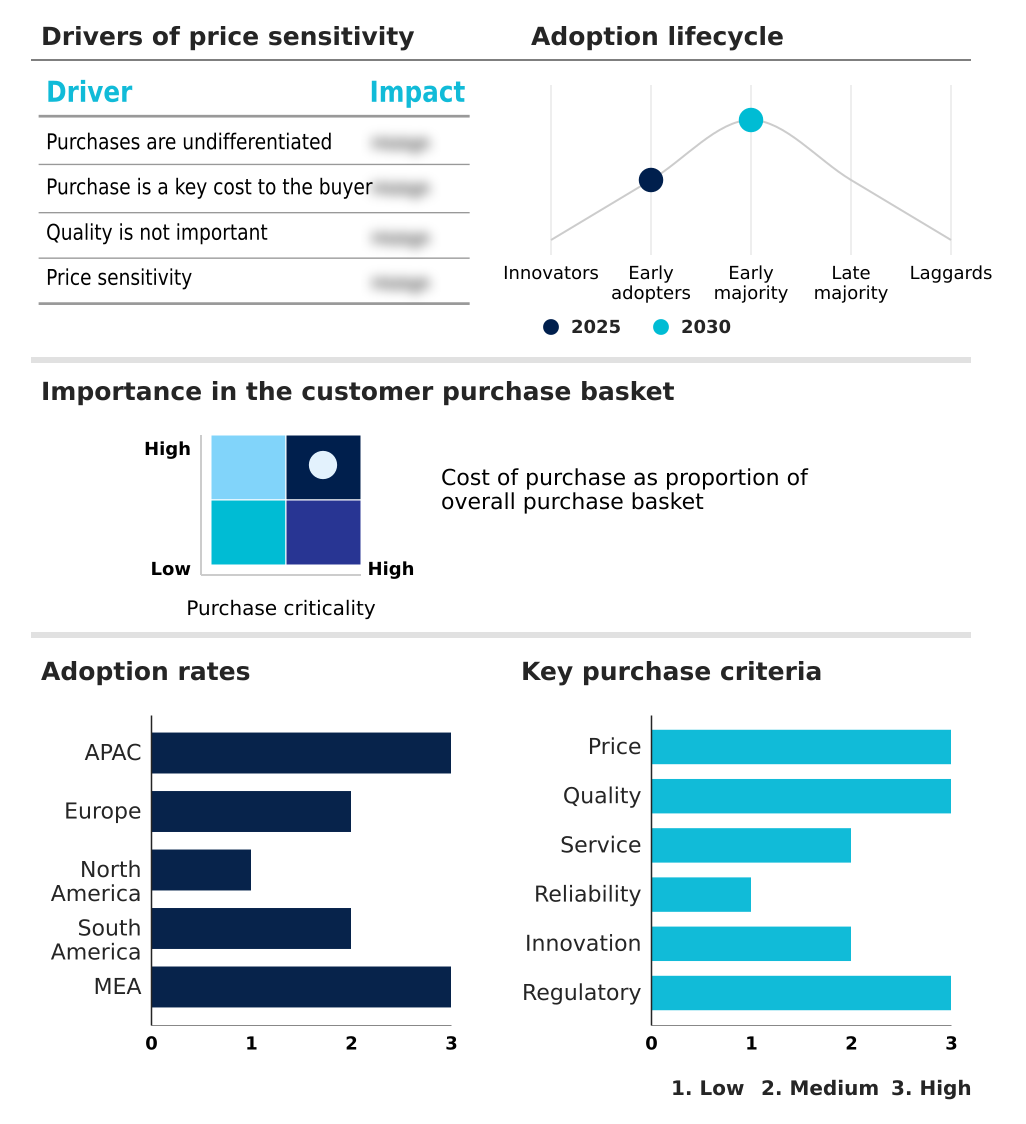
Exclusive Technavio Analysis on Customer Landscape

The agricultural machinery market forecasting report includes the adoption lifecycle of the market, covering from the innovator’s stage to the laggard’s stage. It focuses on adoption rates in different regions based on penetration. Furthermore, the agricultural machinery market report also includes key purchase criteria and drivers of price sensitivity to help companies evaluate and develop their market growth analysis strategies.

Customer Landscape of Agricultural Machinery Industry

Competitive Landscape

Companies are implementing various strategies, such as strategic alliances, agricultural machinery market forecast, partnerships, mergers and acquisitions, geographical expansion, and product/service launches, to enhance their presence in the industry.

AGCO Corp. - A diverse portfolio of agricultural machinery addresses core farming operations, from tillage and planting to harvesting and forage production, meeting varied operational scales.

The industry research and growth report includes detailed analyses of the competitive landscape of the market and information about key companies, including:

  • AGCO Corp.
  • Agrale SA
  • Bucher Industries AG
  • China National Machinery Ltd.
  • CLAAS KGaA
  • CNH Industrial NV
  • Daedong Corp.
  • Deere and Co.
  • HORSCH Maschinen GmbH
  • ISEKI and Co. Ltd.
  • J C Bamford Excavators Ltd.
  • Jiangsu Changfa Group Co. Ltd
  • Kubota Corp.
  • KUHN SAS
  • LEMKEN GmbH and Co. KG
  • Mahindra and Mahindra Ltd.
  • SDF SpA
  • Sonalika International Tractors
  • Weichei Lovol Heavy Industry
  • Yanmar Holdings Co. Ltd.

Qualitative and quantitative analysis of companies has been conducted to help clients understand the wider business environment as well as the strengths and weaknesses of key industry players. Data is qualitatively analyzed to categorize companies as pure play, category-focused, industry-focused, and diversified; it is quantitatively analyzed to categorize companies as dominant, leading, strong, tentative, and weak.

Recent Development and News in Agricultural machinery market

  • In January 2025, Deere and Co. unveiled its second-generation autonomy kit at the Consumer Electronics Show, featuring advanced computer vision and AI to enable autonomous tillage operations and address agricultural labor shortages.
  • In March 2025, the Brazilian government, in partnership with Embrapa, launched the SustainAgro Machinery Program to provide preferential financing for machinery that meets stringent criteria for sustainable intensification and compatibility with regenerative agriculture.
  • In April 2025, a consortium of US universities, with funding from the USDA, initiated the Digital Farmhand Project, a research program focused on developing modular, cost-effective robotic solutions for labor-intensive tasks in specialty crop production.
  • In May 2025, the International Rice Research Institute launched the Mekong Rice Mechanization Initiative, a program to develop and distribute a new generation of small-scale, smart agricultural machinery, including a multi-purpose robotic platform, for rice cultivation.

Dive into Technavio’s robust research methodology, blending expert interviews, extensive data synthesis, and validated models for unparalleled Agricultural Machinery Market insights. See full methodology.

Market Scope
Page number 313
Base year 2025
Historic period 2020-2024
Forecast period 2026-2030
Growth momentum & CAGR Accelerate at a CAGR of 5.8%
Market growth 2026-2030 USD 55457.8 million
Market structure Fragmented
YoY growth 2025-2026(%) 5.5%
Key countries China, India, Japan, South Korea, Australia, Indonesia, Germany, France, Italy, Spain, UK, The Netherlands, US, Canada, Mexico, Brazil, Argentina, Colombia, Saudi Arabia, Turkey, UAE, Egypt and Qatar
Competitive landscape Leading Companies, Market Positioning of Companies, Competitive Strategies, and Industry Risks

Request Free Sample

Research Analyst Overview

  • The agricultural machinery market is pivoting from a hardware-centric model to one dominated by integrated digital farming platforms. This strategic shift is compelling boardroom decisions to reallocate R&D investment toward software development and data science capabilities. The core of modern equipment, from combine harvesters and self-propelled sprayers to forage harvesters, now lies in its advanced sensor suite and connectivity.
  • Technologies like precision agriculture, including GPS guidance systems and autosteer systems, are standard, enabling data-driven farming and precise crop residue management. The frontier is now full autonomy, with unmanned agricultural vehicles and autonomous tractors moving from concept to commercial reality.
  • This evolution is driven by the need to optimize every facet of the crop cycle, utilizing everything from high-speed planting systems and no-till planters to strip tillage systems and robotic weeders. Leveraging predictive maintenance analytics through telematics can reduce unscheduled equipment downtime by over 40%, demonstrating clear ROI.
  • The integration of ISOBUS technology, automated headland turning, and machine-to-machine communication is creating a cohesive ecosystem, with fleet management solutions providing a holistic operational view. The push for sustainability is also spurring innovation in hybrid diesel-electric architecture, electrified farm equipment, and implements that support controlled traffic farming and regenerative agriculture practices, all while focusing on soil compaction reduction.

What are the Key Data Covered in this Agricultural Machinery Market Research and Growth Report?

  • What is the expected growth of the Agricultural Machinery Market between 2026 and 2030?

    • USD 55.46 billion, at a CAGR of 5.8%

  • What segmentation does the market report cover?

    • The report is segmented by Type (Tractors, Harvesting machinery, Haying machinery, Planting and fertilizing machinery, and Plowing and cultivating machinery), Application (Land development and seedbed preparation, Sowing and planting, Harvesting and threshing, and Others), Product Type (Manual, Semi-automatic, and Fully automatic) and Geography (APAC, Europe, North America, South America, Middle East and Africa)

  • Which regions are analyzed in the report?

    • APAC, Europe, North America, South America and Middle East and Africa

  • What are the key growth drivers and market challenges?

    • Increasing global population and imperative for food security, High initial cost of advanced machinery and volatility of farm income

  • Who are the major players in the Agricultural Machinery Market?

    • AGCO Corp., Agrale SA, Bucher Industries AG, China National Machinery Ltd., CLAAS KGaA, CNH Industrial NV, Daedong Corp., Deere and Co., HORSCH Maschinen GmbH, ISEKI and Co. Ltd., J C Bamford Excavators Ltd., Jiangsu Changfa Group Co. Ltd, Kubota Corp., KUHN SAS, LEMKEN GmbH and Co. KG, Mahindra and Mahindra Ltd., SDF SpA, Sonalika International Tractors, Weichei Lovol Heavy Industry and Yanmar Holdings Co. Ltd.

Market Research Insights

  • The agricultural machinery market is increasingly shaped by the adoption of data-centric service models that prioritize operational intelligence and efficiency. Widespread implementation of precision application technologies has been shown to improve input efficiency by over 20%, directly enhancing farm profitability.
  • The integration of connected farm equipment ecosystems enables advanced telematics and predictive maintenance, with some operators reporting a 30% reduction in unscheduled downtime. These digital farm management software platforms are becoming critical as agricultural data governance policies evolve.
  • Furthermore, the availability of diverse farm equipment financing options is helping to overcome the barrier of high initial investment, making advanced technology more accessible and improving the financial viability of modern farming operations.

We can help! Our analysts can customize this agricultural machinery market research report to meet your requirements.

Get in touch

1. Executive Summary

1.1 Market overview

Executive Summary - Chart on Market Overview
Executive Summary - Data Table on Market Overview
Executive Summary - Chart on Global Market Characteristics
Executive Summary - Chart on Market by Geography
Executive Summary - Chart on Market Segmentation by Type
Executive Summary - Chart on Market Segmentation by Application
Executive Summary - Chart on Market Segmentation by Product Type
Executive Summary - Chart on Incremental Growth
Executive Summary - Data Table on Incremental Growth
Executive Summary - Chart on Company Market Positioning

2. Technavio Analysis

2.1 Analysis of price sensitivity, lifecycle, customer purchase basket, adoption rates, and purchase criteria

2.2 Criticality of inputs and Factors of differentiation

Chart on Overview on criticality of inputs and factors of differentiation

2.3 Factors of disruption

Chart on Overview on factors of disruption

2.4 Impact of drivers and challenges

Chart on Impact of drivers and challenges in 2025 and 2030

3. Market Landscape

3.1 Market ecosystem

Chart on Parent Market
Data Table on - Parent Market

3.2 Market characteristics

Chart on Market characteristics analysis

3.3 Value chain analysis

Chart on Value chain analysis

4. Market Sizing

4.1 Market definition

Data Table on Offerings of companies included in the market definition

4.2 Market segment analysis

Market segments

4.3 Market size 2025

4.4 Market outlook: Forecast for 2025-2030

Chart on Global - Market size and forecast 2025-2030 ($ million)
Data Table on Global - Market size and forecast 2025-2030 ($ million)
Chart on Global Market: Year-over-year growth 2025-2030 (%)
Data Table on Global Market: Year-over-year growth 2025-2030 (%)

5. Historic Market Size

5.1 Global Agricultural Machinery Market 2020 - 2024

Historic Market Size - Data Table on Global Agricultural Machinery Market 2020 - 2024 ($ million)

5.2 Type segment analysis 2020 - 2024

Historic Market Size - Type Segment 2020 - 2024 ($ million)

5.3 Application segment analysis 2020 - 2024

Historic Market Size - Application Segment 2020 - 2024 ($ million)

5.4 Product Type segment analysis 2020 - 2024

Historic Market Size - Product Type Segment 2020 - 2024 ($ million)

5.5 Geography segment analysis 2020 - 2024

Historic Market Size - Geography Segment 2020 - 2024 ($ million)

5.6 Country segment analysis 2020 - 2024

Historic Market Size - Country Segment 2020 - 2024 ($ million)

6. Qualitative Analysis

6.1 Impact of AI on Global Agricultural Machinery Market

7. Five Forces Analysis

7.1 Five forces summary

Five forces analysis - Comparison between 2025 and 2030

7.2 Bargaining power of buyers

Bargaining power of buyers - Impact of key factors 2025 and 2030

7.3 Bargaining power of suppliers

Bargaining power of suppliers - Impact of key factors in 2025 and 2030

7.4 Threat of new entrants

Threat of new entrants - Impact of key factors in 2025 and 2030

7.5 Threat of substitutes

Threat of substitutes - Impact of key factors in 2025 and 2030

7.6 Threat of rivalry

Threat of rivalry - Impact of key factors in 2025 and 2030

7.7 Market condition

Chart on Market condition - Five forces 2025 and 2030

8. Market Segmentation by Type

8.1 Market segments

Chart on Type - Market share 2025-2030 (%)
Data Table on Type - Market share 2025-2030 (%)

8.2 Comparison by Type

Chart on Comparison by Type
Data Table on Comparison by Type

8.3 Tractors - Market size and forecast 2025-2030

Chart on Tractors - Market size and forecast 2025-2030 ($ million)
Data Table on Tractors - Market size and forecast 2025-2030 ($ million)
Chart on Tractors - Year-over-year growth 2025-2030 (%)
Data Table on Tractors - Year-over-year growth 2025-2030 (%)

8.4 Harvesting machinery - Market size and forecast 2025-2030

Chart on Harvesting machinery - Market size and forecast 2025-2030 ($ million)
Data Table on Harvesting machinery - Market size and forecast 2025-2030 ($ million)
Chart on Harvesting machinery - Year-over-year growth 2025-2030 (%)
Data Table on Harvesting machinery - Year-over-year growth 2025-2030 (%)

8.5 Haying machinery - Market size and forecast 2025-2030

Chart on Haying machinery - Market size and forecast 2025-2030 ($ million)
Data Table on Haying machinery - Market size and forecast 2025-2030 ($ million)
Chart on Haying machinery - Year-over-year growth 2025-2030 (%)
Data Table on Haying machinery - Year-over-year growth 2025-2030 (%)

8.6 Planting and fertilizing machinery - Market size and forecast 2025-2030

Chart on Planting and fertilizing machinery - Market size and forecast 2025-2030 ($ million)
Data Table on Planting and fertilizing machinery - Market size and forecast 2025-2030 ($ million)
Chart on Planting and fertilizing machinery - Year-over-year growth 2025-2030 (%)
Data Table on Planting and fertilizing machinery - Year-over-year growth 2025-2030 (%)

8.7 Plowing and cultivating machinery - Market size and forecast 2025-2030

Chart on Plowing and cultivating machinery - Market size and forecast 2025-2030 ($ million)
Data Table on Plowing and cultivating machinery - Market size and forecast 2025-2030 ($ million)
Chart on Plowing and cultivating machinery - Year-over-year growth 2025-2030 (%)
Data Table on Plowing and cultivating machinery - Year-over-year growth 2025-2030 (%)

8.8 Market opportunity by Type

Market opportunity by Type ($ million)
Data Table on Market opportunity by Type ($ million)

9. Market Segmentation by Application

9.1 Market segments

Chart on Application - Market share 2025-2030 (%)
Data Table on Application - Market share 2025-2030 (%)

9.2 Comparison by Application

Chart on Comparison by Application
Data Table on Comparison by Application

9.3 Land development and seedbed preparation - Market size and forecast 2025-2030

Chart on Land development and seedbed preparation - Market size and forecast 2025-2030 ($ million)
Data Table on Land development and seedbed preparation - Market size and forecast 2025-2030 ($ million)
Chart on Land development and seedbed preparation - Year-over-year growth 2025-2030 (%)
Data Table on Land development and seedbed preparation - Year-over-year growth 2025-2030 (%)

9.4 Sowing and planting - Market size and forecast 2025-2030

Chart on Sowing and planting - Market size and forecast 2025-2030 ($ million)
Data Table on Sowing and planting - Market size and forecast 2025-2030 ($ million)
Chart on Sowing and planting - Year-over-year growth 2025-2030 (%)
Data Table on Sowing and planting - Year-over-year growth 2025-2030 (%)

9.5 Harvesting and threshing - Market size and forecast 2025-2030

Chart on Harvesting and threshing - Market size and forecast 2025-2030 ($ million)
Data Table on Harvesting and threshing - Market size and forecast 2025-2030 ($ million)
Chart on Harvesting and threshing - Year-over-year growth 2025-2030 (%)
Data Table on Harvesting and threshing - Year-over-year growth 2025-2030 (%)

9.6 Others - Market size and forecast 2025-2030

Chart on Others - Market size and forecast 2025-2030 ($ million)
Data Table on Others - Market size and forecast 2025-2030 ($ million)
Chart on Others - Year-over-year growth 2025-2030 (%)
Data Table on Others - Year-over-year growth 2025-2030 (%)

9.7 Market opportunity by Application

Market opportunity by Application ($ million)
Data Table on Market opportunity by Application ($ million)

10. Market Segmentation by Product Type

10.1 Market segments

Chart on Product Type - Market share 2025-2030 (%)
Data Table on Product Type - Market share 2025-2030 (%)

10.2 Comparison by Product Type

Chart on Comparison by Product Type
Data Table on Comparison by Product Type

10.3 Manual - Market size and forecast 2025-2030

Chart on Manual - Market size and forecast 2025-2030 ($ million)
Data Table on Manual - Market size and forecast 2025-2030 ($ million)
Chart on Manual - Year-over-year growth 2025-2030 (%)
Data Table on Manual - Year-over-year growth 2025-2030 (%)

10.4 Semi-automatic - Market size and forecast 2025-2030

Chart on Semi-automatic - Market size and forecast 2025-2030 ($ million)
Data Table on Semi-automatic - Market size and forecast 2025-2030 ($ million)
Chart on Semi-automatic - Year-over-year growth 2025-2030 (%)
Data Table on Semi-automatic - Year-over-year growth 2025-2030 (%)

10.5 Fully automatic - Market size and forecast 2025-2030

Chart on Fully automatic - Market size and forecast 2025-2030 ($ million)
Data Table on Fully automatic - Market size and forecast 2025-2030 ($ million)
Chart on Fully automatic - Year-over-year growth 2025-2030 (%)
Data Table on Fully automatic - Year-over-year growth 2025-2030 (%)

10.6 Market opportunity by Product Type

Market opportunity by Product Type ($ million)
Data Table on Market opportunity by Product Type ($ million)

11. Customer Landscape

11.1 Customer landscape overview

Analysis of price sensitivity, lifecycle, customer purchase basket, adoption rates, and purchase criteria

12. Geographic Landscape

12.1 Geographic segmentation

Chart on Market share by geography 2025-2030 (%)
Data Table on Market share by geography 2025-2030 (%)

12.2 Geographic comparison

Chart on Geographic comparison
Data Table on Geographic comparison

12.3 APAC - Market size and forecast 2025-2030

Chart on APAC - Market size and forecast 2025-2030 ($ million)
Data Table on APAC - Market size and forecast 2025-2030 ($ million)
Chart on APAC - Year-over-year growth 2025-2030 (%)
Data Table on APAC - Year-over-year growth 2025-2030 (%)
Chart on Regional Comparison - APAC
Data Table on Regional Comparison - APAC

12.3.1 China - Market size and forecast 2025-2030

Chart on China - Market size and forecast 2025-2030 ($ million)
Data Table on China - Market size and forecast 2025-2030 ($ million)
Chart on China - Year-over-year growth 2025-2030 (%)
Data Table on China - Year-over-year growth 2025-2030 (%)

12.3.2 India - Market size and forecast 2025-2030

Chart on India - Market size and forecast 2025-2030 ($ million)
Data Table on India - Market size and forecast 2025-2030 ($ million)
Chart on India - Year-over-year growth 2025-2030 (%)
Data Table on India - Year-over-year growth 2025-2030 (%)

12.3.3 Japan - Market size and forecast 2025-2030

Chart on Japan - Market size and forecast 2025-2030 ($ million)
Data Table on Japan - Market size and forecast 2025-2030 ($ million)
Chart on Japan - Year-over-year growth 2025-2030 (%)
Data Table on Japan - Year-over-year growth 2025-2030 (%)

12.3.4 South Korea - Market size and forecast 2025-2030

Chart on South Korea - Market size and forecast 2025-2030 ($ million)
Data Table on South Korea - Market size and forecast 2025-2030 ($ million)
Chart on South Korea - Year-over-year growth 2025-2030 (%)
Data Table on South Korea - Year-over-year growth 2025-2030 (%)

12.3.5 Australia - Market size and forecast 2025-2030

Chart on Australia - Market size and forecast 2025-2030 ($ million)
Data Table on Australia - Market size and forecast 2025-2030 ($ million)
Chart on Australia - Year-over-year growth 2025-2030 (%)
Data Table on Australia - Year-over-year growth 2025-2030 (%)

12.3.6 Indonesia - Market size and forecast 2025-2030

Chart on Indonesia - Market size and forecast 2025-2030 ($ million)
Data Table on Indonesia - Market size and forecast 2025-2030 ($ million)
Chart on Indonesia - Year-over-year growth 2025-2030 (%)
Data Table on Indonesia - Year-over-year growth 2025-2030 (%)

12.4 Europe - Market size and forecast 2025-2030

Chart on Europe - Market size and forecast 2025-2030 ($ million)
Data Table on Europe - Market size and forecast 2025-2030 ($ million)
Chart on Europe - Year-over-year growth 2025-2030 (%)
Data Table on Europe - Year-over-year growth 2025-2030 (%)
Chart on Regional Comparison - Europe
Data Table on Regional Comparison - Europe

12.4.1 Germany - Market size and forecast 2025-2030

Chart on Germany - Market size and forecast 2025-2030 ($ million)
Data Table on Germany - Market size and forecast 2025-2030 ($ million)
Chart on Germany - Year-over-year growth 2025-2030 (%)
Data Table on Germany - Year-over-year growth 2025-2030 (%)

12.4.2 France - Market size and forecast 2025-2030

Chart on France - Market size and forecast 2025-2030 ($ million)
Data Table on France - Market size and forecast 2025-2030 ($ million)
Chart on France - Year-over-year growth 2025-2030 (%)
Data Table on France - Year-over-year growth 2025-2030 (%)

12.4.3 Italy - Market size and forecast 2025-2030

Chart on Italy - Market size and forecast 2025-2030 ($ million)
Data Table on Italy - Market size and forecast 2025-2030 ($ million)
Chart on Italy - Year-over-year growth 2025-2030 (%)
Data Table on Italy - Year-over-year growth 2025-2030 (%)

12.4.4 Spain - Market size and forecast 2025-2030

Chart on Spain - Market size and forecast 2025-2030 ($ million)
Data Table on Spain - Market size and forecast 2025-2030 ($ million)
Chart on Spain - Year-over-year growth 2025-2030 (%)
Data Table on Spain - Year-over-year growth 2025-2030 (%)

12.4.5 UK - Market size and forecast 2025-2030

Chart on UK - Market size and forecast 2025-2030 ($ million)
Data Table on UK - Market size and forecast 2025-2030 ($ million)
Chart on UK - Year-over-year growth 2025-2030 (%)
Data Table on UK - Year-over-year growth 2025-2030 (%)

12.4.6 The Netherlands - Market size and forecast 2025-2030

Chart on The Netherlands - Market size and forecast 2025-2030 ($ million)
Data Table on The Netherlands - Market size and forecast 2025-2030 ($ million)
Chart on The Netherlands - Year-over-year growth 2025-2030 (%)
Data Table on The Netherlands - Year-over-year growth 2025-2030 (%)

12.5 North America - Market size and forecast 2025-2030

Chart on North America - Market size and forecast 2025-2030 ($ million)
Data Table on North America - Market size and forecast 2025-2030 ($ million)
Chart on North America - Year-over-year growth 2025-2030 (%)
Data Table on North America - Year-over-year growth 2025-2030 (%)
Chart on Regional Comparison - North America
Data Table on Regional Comparison - North America

12.5.1 US - Market size and forecast 2025-2030

Chart on US - Market size and forecast 2025-2030 ($ million)
Data Table on US - Market size and forecast 2025-2030 ($ million)
Chart on US - Year-over-year growth 2025-2030 (%)
Data Table on US - Year-over-year growth 2025-2030 (%)

12.5.2 Canada - Market size and forecast 2025-2030

Chart on Canada - Market size and forecast 2025-2030 ($ million)
Data Table on Canada - Market size and forecast 2025-2030 ($ million)
Chart on Canada - Year-over-year growth 2025-2030 (%)
Data Table on Canada - Year-over-year growth 2025-2030 (%)

12.5.3 Mexico - Market size and forecast 2025-2030

Chart on Mexico - Market size and forecast 2025-2030 ($ million)
Data Table on Mexico - Market size and forecast 2025-2030 ($ million)
Chart on Mexico - Year-over-year growth 2025-2030 (%)
Data Table on Mexico - Year-over-year growth 2025-2030 (%)

12.6 South America - Market size and forecast 2025-2030

Chart on South America - Market size and forecast 2025-2030 ($ million)
Data Table on South America - Market size and forecast 2025-2030 ($ million)
Chart on South America - Year-over-year growth 2025-2030 (%)
Data Table on South America - Year-over-year growth 2025-2030 (%)
Chart on Regional Comparison - South America
Data Table on Regional Comparison - South America

12.6.1 Brazil - Market size and forecast 2025-2030

Chart on Brazil - Market size and forecast 2025-2030 ($ million)
Data Table on Brazil - Market size and forecast 2025-2030 ($ million)
Chart on Brazil - Year-over-year growth 2025-2030 (%)
Data Table on Brazil - Year-over-year growth 2025-2030 (%)

12.6.2 Argentina - Market size and forecast 2025-2030

Chart on Argentina - Market size and forecast 2025-2030 ($ million)
Data Table on Argentina - Market size and forecast 2025-2030 ($ million)
Chart on Argentina - Year-over-year growth 2025-2030 (%)
Data Table on Argentina - Year-over-year growth 2025-2030 (%)

12.6.3 Colombia - Market size and forecast 2025-2030

Chart on Colombia - Market size and forecast 2025-2030 ($ million)
Data Table on Colombia - Market size and forecast 2025-2030 ($ million)
Chart on Colombia - Year-over-year growth 2025-2030 (%)
Data Table on Colombia - Year-over-year growth 2025-2030 (%)

12.7 Middle East and Africa - Market size and forecast 2025-2030

Chart on Middle East and Africa - Market size and forecast 2025-2030 ($ million)
Data Table on Middle East and Africa - Market size and forecast 2025-2030 ($ million)
Chart on Middle East and Africa - Year-over-year growth 2025-2030 (%)
Data Table on Middle East and Africa - Year-over-year growth 2025-2030 (%)
Chart on Regional Comparison - Middle East and Africa
Data Table on Regional Comparison - Middle East and Africa

12.7.1 Saudi Arabia - Market size and forecast 2025-2030

Chart on Saudi Arabia - Market size and forecast 2025-2030 ($ million)
Data Table on Saudi Arabia - Market size and forecast 2025-2030 ($ million)
Chart on Saudi Arabia - Year-over-year growth 2025-2030 (%)
Data Table on Saudi Arabia - Year-over-year growth 2025-2030 (%)

12.7.2 Turkey - Market size and forecast 2025-2030

Chart on Turkey - Market size and forecast 2025-2030 ($ million)
Data Table on Turkey - Market size and forecast 2025-2030 ($ million)
Chart on Turkey - Year-over-year growth 2025-2030 (%)
Data Table on Turkey - Year-over-year growth 2025-2030 (%)

12.7.3 UAE - Market size and forecast 2025-2030

Chart on UAE - Market size and forecast 2025-2030 ($ million)
Data Table on UAE - Market size and forecast 2025-2030 ($ million)
Chart on UAE - Year-over-year growth 2025-2030 (%)
Data Table on UAE - Year-over-year growth 2025-2030 (%)

12.7.4 Egypt - Market size and forecast 2025-2030

Chart on Egypt - Market size and forecast 2025-2030 ($ million)
Data Table on Egypt - Market size and forecast 2025-2030 ($ million)
Chart on Egypt - Year-over-year growth 2025-2030 (%)
Data Table on Egypt - Year-over-year growth 2025-2030 (%)

12.7.5 Qatar - Market size and forecast 2025-2030

Chart on Qatar - Market size and forecast 2025-2030 ($ million)
Data Table on Qatar - Market size and forecast 2025-2030 ($ million)
Chart on Qatar - Year-over-year growth 2025-2030 (%)
Data Table on Qatar - Year-over-year growth 2025-2030 (%)

12.8 Market opportunity by geography

Market opportunity by geography ($ million)
Data Tables on Market opportunity by geography ($ million)

13. Drivers, Challenges, and Opportunity

13.1 Market drivers

Increasing global population and imperative for food security
Technological advancements and widespread adoption of precision agriculture
Pervasive agricultural labor shortages and increasing labor costs

13.2 Market challenges

High initial cost of advanced machinery and volatility of farm income
Navigating complex and divergent global regulatory landscape
Land fragmentation and prevalence of small-scale farming

13.3 Impact of drivers and challenges

Impact of drivers and challenges in 2025 and 2030

13.4 Market opportunities

Rise of electrification and alternative propulsion systems
Evolution from equipment sales to data centric service models
Accelerating path toward full autonomy and robotics

14. Competitive Landscape

14.1 Overview

14.2

Overview on criticality of inputs and factors of differentiation

14.3 Landscape disruption

Overview on factors of disruption

14.4 Industry risks

Impact of key risks on business

15. Competitive Analysis

15.1 Companies profiled

Companies covered

15.2 Company ranking index

15.3 Market positioning of companies

Matrix on companies position and classification

15.4 AGCO Corp.

AGCO Corp. - Overview
AGCO Corp. - Business segments
AGCO Corp. - Key news
AGCO Corp. - Key offerings
AGCO Corp. - Segment focus
SWOT

15.5 Agrale SA

Agrale SA - Overview
Agrale SA - Product / Service
Agrale SA - Key offerings
SWOT

15.6 Bucher Industries AG

Bucher Industries AG - Overview
Bucher Industries AG - Business segments
Bucher Industries AG - Key offerings
Bucher Industries AG - Segment focus
SWOT

15.7 China National Machinery Ltd.

China National Machinery Ltd. - Overview
China National Machinery Ltd. - Product / Service
China National Machinery Ltd. - Key offerings
SWOT

15.8 CLAAS KGaA

CLAAS KGaA - Overview
CLAAS KGaA - Product / Service
CLAAS KGaA - Key offerings
SWOT

15.9 CNH Industrial NV

CNH Industrial NV - Overview
CNH Industrial NV - Business segments
CNH Industrial NV - Key offerings
CNH Industrial NV - Segment focus
SWOT

15.10 Daedong Corp.

Daedong Corp. - Overview
Daedong Corp. - Product / Service
Daedong Corp. - Key offerings
SWOT

15.11 Deere and Co.

Deere and Co. - Overview
Deere and Co. - Business segments
Deere and Co. - Key news
Deere and Co. - Key offerings
Deere and Co. - Segment focus
SWOT

15.12 HORSCH Maschinen GmbH

HORSCH Maschinen GmbH - Overview
HORSCH Maschinen GmbH - Product / Service
HORSCH Maschinen GmbH - Key offerings
SWOT

15.13 Jiangsu Changfa Group Co. Ltd

Jiangsu Changfa Group Co. Ltd - Overview
Jiangsu Changfa Group Co. Ltd - Product / Service
Jiangsu Changfa Group Co. Ltd - Key offerings
SWOT

15.14 Kubota Corp.

Kubota Corp. - Overview
Kubota Corp. - Business segments
Kubota Corp. - Key offerings
Kubota Corp. - Segment focus
SWOT

15.15 KUHN SAS

KUHN SAS - Overview
KUHN SAS - Product / Service
KUHN SAS - Key offerings
SWOT

15.16 LEMKEN GmbH and Co. KG

LEMKEN GmbH and Co. KG - Overview
LEMKEN GmbH and Co. KG - Product / Service
LEMKEN GmbH and Co. KG - Key offerings
SWOT

15.17 Mahindra and Mahindra Ltd.

Mahindra and Mahindra Ltd. - Overview
Mahindra and Mahindra Ltd. - Business segments
Mahindra and Mahindra Ltd. - Key news
Mahindra and Mahindra Ltd. - Key offerings
Mahindra and Mahindra Ltd. - Segment focus
SWOT

15.18 Sonalika International Tractors

Sonalika International Tractors - Overview
Sonalika International Tractors - Product / Service
Sonalika International Tractors - Key offerings
SWOT

16. Appendix

16.1 Scope of the report

Market definition
Objectives
Notes and caveats

16.2 Inclusions and exclusions checklist

Inclusions checklist
Exclusions checklist

16.3 Currency conversion rates for US$

16.4 Research methodology

16.5 Data procurement

Information sources

16.6 Data validation

16.7 Validation techniques employed for market sizing

16.8 Data synthesis

16.9 360 degree market analysis

16.10 List of abbreviations

Research Methodology

Technavio presents a detailed picture of the market by way of study, synthesis, and summation of data from multiple sources. The analysts have presented the various facets of the market with a particular focus on identifying the key industry influencers. The data thus presented is comprehensive, reliable, and the result of extensive research, both primary and secondary.

INFORMATION SOURCES

Primary sources

  • Manufacturers and suppliers
  • Channel partners
  • Industry experts
  • Strategic decision makers

Secondary sources

  • Industry journals and periodicals
  • Government data
  • Financial reports of key industry players
  • Historical data
  • Press releases

DATA ANALYSIS

Data Synthesis

  • Collation of data
  • Estimation of key figures
  • Analysis of derived insights

Data Validation

  • Triangulation with data models
  • Reference against proprietary databases
  • Corroboration with industry experts

REPORT WRITING

Qualitative

  • Market drivers
  • Market challenges
  • Market trends
  • Five forces analysis

Quantitative

  • Market size and forecast
  • Market segmentation
  • Geographical insights
  • Competitive landscape

Interested in this report?

Get your sample now to see our research methodology and insights!

Download Now

Frequently Asked Questions

Agricultural Machinery market growth will increase by USD 55457.8 million during 2026-2030.

The Agricultural Machinery market is expected to grow at a CAGR of 5.8% during 2026-2030.

Agricultural Machinery market is segmented by Type (Tractors, Harvesting machinery, Haying machinery, Planting and fertilizing machinery, Plowing and cultivating machinery) Application (Land development and seedbed preparation, Sowing and planting, Harvesting and threshing, Others) Product type (Manual, Semi-automatic, Fully automatic)

AGCO Corp., Agrale SA, Bucher Industries AG, China National Machinery Ltd., CLAAS KGaA, CNH Industrial NV, Daedong Corp., Deere and Co., HORSCH Maschinen GmbH, ISEKI and Co. Ltd., J C Bamford Excavators Ltd., Jiangsu Changfa Group Co. Ltd, Kubota Corp., KUHN SAS, LEMKEN GmbH and Co. KG, Mahindra and Mahindra Ltd., SDF SpA, Sonalika International Tractors, Weichei Lovol Heavy Industry, Yanmar Holdings Co. Ltd. are a few of the key vendors in the Agricultural Machinery market.

APAC will register the highest growth rate of 36.4% among the other regions. Therefore, the Agricultural Machinery market in APAC is expected to garner significant business opportunities for the vendors during the forecast period.

China, India, Japan, South Korea, Australia, Indonesia, Germany, France, Italy, Spain, UK, The Netherlands, US, Canada, Mexico, Brazil, Argentina, Colombia, Saudi Arabia, Turkey, UAE, Egypt, Qatar

  • Increasing global population and imperative for food security is the driving factor this market.

The Agricultural Machinery market vendors should focus on grabbing business opportunities from the Type segment as it accounted for the largest market share in the base year.