Rubber Market Size 2023-2027
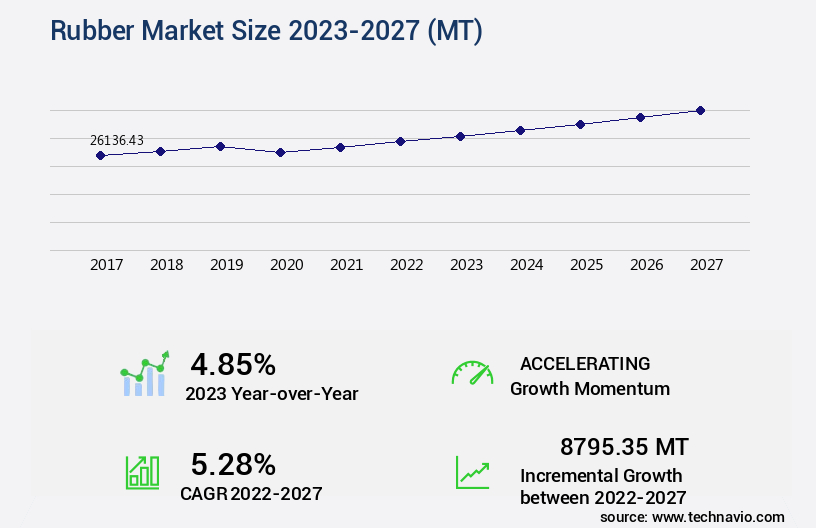
The rubber market size is valued to increase by 8795.35 MT, at a CAGR of 5.28% from 2022 to 2027. Increasing demand from the automotive industry will drive the rubber market.
Major Market Trends & Insights
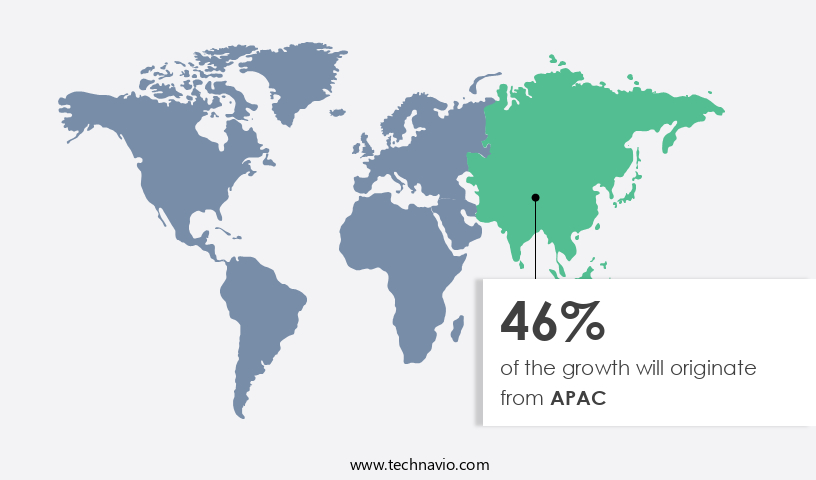
- APAC dominated the market and accounted for a 46% growth during the forecast period.
- By Application - Tires segment was valued at 16887.01 MT in 2021
- By Type - Synthetic rubber segment accounted for the largest market revenue share in 2021
Market Size & Forecast
- Market Opportunities: 48.32 MT
- Market Future Opportunities: 8795.35 MT
- CAGR from 2022 to 2027 : 5.28%
Market Summary
- The market is a significant economic force, with an estimated value of USD150 billion in 2021. This sector's expansion is driven by the increasing demand for rubber products in various industries, including automotive, construction, and consumer goods. The automotive industry's growth, in particular, is a critical factor, as rubber components are essential for vehicle manufacturing, from tires and belts to seals and gaskets. Another trend shaping the market is the rising popularity of bio-adhesives, which offer environmental benefits and reduced reliance on fossil fuels.
- However, the industry faces challenges, such as stringent regulations for rubber manufacturing, which aim to minimize environmental impact and ensure product safety. These regulations necessitate continuous innovation and adaptation by market participants. Despite these challenges, the market's future remains promising, with opportunities for growth in emerging economies and the development of advanced rubber technologies.
What will be the Size of the Rubber Market during the forecast period?
Get Key Insights on Market Forecast (PDF) Request Free Sample
How is the Rubber Market Segmented ?
The rubber industry research report provides comprehensive data (region-wise segment analysis), with forecasts and estimates in "USD MT" for the period 2023-2027, as well as historical data from 2017-2021 for the following segments.
- Application
- Tires
- Non-tires
- Type
- Synthetic rubber
- Natural rubber
- Reclaimed Rubber
- End-use Industry
- Automotive
- Construction
- Consumer Goods
- Geography
- North America
- US
- Canada
- Europe
- France
- Germany
- Italy
- UK
- Middle East and Africa
- Egypt
- KSA
- Oman
- UAE
- APAC
- China
- India
- Japan
- South America
- Argentina
- Brazil
- Rest of World (ROW)
- North America
By Application Insights
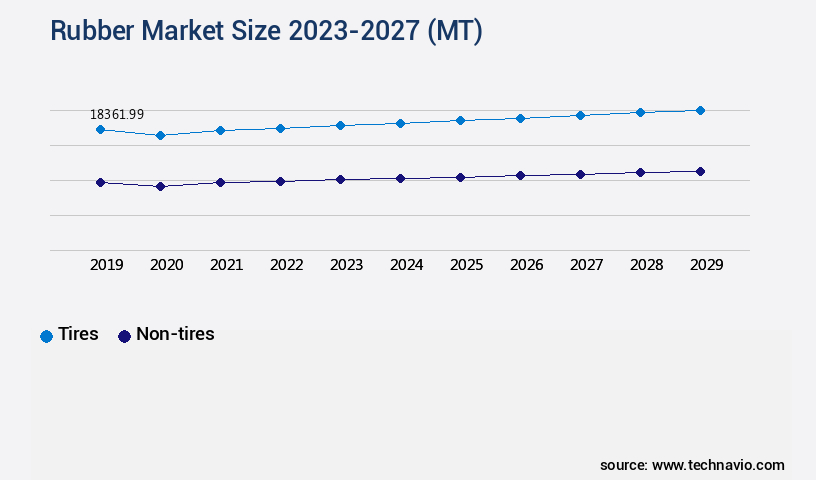
The tires segment is estimated to witness significant growth during the forecast period.
The market encompasses a dynamic and evolving industry, with ongoing research and development shaping its future. Rubber's versatility is showcased in various applications, from tire manufacturing to industrial uses. In the automotive sector, tires undergo rigorous testing to ensure elasticity, resistance to wear and tear, and optimal performance. Chemical resistance testing, elastic modulus measurement, and glass transition temperature analysis are integral parts of this process. Tire compounds, such as those with high rebound resilience and excellent compression set resistance, are produced through meticulous curing temperature control and crystallinity analysis. These compounds may include tire tread formulations, which exhibit unique stress-strain behavior and shore hardness.
To ensure longevity, rubber's aging behavior is characterized through dynamic mechanical analysis, thermal degradation analysis, and creep behavior analysis. The calendering process efficiency, polymer chain length, and filler dispersion methods are crucial for optimizing production. Natural rubber latex and synthetic rubber types, like polybutadiene, undergo dynamic properties measurement and molding process parameter adjustments. Polymer blending techniques and extrusion process optimization are employed to enhance rubber's elastomer properties, including ozone resistance, fatigue resistance, and weathering resistance. The tire industry's relentless pursuit of innovation has led to advancements in rubber technology, with the global market for automobile tires projected to grow by over 6% annually.
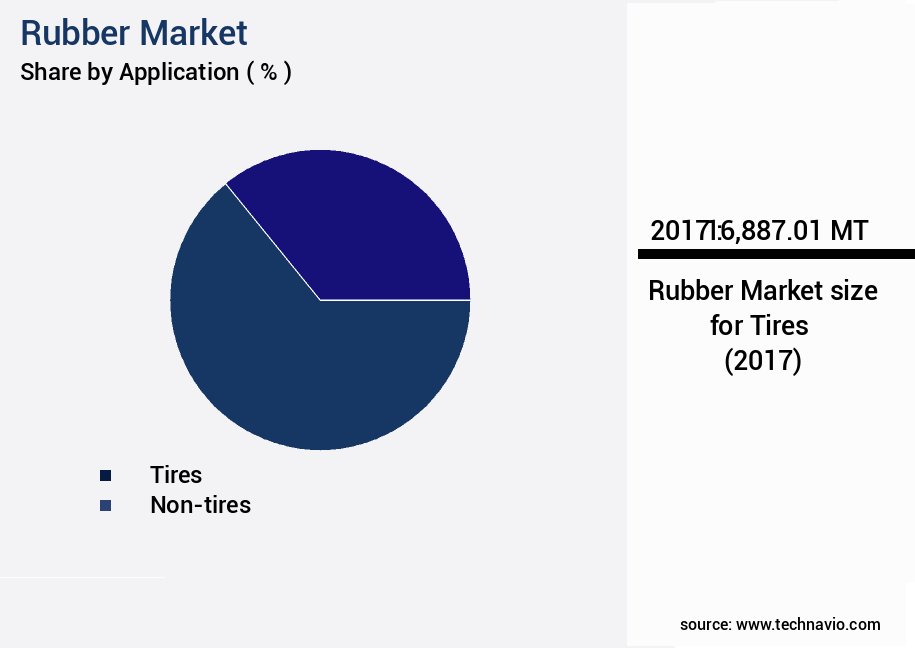
The Tires segment was valued at USD 16887.01 MT in 2017 and showed a gradual increase during the forecast period.
Regional Analysis
APAC is estimated to contribute 46% to the growth of the global market during the forecast period.Technavio's analysts have elaborately explained the regional trends and drivers that shape the market during the forecast period.
See How Rubber Market Demand is Rising in APAC Request Free Sample
The market experienced significant growth in 2022, with APAC emerging as the largest producer and consumer region. China, India, and Japan were the primary contributors to the market's revenue in APAC that year. This trend is attributed to the escalating demand for rubber in processing and end-user industries, such as automotive, construction, oil and gas, and aerospace, particularly in developing countries like China, Japan, and India.
In India alone, natural rubber was utilized to manufacture approximately 0.6 million metric tons in 2022. The burgeoning economies in APAC are anticipated to continue fueling the demand for rubber during the forecast period.
Market Dynamics
Our researchers analyzed the data with 2022 as the base year, along with the key drivers, trends, and challenges. A holistic analysis of drivers will help companies refine their marketing strategies to gain a competitive advantage.
The market is a dynamic and diverse industry, encompassing a wide range of applications and product types. One of the key factors driving innovation in this sector is the ongoing research and development of new rubber compounds and processing techniques. For instance, the effect of crosslinking on rubber properties continues to be a topic of great interest, as this process significantly influences the final performance of the material. Another critical aspect of rubber manufacturing is the influence of filler type on rubber performance. By optimizing curing parameters and carefully selecting fillers, manufacturers can achieve desirable properties such as improved durability, enhanced elasticity, and increased resistance to temperature extremes.
In the realm of rubber testing and analysis, there is a growing emphasis on the measurement of dynamic mechanical properties and the assessment of stress-strain behavior for various rubber types. This data is essential for predicting rubber service life and designing experiments for rubber formulations. Moreover, the determination of rubber compounds' thermal stability and evaluation of their resistance to aging are crucial aspects of ensuring product quality and longevity. Furthermore, the investigation of rubber processing techniques, such as rheological modeling and simulation of rubber processing operations, plays a vital role in optimizing production efficiency and reducing waste. Characterization of rubber using spectroscopic methods and microscopic analysis of rubber microstructure provide valuable insights into material composition and structure, enabling the development of advanced rubber processing technologies.
Sustainable rubber production methods and recycling and reuse of rubber waste are increasingly important considerations in the industry. In fact, more than half of all rubber manufacturers have integrated some form of waste reduction strategy into their operations. This trend reflects the growing recognition of the environmental impact of rubber production and the potential for circular economy solutions. The competition in the market is fierce, with numerous players vying for market share. However, innovation and differentiation remain key drivers of success. For instance, some companies are focusing on the development of novel rubber materials with enhanced properties, while others are investing in advanced rubber processing technologies to improve efficiency and reduce costs.
In terms of regional trends, there is a noticeable shift towards Asia Pacific as a major hub for rubber production and consumption. Adoption rates for new rubber technologies in this region are nearly double those in Europe and North America, driven by factors such as lower labor costs and a more favorable regulatory environment. In conclusion, the market is a dynamic and evolving industry, characterized by ongoing research and development, a focus on sustainability, and regional market trends. By staying abreast of the latest innovations and trends, businesses can position themselves for success in this competitive landscape.
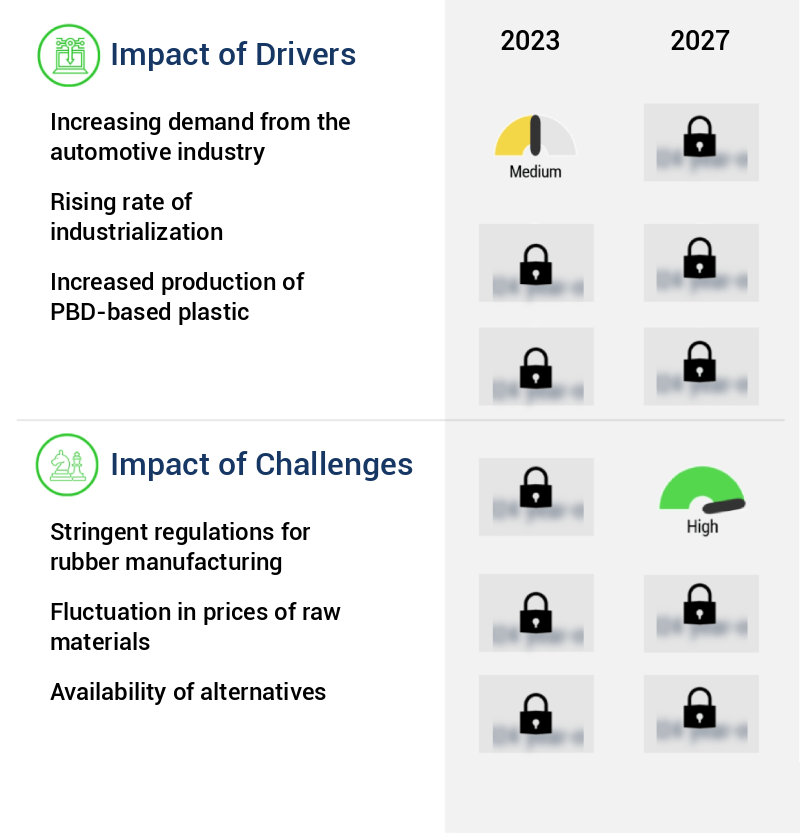
What are the key market drivers leading to the rise in the adoption of Rubber Industry?
- The automotive industry's escalating demand serves as the primary catalyst for market growth.
- The automotive industry represents a significant consumer in the global PBD the market, accounting for a substantial share in terms of consumption. This elastomer's unique properties, including high resilience, superior abrasion resistance, and increased cut growth resistance, make it an ideal choice for tire production. Approximately 70% of PBD rubber is utilized in the manufacture of tire treads and sidewalls. The volatility in natural rubber prices has driven tire manufacturers to substitute it with cost-effective alternatives like PBD rubber. The automotive sector's continuous quest for enhanced tire performance and durability further fuels the demand for PBD rubber in this industry.
- The application scope of PBD rubber extends beyond tires, with its usage in various automotive components such as engine mounts, suspension bushings, and power steering hoses. The evolving automotive industry trends, including the increasing adoption of electric vehicles and autonomous driving technology, are expected to present new opportunities for PBD rubber in the coming years.
What are the market trends shaping the Rubber Industry?
- The trend toward increasing popularity lies in the use of bio-adhesives within the market.
- Bio-adhesives, derived from natural polymeric substances, serve as essential adhesives for bonding various materials. Unlike traditional adhesives, bio-adhesives are devoid of formaldehyde and originate from renewable plant or animal resources. The global bio-adhesives market demonstrates significant expansion, with growth driven by the low volatile organic compound (VOC) content compared to petrochemical-based adhesives. This attribute is increasingly attracting industries seeking sustainable alternatives. Government policies supporting bio-adhesives in consumer and industrial applications further fuel market growth. Regulatory bodies, such as the European Union (EU) and the Food and Drug Administration (FDA), have enacted stringent regulations to minimize synthetic adhesive consumption, particularly in food contact materials.
- Consequently, the bio-adhesives market is poised to flourish in sectors like food and beverage packaging. The advantages of bio-adhesives extend beyond sustainability. Their biodegradability and biocompatibility make them suitable for various applications, including medical devices, textiles, and construction materials. The market's continuous evolution reflects the ongoing quest for eco-friendly alternatives, making bio-adhesives a promising solution for industries striving to minimize their environmental footprint.
What challenges does the Rubber Industry face during its growth?
- The stringent regulations governing rubber manufacturing pose a significant challenge to the industry's growth trajectory. In order to comply with these regulations, rubber manufacturers must invest heavily in research and development, as well as implement advanced production processes and technologies. This not only increases operational costs but also hinders the industry's ability to remain competitive on a global scale. Therefore, finding a balance between adhering to regulatory requirements and maintaining profitability is a critical issue that the rubber industry must address to ensure sustainable growth.
- The market is shaped by stringent regulations aimed at reducing the emission of hazardous fumes from rubber factories. These regulations impact the production process, particularly in petrochemical plants, which convert base petrochemical products into polybutadiene rubber (PBD). The creation of PBD involves the processing of propylene, ethylene, butylene, and butadiene. The emission of ethylene and propylene, derived from petrochemical plants through cracking processes, is a significant concern due to the formation of toxic oxides upon release into the atmosphere. Butadiene, a carcinogenic chemical, may also be present in emissions. A naphtha cracker at a petrochemical complex can release numerous alkenes annually, including propylene and ethylene.
- Despite these challenges, the rubber industry continues to evolve, with advancements in technology and production methods aimed at minimizing emissions and improving overall sustainability. The market's dynamics are influenced by various factors, including regulatory compliance, technological advancements, and shifting consumer preferences. The rubber industry's ongoing transformation underscores its importance in various sectors, from automotive to healthcare and beyond.
Exclusive Technavio Analysis on Customer Landscape
The rubber market forecasting report includes the adoption lifecycle of the market, covering from the innovator's stage to the laggard's stage. It focuses on adoption rates in different regions based on penetration. Furthermore, the rubber market report also includes key purchase criteria and drivers of price sensitivity to help companies evaluate and develop their market growth analysis strategies.
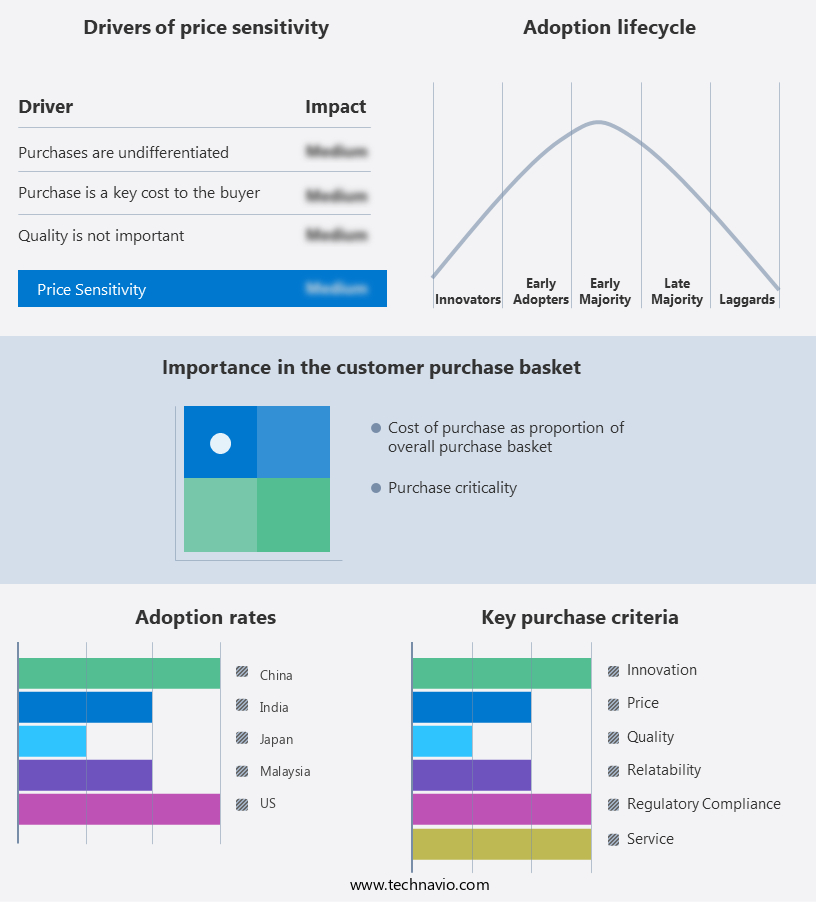
Customer Landscape of Rubber Industry
Competitive Landscape
Companies are implementing various strategies, such as strategic alliances, rubber market forecast, partnerships, mergers and acquisitions, geographical expansion, and product/service launches, to enhance their presence in the industry.
BASF SE - This company specializes in the production of rubber-coated fabrics, engineered for various applications. These fabrics provide robust abrasion resistance, effective barrier protection, superior air retention, and impressive flex resistance. Additionally, they exhibit resistance to chemical gases and fuels, making them a versatile solution for diverse industries.
The industry research and growth report includes detailed analyses of the competitive landscape of the market and information about key companies, including:
- BASF SE
- Bridgestone Corporation
- Continental AG
- Dow Inc.
- Evonik Industries
- ExxonMobil Chemical
- Goodyear Tire & Rubber Company
- Hankook Tire
- Kumho Tire
- Lanxess AG
- LG Chem
- Michelin
- Pirelli & C. S.p.A.
- SABIC
- Sinopec
- Solvay S.A.
- Sumitomo Rubber Industries
- Toyo Tire Corporation
- Trelleborg AB
- Yokohama Rubber Co., Ltd.
Qualitative and quantitative analysis of companies has been conducted to help clients understand the wider business environment as well as the strengths and weaknesses of key industry players. Data is qualitatively analyzed to categorize companies as pure play, category-focused, industry-focused, and diversified; it is quantitatively analyzed to categorize companies as dominant, leading, strong, tentative, and weak.
Recent Development and News in Rubber Market
- In January 2024, global rubber producer, Bridgestone Corporation, announced the launch of its new eco-friendly tire, the "EcoPia," made from recycled rubber and soybean oil. This innovative product, which reduces carbon emissions by 20% compared to traditional tires, marks Bridgestone's commitment to sustainability (Bridgestone Corporation Press Release, 2024).
- In March 2024, major rubber suppliers, Goodyear Tire & Rubber Company and Michelin, entered into a strategic partnership to develop advanced tire technologies, aiming to increase their market share in the high-performance tire segment (Goodyear Tire & Rubber Company Press Release, 2024).
- In May 2024, Chinese rubber manufacturer, Qingdao Dongyu Rubber Co. Ltd., secured a USD500 million investment from a consortium led by BlackRock and Temasek Holdings to expand its production capacity and global presence (Reuters, 2024).
- In February 2025, the European Union approved the "Circular Economy Action Plan," which includes measures to increase the use of recycled rubber in tires and other applications, providing significant growth opportunities for the market participants (European Commission Press Release, 2025).
Dive into Technavio's robust research methodology, blending expert interviews, extensive data synthesis, and validated models for unparalleled Rubber Market insights. See full methodology.
|
Market Scope |
|
|
Report Coverage |
Details |
|
Page number |
157 |
|
Base year |
2022 |
|
Historic period |
2017-2021 |
|
Forecast period |
2023-2027 |
|
Growth momentum & CAGR |
Accelerate at a CAGR of 5.28% |
|
Market growth 2023-2027 |
8795.35 MT |
|
Market structure |
Fragmented |
|
YoY growth 2022-2023(%) |
4.85 |
|
Key countries |
US, Canada, Germany, UK, Italy, France, China, India, Japan, Egypt, Oman, Argentina, KSA, UAE, and Brazil |
|
Competitive landscape |
Leading Companies, Market Positioning of Companies, Competitive Strategies, and Industry Risks |
Research Analyst Overview
- In the dynamic and intricate realm of the rubber industry, innovation and adaptation are the driving forces shaping the landscape. The market, characterized by its elasticity and versatility, is a testament to the relentless pursuit of superior elastomer properties. Two significant aspects of rubber production merit attention: testing and compounding. Chemical resistance testing and elastic modulus measurement are essential to ensure product durability and performance. Glass transition temperature and curing temperature control are crucial elements in the manufacturing process, impacting the final product's properties. Moreover, understanding the aging behavior of rubber through crystallinity analysis and molecular weight distribution is vital for predicting long-term performance.
- Rubber compounding ingredients, such as fillers and reinforcements, play a pivotal role in enhancing product characteristics. Synthetic rubber types, including polyisoprene, polychloroprene, and polybutadiene, each offer unique advantages. Ozone resistance testing and rebound resilience testing are critical in evaluating the performance of tire tread compounds. Stress-strain behavior and shore hardness testing provide insights into a material's elasticity and firmness, respectively. Thermal degradation analysis and creep behavior analysis help determine the material's stability under various conditions. The calendering process efficiency and molding process parameters significantly influence production efficiency and product quality. Polymer blending techniques and extrusion process optimization are essential for creating cost-effective, high-performance rubber products.
- Relaxation behavior analysis and the vulcanization process are crucial steps in producing high-quality rubber. Crosslink density measurement and rheological properties assessment ensure consistent product performance. In this evolving market, the interplay of various testing methods, compounding ingredients, and production techniques shapes the future of rubber manufacturing.
What are the Key Data Covered in this Rubber Market Research and Growth Report?
-
What is the expected growth of the Rubber Market between 2023 and 2027?
-
8795.35 MT, at a CAGR of 5.28%
-
-
What segmentation does the market report cover?
-
The report is segmented by Application (Tires and Non-tires), Type (Synthetic rubber, Natural rubber, and Reclaimed Rubber), Geography (APAC, Europe, North America, Middle East and Africa, South America, and Rest of World (ROW)), and End-use Industry (Automotive, Construction, and Consumer Goods)
-
-
Which regions are analyzed in the report?
-
APAC, Europe, North America, Middle East and Africa, and South America
-
-
What are the key growth drivers and market challenges?
-
Increasing demand from the automotive industry, Stringent regulations for rubber manufacturing
-
-
Who are the major players in the Rubber Market?
-
BASF SE, Bridgestone Corporation, Continental AG, Dow Inc., Evonik Industries, ExxonMobil Chemical, Goodyear Tire & Rubber Company, Hankook Tire, Kumho Tire, Lanxess AG, LG Chem, Michelin, Pirelli & C. S.p.A., SABIC, Sinopec, Solvay S.A., Sumitomo Rubber Industries, Toyo Tire Corporation, Trelleborg AB, and Yokohama Rubber Co., Ltd.
-
Market Research Insights
- The market encompasses a diverse range of products and processes, including isoprene and butadiene polymerization, rubber processing aids, material characterization techniques, and vulcanization accelerators. The global production of isoprene and butadiene polymers reached approximately 35 million metric tons in 2020, representing a significant portion of the total the market. Rubber processing requires various equipment such as compounding machines, waste rubber management systems, and colorants. For instance, compounding equipment facilitates the mixing of raw materials, while waste rubber management techniques ensure efficient processing and minimize environmental impact. Additionally, elastomers like polyurethane, ethylene propylene rubber, styrene-butadiene rubber, and thermoplastic elastomers require unique processing conditions and additives such as plasticizers, antioxidants, stabilizers, and vulcanization retarders.
- The elasticity properties of rubber materials vary significantly depending on the polymer type and formulation. For example, nitrile rubber exhibits excellent resistance to oil and fuel, while chloroprene rubber demonstrates superior resistance to ozone and weathering. Silicone rubber, on the other hand, offers exceptional temperature resistance and flexibility. In the realm of rubber processing, continuous improvement and optimization are essential. Quality control procedures and mixing process optimization are crucial to ensure consistent product specifications and meet customer requirements. Innovations in polymer modification techniques and recycling process technology continue to drive advancements in the rubber industry.
We can help! Our analysts can customize this rubber market research report to meet your requirements.
 RIA -
RIA - 
