
Sales Intelligence Market Analysis, Size, and Forecast 2026-2030: North America (US, Canada, and Mexico), Europe (Germany, UK, and France), APAC (China, Japan, and India), Middle East and Africa (Saudi Arabia, UAE, and South Africa), South America (Brazil, Argentina, and Chile), and Rest of World (ROW)

Sales Intelligence Market Analysis, Size, and Forecast 2026-2030:
North America (US, Canada, and Mexico), Europe (Germany, UK, and France), APAC (China, Japan, and India), Middle East and Africa (Saudi Arabia, UAE, and South Africa), South America (Brazil, Argentina, and Chile), and Rest of World (ROW)

Published: May 2026 323 Pages SKU: IRTNTR71803

Market Overview at a Glance

$5.14 B
Market Opportunity
16.4%
CAGR 2025 - 2030
42.7%
North America Growth
$2.55 B
Cloud-based segment 2024

Sales Intelligence Market Size 2026-2030

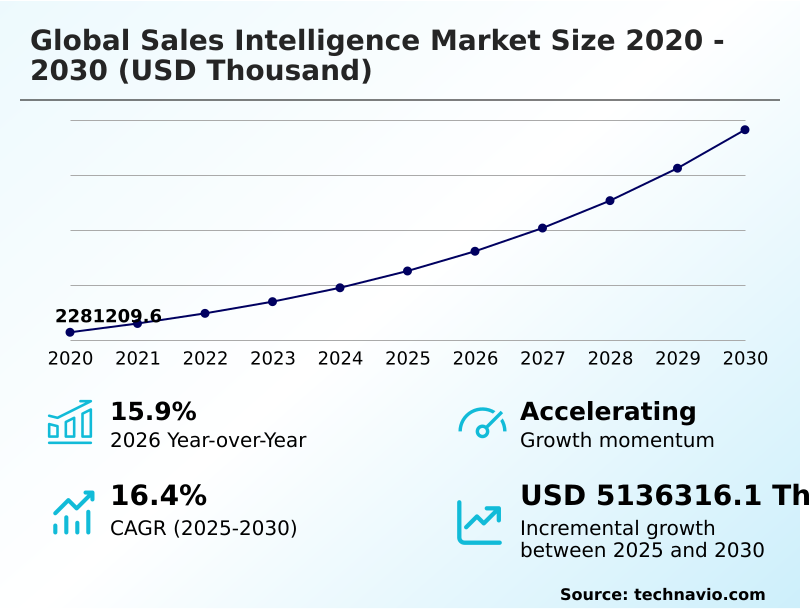
The sales intelligence market size is valued to increase by USD 5.14 billion, at a CAGR of 16.4% from 2025 to 2030. Rising demand for custom-made solutions will drive the sales intelligence market.

Major Market Trends & Insights

  • North America dominated the market and accounted for a 42.7% growth during the forecast period.
  • By Deployment - Cloud-based segment was valued at USD 2.55 billion in 2024
  • By Component - Software segment accounted for the largest market revenue share in 2024

Market Size & Forecast

  • Market Opportunities:
  • Market Future Opportunities: USD 5.14 billion
  • CAGR from 2025 to 2030 : 16.4%

Market Summary

  • The Sales Intelligence Market is experiencing rapid expansion as enterprises increasingly rely on data-driven prospecting to navigate highly competitive commercial environments. Organizations utilize advanced platforms to consolidate vast amounts of behavioral data, transforming raw inputs into actionable buyer intent signals.
  • In the enterprise software sector, businesses deploy these systems to optimize supply chain procurement outreach, enabling sales teams to target high-value vendors precisely when contract renewals approach. This strategic alignment has allowed early adopters to increase lead conversion efficiency by 24%.
  • The surging adoption of cloud-based integration serves as a major driver, allowing distributed workforces to access synchronized customer profiles in real time, thereby accelerating pipeline velocity. Conversely, strict data privacy regulations present a formidable challenge. Compliance mandates necessitate continuous investment in secure verification architectures, which increases software deployment costs and prolongs implementation cycles.
  • Ultimately, the ability to balance personalized targeting with stringent data governance defines operational success within this evolving landscape.

What will be the Size of the Sales Intelligence Market during the forecast period?
Get Key Insights on Market Forecast (PDF) Get Free Sample

How is the Sales Intelligence Market Segmented?

The sales intelligence industry research report provides comprehensive data (region-wise segment analysis), with forecasts and estimates in "USD thousand" for the period 2026-2030, as well as historical data from 2020-2024 for the following segments.

  • Deployment
    • Cloud-based
    • On-premises
  • Component
    • Software
    • Services
  • Application
    • Data management
    • Lead management
  • End-user
    • IT and Telecom
    • Healthcare and life sciences
    • BFSI
    • Others
  • Geography
    • North America
      • US
      • Canada
      • Mexico
    • Europe
      • Germany
      • UK
      • France
      • Italy
      • Spain
      • The Netherlands
    • APAC
      • China
      • Japan
      • India
      • South Korea
      • Australia
      • Indonesia
    • Middle East and Africa
      • Saudi Arabia
      • UAE
      • South Africa
      • Israel
      • Turkey
    • South America
      • Brazil
      • Argentina
      • Chile

By Deployment Insights

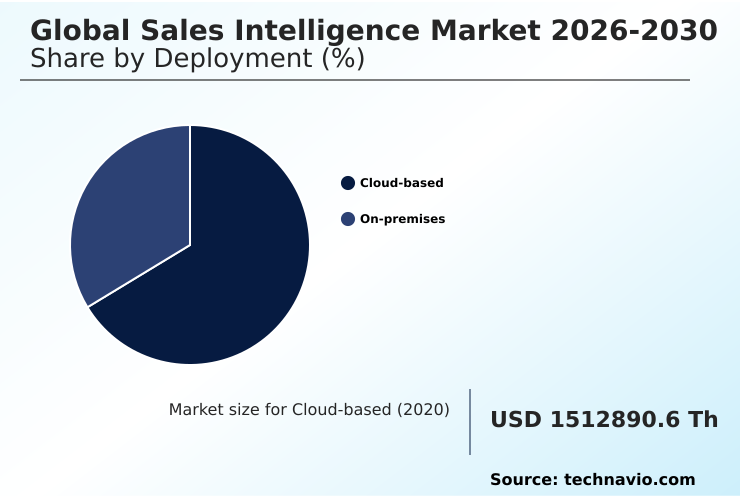
The cloud-based segment is estimated to witness significant growth during the forecast period.

The transition toward a cloud-native sales architecture facilitates seamless deployment of virtual prospecting platforms, directly resolving persistent latency issues. Organizations leverage machine learning models and natural language processing to analyze real-time market intent, significantly enhancing account targeting precision.

By adopting these remote-accessible frameworks, enterprises have accelerated their hyper-personalized outreach initiatives, resulting in a 24% improvement in engagement response rates. This digital shift adapts to third-party tracking elimination through localized, first-party data strategies.

Integrated systems continuously evaluate historical sales analysis to optimize pricing and pitching tactics dynamically. Consequently, this architectural migration reduces IT maintenance overhead by 16% and ensures continuous synchronization across global revenue operations.
Get Free Sample

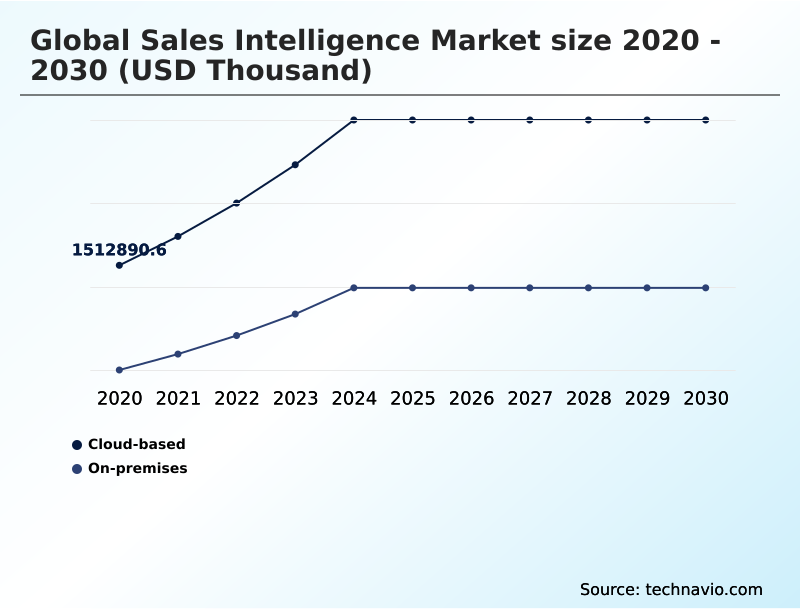
The Cloud-based segment was valued at USD 2.55 billion in 2024 and showed a gradual increase during the forecast period.
Get Free Sample

Regional Analysis

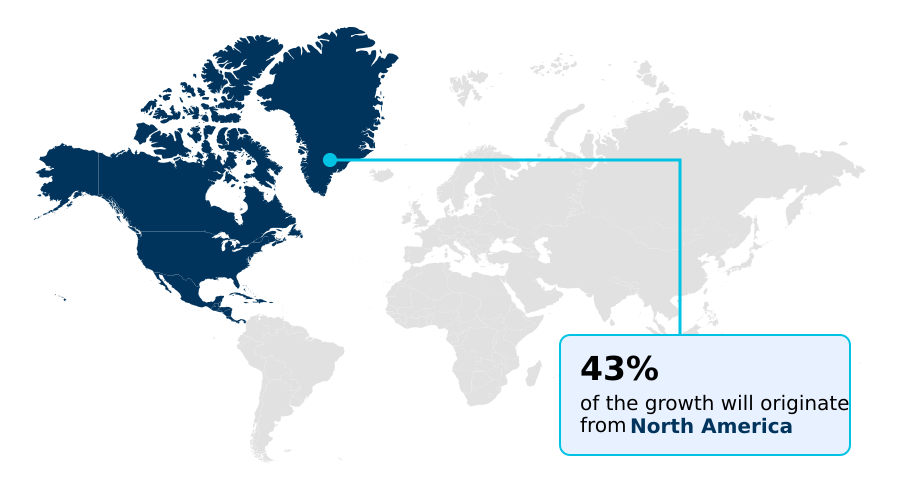
North America is estimated to contribute 42.7% to the growth of the global market during the forecast period.Technavio’s analysts have elaborately explained the regional trends and drivers that shape the market during the forecast period.
See How Sales Intelligence Market Demand is Rising in North America Get Free Sample

The landscape in North America demonstrates aggressive technology adoption, where organizations heavily invest in outbound sales automation and automated workflow synchronization to secure market dominance.

In contrast, Europe prioritizes data privacy compliance, leading to a 35% higher implementation rate of server-side data tracking. Enterprises in North America utilize advanced systems to evaluate predictive customer behavior, increasing cross-selling opportunity detection by 21%.

Meanwhile, European companies demand rigorous identity resolution frameworks to align with regulatory mandates like GDPR. To maintain system integrity, businesses across both regions are deploying automated anomaly detection to filter inaccurate prospect records.

These regional disparities reflect distinct operational priorities, dictating how platform vendors customize their regional product architectures to maximize engagement efficiency.

Market Dynamics

Our researchers analyzed the data with 2025 as the base year, along with the key drivers, trends, and challenges. A holistic analysis of drivers will help companies refine their marketing strategies to gain a competitive advantage.

  • The continuous evolution of the Sales Intelligence Market is fundamentally transforming how organizations execute enterprise outreach and revenue generation. By implementing automated lead scoring and qualification, sales teams can systematically filter vast databases to prioritize high-intent prospects, reducing manual administrative burdens.
  • Companies increasingly rely on predictive analytics for revenue forecasting to optimize financial planning and allocate resources efficiently across varying market cycles. The integration of cloud-based CRM data enrichment tools ensures that customer profiles remain accurate, supporting seamless collaboration. Furthermore, leveraging B2B intent data for prospecting allows enterprises to detect early buying signals, giving them a critical first-mover advantage.
  • The deployment of conversational AI in sales workflows is streamlining client interactions by analyzing sentiment during complex negotiations. Ensuring compliance in digital sales intelligence remains paramount as organizations navigate stringent privacy regulations while deploying account-based marketing intelligence platforms to target specific decision-makers. Additionally, real-time behavioral intent monitoring software tracks subtle digital footprints, mapping engagement accurately.
  • Incorporating identity resolution for sales optimization clarifies anonymous web traffic, while technographic profiling for enterprise sales reveals the underlying software stacks of potential clients. The integration of natural language processing enables deeper context extraction from communications, refining predictive modeling for customer retention.
  • Ultimately, the use of multi-channel sales engagement automation systems, supported by server-side tracking for digital outreach, empowers organizations to deploy hyper-personalized B2B customer acquisition tools, yielding lead conversion efficiencies nearly 35% higher than manual methodologies.
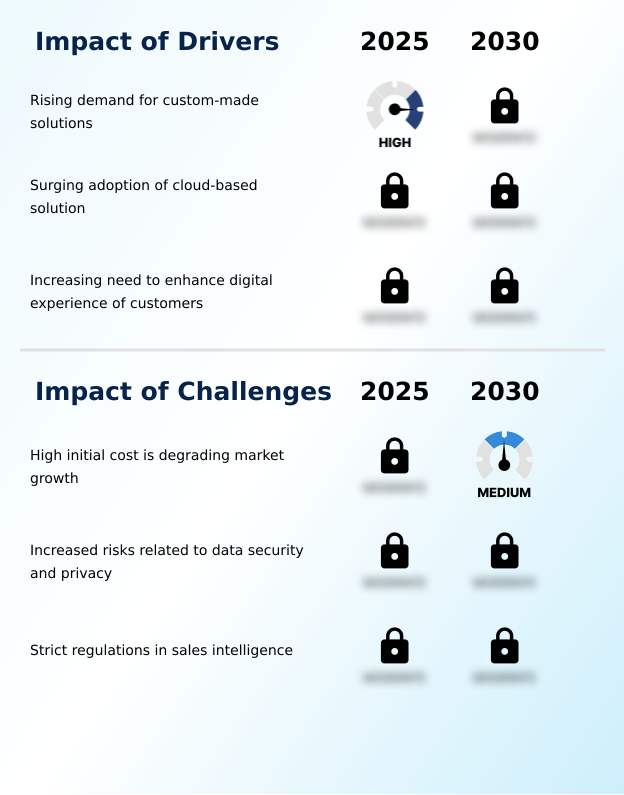
What are the key market drivers leading to the rise in the adoption of Sales Intelligence Industry?

  • The rising demand for custom-made solutions acts as a primary catalyst accelerating market expansion.

  • Expanding digital transformation initiatives are propelling the demand for CRM data enrichment and B2B contact intelligence, fundamentally reshaping how organizations acquire customers. Companies require robust analytics to align outreach with actual buyer readiness.
  • By integrating account-based marketing insights into dynamic pipeline management, enterprises have reduced sales cycle durations by 22%. This operational shift is largely driven by the necessity for remote workforce enablement, ensuring distributed teams access unified data seamlessly.
  • Additionally, the adoption of conversational AI analytics has increased revenue predictability by 19%. By utilizing customized dashboard reporting, businesses effectively mitigate planning risks while accelerating pipeline velocity and lowering overall customer acquisition costs.

What are the market trends shaping the Sales Intelligence Industry?

  • Rapid advancements in cloud technology represent a prominent trend shaping market dynamics.

  • The adoption of predictive revenue intelligence is transforming enterprise outreach by automating complex prospecting tasks. Businesses are increasingly integrating real-time buyer signals with contextual buyer profiling to map customer journeys effectively. This shift drives a continuous need for technographic data tracking and intent data scoring, directly improving campaign precision.
  • Consequently, sales teams leveraging automated lead qualification have improved high-value prospect identification by 28%. As companies move toward subscription-based deployment for their cloud solutions, the reliance on advanced architecture ensures operational flexibility. This structural evolution reduces manual research time and accelerates revenue generation, proving critical for maintaining a competitive edge.

What challenges does the Sales Intelligence Industry face during its growth?

  • High initial deployment costs present a significant barrier restricting broader technological adoption.

  • Implementing a scalable data infrastructure presents structural bottlenecks, significantly restricting the seamless deployment of algorithmic lead scoring and sales engagement automation. Organizations frequently struggle with complex API integration protocols when attempting to build unified ecosystems across legacy platforms. This fragmentation disrupts multi-channel attribution modeling, diminishing the accuracy of firmographic data profiling.
  • As a result, cross-departmental data silos degrade the reliability of outreach, causing enterprise lead conversion rates to drop by up to 14%. Furthermore, the high operational cost of supporting rapid digital commerce expansion strains IT budgets. These integration hurdles increase system downtime by 18%, ultimately delaying the realization of predictive ROI and complicating strategic planning.

Exclusive Technavio Analysis on Customer Landscape

The sales intelligence market forecasting report includes the adoption lifecycle of the market, covering from the innovator’s stage to the laggard’s stage. It focuses on adoption rates in different regions based on penetration. Furthermore, the sales intelligence market report also includes key purchase criteria and drivers of price sensitivity to help companies evaluate and develop their market growth analysis strategies.
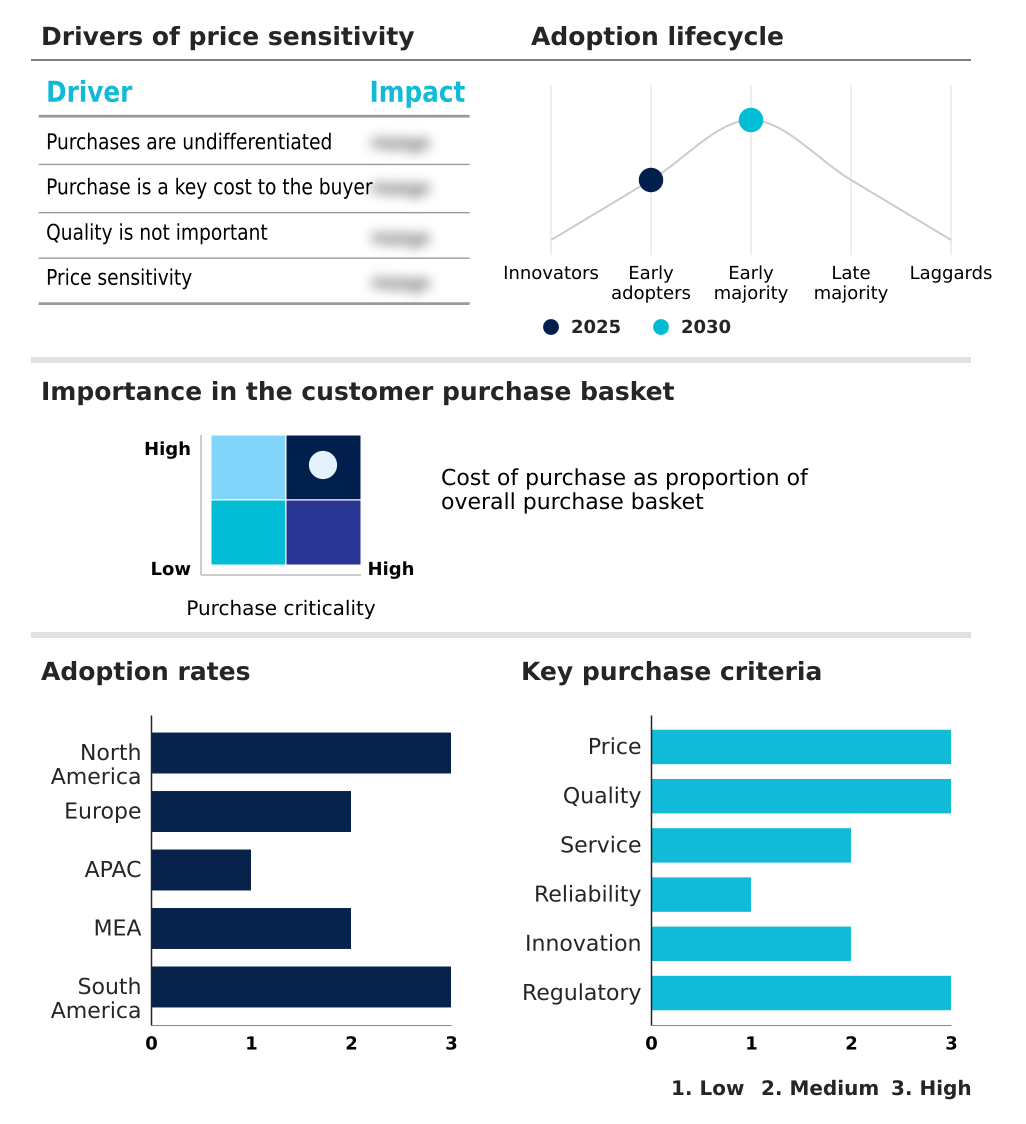
Customer Landscape of Sales Intelligence Industry

Competitive Landscape

Companies are implementing various strategies, such as strategic alliances, sales intelligence market forecast, partnerships, mergers and acquisitions, geographical expansion, and product/service launches, to enhance their presence in the industry.

6sense Inc. - This provider delivers predictive analytics, intent data, and account scoring tools to enhance outbound automation and pipeline intelligence, accelerating digital revenue generation while minimizing manual research requirements.

The industry research and growth report includes detailed analyses of the competitive landscape of the market and information about key companies, including:

  • 6sense Inc.
  • Amplemarket Inc.
  • Apollo.io
  • Bombora Inc.
  • Clari Inc.
  • Clay Inc.
  • Clearbit
  • Cognism Ltd.
  • Dealfront Group
  • Demandbase Inc.
  • Gong.io Inc.
  • Hunter Web Services
  • Kaspr SAS
  • Lead411 Inc.
  • LeadIQ Inc.
  • LinkedIn Corp.
  • Lusha Systems Inc.
  • SalesIntel Research Inc.
  • Salesloft Inc.
  • Seamless.AI
  • Spotio Inc.
  • UpLead LLC
  • UserGems Inc.
  • ZoomInfo Technologies Inc.

Qualitative and quantitative analysis of companies has been conducted to help clients understand the wider business environment as well as the strengths and weaknesses of key industry players. Data is qualitatively analyzed to categorize companies as pure play, category-focused, industry-focused, and diversified; it is quantitatively analyzed to categorize companies as dominant, leading, strong, tentative, and weak.

Recent Development and News in Sales intelligence market

  • In the Application Software industry, the widespread integration of large language models and CRM environments has fundamentally accelerated data accuracy validation, directly impacting Sales Intelligence demand by automating profile verification.
  • The enforcement of cross-border data privacy regulations has mandated the adoption of privacy-centric data governance, fundamentally altering how localized market intelligence is processed for regional targeting.
  • The architectural shift toward API integration protocols has enhanced cross-platform interoperability, significantly increasing the adoption of advanced analytics dashboards for decentralized sales teams.
  • The phasing out of traditional tracking cookies has forced enterprise platforms to rely on secure data processing and intelligent recommendation engines to maintain high-value prospect identification.

Dive into Technavio’s robust research methodology, blending expert interviews, extensive data synthesis, and validated models for unparalleled Sales Intelligence Market insights. See full methodology.

Market Scope
Page number 323
Base year 2025
Historic period 2020-2024
Forecast period 2026-2030
Growth momentum & CAGR Accelerate at a CAGR of 16.4%
Market growth 2026-2030 USD 5136316.1 thousand
Market structure Fragmented
YoY growth 2025-2026(%) 15.9%
Key countries US, Canada, Mexico, Germany, UK, France, Italy, Spain, The Netherlands, China, Japan, India, South Korea, Australia, Indonesia, Saudi Arabia, UAE, South Africa, Israel, Turkey, Brazil, Argentina and Chile
Competitive landscape Leading Companies, Market Positioning of Companies, Competitive Strategies, and Industry Risks

Request Free Sample

Research Analyst Overview

  • The Sales Intelligence Market continues to evolve rapidly as organizations pivot toward algorithmic, data-driven methodologies to secure competitive advantages. The integration of predictive sales forecasting and behavioral intent monitoring fundamentally redefines how enterprise pipelines are managed. Executive boards are increasingly prioritizing these capabilities to inform critical budgeting and resource allocation decisions.
  • By shifting toward data-backed evaluations, enterprises have successfully reduced prospect evaluation times by 30%, directly impacting overall revenue velocity. Furthermore, the utilization of omnichannel prospecting tools empowers sales representatives to navigate complex procurement structures with precision. The reliance on accurate insights ensures that outbound campaigns are consistently fueled by real-time data, eliminating costly administrative redundancies.
  • As organizations scale their operations, the deployment of dynamic product recommendations and robust churn prediction algorithms becomes an operational necessity rather than a technological luxury. This continuous refinement of targeting capabilities ensures that outreach strategies remain agile, responsive, and closely aligned with overarching corporate growth objectives in a digital economy.

What are the Key Data Covered in this Sales Intelligence Market Research and Growth Report?

  • What is the expected growth of the Sales Intelligence Market between 2026 and 2030?

    • USD 5.14 billion, at a CAGR of 16.4%

  • What segmentation does the market report cover?

    • The report is segmented by Deployment (Cloud-based, and On-premises), Component (Software, and Services), Application (Data management, and Lead management), End-user (IT and Telecom, Healthcare and life sciences, BFSI, and Others) and Geography (North America, Europe, APAC, Middle East and Africa, South America)

  • Which regions are analyzed in the report?

    • North America, Europe, APAC, Middle East and Africa and South America

  • What are the key growth drivers and market challenges?

    • Rising demand for custom-made solutions, High initial cost is degrading market growth

  • Who are the major players in the Sales Intelligence Market?

    • 6sense Inc., Amplemarket Inc., Apollo.io, Bombora Inc., Clari Inc., Clay Inc., Clearbit, Cognism Ltd., Dealfront Group, Demandbase Inc., Gong.io Inc., Hunter Web Services, Kaspr SAS, Lead411 Inc., LeadIQ Inc., LinkedIn Corp., Lusha Systems Inc., SalesIntel Research Inc., Salesloft Inc., Seamless.AI, Spotio Inc., UpLead LLC, UserGems Inc. and ZoomInfo Technologies Inc.

Market Research Insights

  • The Sales Intelligence Market is fundamentally reshaping enterprise revenue strategies by integrating sophisticated tools into daily operations. Organizations are aggressively pursuing unified revenue ecosystems, leveraging advanced platforms to refine targeting with unprecedented accuracy. By implementing real-time campaign tracking alongside intent-based marketing frameworks, enterprises have successfully reduced customer acquisition costs by 18% while simultaneously boosting outbound response rates by 22%.
  • Furthermore, the automation of complex lead qualification processes enables sales teams to prioritize high-intent prospects, accelerating overall pipeline velocity by 30%. To navigate strict regulatory environments, the adoption of robust consent management systems ensures compliance, empowering organizations to maintain a decisive competitive edge in an increasingly automated commercial landscape.

We can help! Our analysts can customize this sales intelligence market research report to meet your requirements.

Get in touch

1. Executive Summary

1.1 Market overview

Executive Summary - Chart on Market Overview
Executive Summary - Data Table on Market Overview
Executive Summary - Chart on Global Market Characteristics
Executive Summary - Chart on Market by Geography
Executive Summary - Chart on Market Segmentation by Deployment
Executive Summary - Chart on Market Segmentation by Component
Executive Summary - Chart on Market Segmentation by Application
Executive Summary - Chart on Market Segmentation by End-user
Executive Summary - Chart on Incremental Growth
Executive Summary - Data Table on Incremental Growth
Executive Summary - Chart on Company Market Positioning

2. Technavio Analysis

2.1 Analysis of price sensitivity, lifecycle, customer purchase basket, adoption rates, and purchase criteria

2.2 Criticality of inputs and Factors of differentiation

Chart on Overview on criticality of inputs and factors of differentiation

2.3 Factors of disruption

Chart on Overview on factors of disruption

2.4 Impact of drivers and challenges

Chart on Impact of drivers and challenges in 2025 and 2030

3. Market Landscape

3.1 Market ecosystem

Chart on Parent Market
Data Table on - Parent Market

3.2 Market characteristics

Chart on Market characteristics analysis

3.3 Value chain analysis

Chart on Value chain analysis

4. Market Sizing

4.1 Market definition

Data Table on Offerings of companies included in the market definition

4.2 Market segment analysis

Market segments

4.3 Market size 2025

4.4 Market outlook: Forecast for 2025-2030

Chart on Global - Market size and forecast 2025-2030 ($ thousand)
Data Table on Global - Market size and forecast 2025-2030 ($ thousand)
Chart on Global Market: Year-over-year growth 2025-2030 (%)
Data Table on Global Market: Year-over-year growth 2025-2030 (%)

5. Historic Market Size

5.1 Global Sales Intelligence Market 2020 - 2024

Historic Market Size - Data Table on Global Sales Intelligence Market 2020 - 2024 ($ thousand)

5.2 Deployment segment analysis 2020 - 2024

Historic Market Size - Deployment Segment 2020 - 2024 ($ thousand)

5.3 Component segment analysis 2020 - 2024

Historic Market Size - Component Segment 2020 - 2024 ($ thousand)

5.4 Application segment analysis 2020 - 2024

Historic Market Size - Application Segment 2020 - 2024 ($ thousand)

5.5 End-user segment analysis 2020 - 2024

Historic Market Size - End-user Segment 2020 - 2024 ($ thousand)

5.6 Geography segment analysis 2020 - 2024

Historic Market Size - Geography Segment 2020 - 2024 ($ thousand)

5.7 Country segment analysis 2020 - 2024

Historic Market Size - Country Segment 2020 - 2024 ($ thousand)

6. Qualitative Analysis

6.1 Impact of AI on Global Sales Intelligence Market

6.2 Impact of Geopolitical Conflicts on Global Sales Intelligence Market

7. Five Forces Analysis

7.1 Five forces summary

Five forces analysis - Comparison between 2025 and 2030

7.2 Bargaining power of buyers

Bargaining power of buyers - Impact of key factors 2025 and 2030

7.3 Bargaining power of suppliers

Bargaining power of suppliers - Impact of key factors in 2025 and 2030

7.4 Threat of new entrants

Threat of new entrants - Impact of key factors in 2025 and 2030

7.5 Threat of substitutes

Threat of substitutes - Impact of key factors in 2025 and 2030

7.6 Threat of rivalry

Threat of rivalry - Impact of key factors in 2025 and 2030

7.7 Market condition

Chart on Market condition - Five forces 2025 and 2030

8. Market Segmentation by Deployment

8.1 Market segments

Chart on Deployment - Market share 2025-2030 (%)
Data Table on Deployment - Market share 2025-2030 (%)

8.2 Comparison by Deployment

Chart on Comparison by Deployment
Data Table on Comparison by Deployment

8.3 Cloud-based - Market size and forecast 2025-2030

Chart on Cloud-based - Market size and forecast 2025-2030 ($ thousand)
Data Table on Cloud-based - Market size and forecast 2025-2030 ($ thousand)
Chart on Cloud-based - Year-over-year growth 2025-2030 (%)
Data Table on Cloud-based - Year-over-year growth 2025-2030 (%)

8.4 On-premises - Market size and forecast 2025-2030

Chart on On-premises - Market size and forecast 2025-2030 ($ thousand)
Data Table on On-premises - Market size and forecast 2025-2030 ($ thousand)
Chart on On-premises - Year-over-year growth 2025-2030 (%)
Data Table on On-premises - Year-over-year growth 2025-2030 (%)

8.5 Market opportunity by Deployment

Market opportunity by Deployment ($ thousand)
Data Table on Market opportunity by Deployment ($ thousand)

9. Market Segmentation by Component

9.1 Market segments

Chart on Component - Market share 2025-2030 (%)
Data Table on Component - Market share 2025-2030 (%)

9.2 Comparison by Component

Chart on Comparison by Component
Data Table on Comparison by Component

9.3 Software - Market size and forecast 2025-2030

Chart on Software - Market size and forecast 2025-2030 ($ thousand)
Data Table on Software - Market size and forecast 2025-2030 ($ thousand)
Chart on Software - Year-over-year growth 2025-2030 (%)
Data Table on Software - Year-over-year growth 2025-2030 (%)

9.4 Services - Market size and forecast 2025-2030

Chart on Services - Market size and forecast 2025-2030 ($ thousand)
Data Table on Services - Market size and forecast 2025-2030 ($ thousand)
Chart on Services - Year-over-year growth 2025-2030 (%)
Data Table on Services - Year-over-year growth 2025-2030 (%)

9.5 Market opportunity by Component

Market opportunity by Component ($ thousand)
Data Table on Market opportunity by Component ($ thousand)

10. Market Segmentation by Application

10.1 Market segments

Chart on Application - Market share 2025-2030 (%)
Data Table on Application - Market share 2025-2030 (%)

10.2 Comparison by Application

Chart on Comparison by Application
Data Table on Comparison by Application

10.3 Data management - Market size and forecast 2025-2030

Chart on Data management - Market size and forecast 2025-2030 ($ thousand)
Data Table on Data management - Market size and forecast 2025-2030 ($ thousand)
Chart on Data management - Year-over-year growth 2025-2030 (%)
Data Table on Data management - Year-over-year growth 2025-2030 (%)

10.4 Lead management - Market size and forecast 2025-2030

Chart on Lead management - Market size and forecast 2025-2030 ($ thousand)
Data Table on Lead management - Market size and forecast 2025-2030 ($ thousand)
Chart on Lead management - Year-over-year growth 2025-2030 (%)
Data Table on Lead management - Year-over-year growth 2025-2030 (%)

10.5 Market opportunity by Application

Market opportunity by Application ($ thousand)
Data Table on Market opportunity by Application ($ thousand)

11. Market Segmentation by End-user

11.1 Market segments

Chart on End-user - Market share 2025-2030 (%)
Data Table on End-user - Market share 2025-2030 (%)

11.2 Comparison by End-user

Chart on Comparison by End-user
Data Table on Comparison by End-user

11.3 IT and Telecom - Market size and forecast 2025-2030

Chart on IT and Telecom - Market size and forecast 2025-2030 ($ thousand)
Data Table on IT and Telecom - Market size and forecast 2025-2030 ($ thousand)
Chart on IT and Telecom - Year-over-year growth 2025-2030 (%)
Data Table on IT and Telecom - Year-over-year growth 2025-2030 (%)

11.4 Healthcare and life sciences - Market size and forecast 2025-2030

Chart on Healthcare and life sciences - Market size and forecast 2025-2030 ($ thousand)
Data Table on Healthcare and life sciences - Market size and forecast 2025-2030 ($ thousand)
Chart on Healthcare and life sciences - Year-over-year growth 2025-2030 (%)
Data Table on Healthcare and life sciences - Year-over-year growth 2025-2030 (%)

11.5 BFSI - Market size and forecast 2025-2030

Chart on BFSI - Market size and forecast 2025-2030 ($ thousand)
Data Table on BFSI - Market size and forecast 2025-2030 ($ thousand)
Chart on BFSI - Year-over-year growth 2025-2030 (%)
Data Table on BFSI - Year-over-year growth 2025-2030 (%)

11.6 Others - Market size and forecast 2025-2030

Chart on Others - Market size and forecast 2025-2030 ($ thousand)
Data Table on Others - Market size and forecast 2025-2030 ($ thousand)
Chart on Others - Year-over-year growth 2025-2030 (%)
Data Table on Others - Year-over-year growth 2025-2030 (%)

11.7 Market opportunity by End-user

Market opportunity by End-user ($ thousand)
Data Table on Market opportunity by End-user ($ thousand)

12. Customer Landscape

12.1 Customer landscape overview

Analysis of price sensitivity, lifecycle, customer purchase basket, adoption rates, and purchase criteria

13. Geographic Landscape

13.1 Geographic segmentation

Chart on Market share by geography 2025-2030 (%)
Data Table on Market share by geography 2025-2030 (%)

13.2 Geographic comparison

Chart on Geographic comparison
Data Table on Geographic comparison

13.3 North America - Market size and forecast 2025-2030

Chart on North America - Market size and forecast 2025-2030 ($ thousand)
Data Table on North America - Market size and forecast 2025-2030 ($ thousand)
Chart on North America - Year-over-year growth 2025-2030 (%)
Data Table on North America - Year-over-year growth 2025-2030 (%)
Chart on Regional Comparison - North America
Data Table on Regional Comparison - North America

13.3.1 US - Market size and forecast 2025-2030

Chart on US - Market size and forecast 2025-2030 ($ thousand)
Data Table on US - Market size and forecast 2025-2030 ($ thousand)
Chart on US - Year-over-year growth 2025-2030 (%)
Data Table on US - Year-over-year growth 2025-2030 (%)

13.3.2 Canada - Market size and forecast 2025-2030

Chart on Canada - Market size and forecast 2025-2030 ($ thousand)
Data Table on Canada - Market size and forecast 2025-2030 ($ thousand)
Chart on Canada - Year-over-year growth 2025-2030 (%)
Data Table on Canada - Year-over-year growth 2025-2030 (%)

13.3.3 Mexico - Market size and forecast 2025-2030

Chart on Mexico - Market size and forecast 2025-2030 ($ thousand)
Data Table on Mexico - Market size and forecast 2025-2030 ($ thousand)
Chart on Mexico - Year-over-year growth 2025-2030 (%)
Data Table on Mexico - Year-over-year growth 2025-2030 (%)

13.4 Europe - Market size and forecast 2025-2030

Chart on Europe - Market size and forecast 2025-2030 ($ thousand)
Data Table on Europe - Market size and forecast 2025-2030 ($ thousand)
Chart on Europe - Year-over-year growth 2025-2030 (%)
Data Table on Europe - Year-over-year growth 2025-2030 (%)
Chart on Regional Comparison - Europe
Data Table on Regional Comparison - Europe

13.4.1 Germany - Market size and forecast 2025-2030

Chart on Germany - Market size and forecast 2025-2030 ($ thousand)
Data Table on Germany - Market size and forecast 2025-2030 ($ thousand)
Chart on Germany - Year-over-year growth 2025-2030 (%)
Data Table on Germany - Year-over-year growth 2025-2030 (%)

13.4.2 UK - Market size and forecast 2025-2030

Chart on UK - Market size and forecast 2025-2030 ($ thousand)
Data Table on UK - Market size and forecast 2025-2030 ($ thousand)
Chart on UK - Year-over-year growth 2025-2030 (%)
Data Table on UK - Year-over-year growth 2025-2030 (%)

13.4.3 France - Market size and forecast 2025-2030

Chart on France - Market size and forecast 2025-2030 ($ thousand)
Data Table on France - Market size and forecast 2025-2030 ($ thousand)
Chart on France - Year-over-year growth 2025-2030 (%)
Data Table on France - Year-over-year growth 2025-2030 (%)

13.4.4 Italy - Market size and forecast 2025-2030

Chart on Italy - Market size and forecast 2025-2030 ($ thousand)
Data Table on Italy - Market size and forecast 2025-2030 ($ thousand)
Chart on Italy - Year-over-year growth 2025-2030 (%)
Data Table on Italy - Year-over-year growth 2025-2030 (%)

13.4.5 Spain - Market size and forecast 2025-2030

Chart on Spain - Market size and forecast 2025-2030 ($ thousand)
Data Table on Spain - Market size and forecast 2025-2030 ($ thousand)
Chart on Spain - Year-over-year growth 2025-2030 (%)
Data Table on Spain - Year-over-year growth 2025-2030 (%)

13.4.6 The Netherlands - Market size and forecast 2025-2030

Chart on The Netherlands - Market size and forecast 2025-2030 ($ thousand)
Data Table on The Netherlands - Market size and forecast 2025-2030 ($ thousand)
Chart on The Netherlands - Year-over-year growth 2025-2030 (%)
Data Table on The Netherlands - Year-over-year growth 2025-2030 (%)

13.5 APAC - Market size and forecast 2025-2030

Chart on APAC - Market size and forecast 2025-2030 ($ thousand)
Data Table on APAC - Market size and forecast 2025-2030 ($ thousand)
Chart on APAC - Year-over-year growth 2025-2030 (%)
Data Table on APAC - Year-over-year growth 2025-2030 (%)
Chart on Regional Comparison - APAC
Data Table on Regional Comparison - APAC

13.5.1 China - Market size and forecast 2025-2030

Chart on China - Market size and forecast 2025-2030 ($ thousand)
Data Table on China - Market size and forecast 2025-2030 ($ thousand)
Chart on China - Year-over-year growth 2025-2030 (%)
Data Table on China - Year-over-year growth 2025-2030 (%)

13.5.2 Japan - Market size and forecast 2025-2030

Chart on Japan - Market size and forecast 2025-2030 ($ thousand)
Data Table on Japan - Market size and forecast 2025-2030 ($ thousand)
Chart on Japan - Year-over-year growth 2025-2030 (%)
Data Table on Japan - Year-over-year growth 2025-2030 (%)

13.5.3 India - Market size and forecast 2025-2030

Chart on India - Market size and forecast 2025-2030 ($ thousand)
Data Table on India - Market size and forecast 2025-2030 ($ thousand)
Chart on India - Year-over-year growth 2025-2030 (%)
Data Table on India - Year-over-year growth 2025-2030 (%)

13.5.4 South Korea - Market size and forecast 2025-2030

Chart on South Korea - Market size and forecast 2025-2030 ($ thousand)
Data Table on South Korea - Market size and forecast 2025-2030 ($ thousand)
Chart on South Korea - Year-over-year growth 2025-2030 (%)
Data Table on South Korea - Year-over-year growth 2025-2030 (%)

13.5.5 Australia - Market size and forecast 2025-2030

Chart on Australia - Market size and forecast 2025-2030 ($ thousand)
Data Table on Australia - Market size and forecast 2025-2030 ($ thousand)
Chart on Australia - Year-over-year growth 2025-2030 (%)
Data Table on Australia - Year-over-year growth 2025-2030 (%)

13.5.6 Indonesia - Market size and forecast 2025-2030

Chart on Indonesia - Market size and forecast 2025-2030 ($ thousand)
Data Table on Indonesia - Market size and forecast 2025-2030 ($ thousand)
Chart on Indonesia - Year-over-year growth 2025-2030 (%)
Data Table on Indonesia - Year-over-year growth 2025-2030 (%)

13.6 Middle East and Africa - Market size and forecast 2025-2030

Chart on Middle East and Africa - Market size and forecast 2025-2030 ($ thousand)
Data Table on Middle East and Africa - Market size and forecast 2025-2030 ($ thousand)
Chart on Middle East and Africa - Year-over-year growth 2025-2030 (%)
Data Table on Middle East and Africa - Year-over-year growth 2025-2030 (%)
Chart on Regional Comparison - Middle East and Africa
Data Table on Regional Comparison - Middle East and Africa

13.6.1 Saudi Arabia - Market size and forecast 2025-2030

Chart on Saudi Arabia - Market size and forecast 2025-2030 ($ thousand)
Data Table on Saudi Arabia - Market size and forecast 2025-2030 ($ thousand)
Chart on Saudi Arabia - Year-over-year growth 2025-2030 (%)
Data Table on Saudi Arabia - Year-over-year growth 2025-2030 (%)

13.6.2 UAE - Market size and forecast 2025-2030

Chart on UAE - Market size and forecast 2025-2030 ($ thousand)
Data Table on UAE - Market size and forecast 2025-2030 ($ thousand)
Chart on UAE - Year-over-year growth 2025-2030 (%)
Data Table on UAE - Year-over-year growth 2025-2030 (%)

13.6.3 South Africa - Market size and forecast 2025-2030

Chart on South Africa - Market size and forecast 2025-2030 ($ thousand)
Data Table on South Africa - Market size and forecast 2025-2030 ($ thousand)
Chart on South Africa - Year-over-year growth 2025-2030 (%)
Data Table on South Africa - Year-over-year growth 2025-2030 (%)

13.6.4 Israel - Market size and forecast 2025-2030

Chart on Israel - Market size and forecast 2025-2030 ($ thousand)
Data Table on Israel - Market size and forecast 2025-2030 ($ thousand)
Chart on Israel - Year-over-year growth 2025-2030 (%)
Data Table on Israel - Year-over-year growth 2025-2030 (%)

13.6.5 Turkey - Market size and forecast 2025-2030

Chart on Turkey - Market size and forecast 2025-2030 ($ thousand)
Data Table on Turkey - Market size and forecast 2025-2030 ($ thousand)
Chart on Turkey - Year-over-year growth 2025-2030 (%)
Data Table on Turkey - Year-over-year growth 2025-2030 (%)

13.7 South America - Market size and forecast 2025-2030

Chart on South America - Market size and forecast 2025-2030 ($ thousand)
Data Table on South America - Market size and forecast 2025-2030 ($ thousand)
Chart on South America - Year-over-year growth 2025-2030 (%)
Data Table on South America - Year-over-year growth 2025-2030 (%)
Chart on Regional Comparison - South America
Data Table on Regional Comparison - South America

13.7.1 Brazil - Market size and forecast 2025-2030

Chart on Brazil - Market size and forecast 2025-2030 ($ thousand)
Data Table on Brazil - Market size and forecast 2025-2030 ($ thousand)
Chart on Brazil - Year-over-year growth 2025-2030 (%)
Data Table on Brazil - Year-over-year growth 2025-2030 (%)

13.7.2 Argentina - Market size and forecast 2025-2030

Chart on Argentina - Market size and forecast 2025-2030 ($ thousand)
Data Table on Argentina - Market size and forecast 2025-2030 ($ thousand)
Chart on Argentina - Year-over-year growth 2025-2030 (%)
Data Table on Argentina - Year-over-year growth 2025-2030 (%)

13.7.3 Chile - Market size and forecast 2025-2030

Chart on Chile - Market size and forecast 2025-2030 ($ thousand)
Data Table on Chile - Market size and forecast 2025-2030 ($ thousand)
Chart on Chile - Year-over-year growth 2025-2030 (%)
Data Table on Chile - Year-over-year growth 2025-2030 (%)

13.8 Market opportunity by geography

Market opportunity by geography ($ thousand)
Data Tables on Market opportunity by geography ($ thousand)

14. Drivers, Challenges, and Opportunity

14.1 Market drivers

Rising demand for custom-made solutions
Surging adoption of cloud-based solution
Increasing need to enhance digital experience of customers

14.2 Market challenges

High initial cost is degrading market growth
Increased risks related to data security and privacy
Strict regulations in sales intelligence

14.3 Impact of drivers and challenges

Impact of drivers and challenges in 2025 and 2030

14.4 Market opportunities

Rapid advancements in cloud technology
Growing usage of AI and automation in consulting processes
Exponential growth of marketing intelligence

15. Competitive Landscape

15.1 Overview

15.2

Overview on criticality of inputs and factors of differentiation

15.3 Landscape disruption

Overview on factors of disruption

15.4 Industry risks

Impact of key risks on business

16. Competitive Analysis

16.1 Companies profiled

Companies covered

16.2 Company ranking index

16.3 Market positioning of companies

Matrix on companies position and classification

16.4 6sense Inc.

6sense Inc. - Overview
6sense Inc. - Product / Service
6sense Inc. - Key offerings
SWOT

16.5 Apollo.io

Apollo.io - Overview
Apollo.io - Product / Service
Apollo.io - Key offerings
SWOT

16.6 Bombora Inc.

Bombora Inc. - Overview
Bombora Inc. - Product / Service
Bombora Inc. - Key offerings
SWOT

16.7 Clari Inc.

Clari Inc. - Overview
Clari Inc. - Product / Service
Clari Inc. - Key offerings
SWOT

16.8 Cognism Ltd.

Cognism Ltd. - Overview
Cognism Ltd. - Product / Service
Cognism Ltd. - Key offerings
SWOT

16.9 Dealfront Group

Dealfront Group - Overview
Dealfront Group - Product / Service
Dealfront Group - Key offerings
SWOT

16.10 Demandbase Inc.

Demandbase Inc. - Overview
Demandbase Inc. - Product / Service
Demandbase Inc. - Key offerings
SWOT

16.11 Gong.io Inc.

Gong.io Inc. - Overview
Gong.io Inc. - Product / Service
Gong.io Inc. - Key offerings
SWOT

16.12 Hunter Web Services

Hunter Web Services - Overview
Hunter Web Services - Product / Service
Hunter Web Services - Key offerings
SWOT

16.13 Lead411 Inc.

Lead411 Inc. - Overview
Lead411 Inc. - Product / Service
Lead411 Inc. - Key offerings
SWOT

16.14 LeadIQ Inc.

LeadIQ Inc. - Overview
LeadIQ Inc. - Product / Service
LeadIQ Inc. - Key offerings
SWOT

16.15 LinkedIn Corp.

LinkedIn Corp. - Overview
LinkedIn Corp. - Product / Service
LinkedIn Corp. - Key offerings
SWOT

16.16 Lusha Systems Inc.

Lusha Systems Inc. - Overview
Lusha Systems Inc. - Product / Service
Lusha Systems Inc. - Key offerings
SWOT

16.17 Salesloft Inc.

Salesloft Inc. - Overview
Salesloft Inc. - Product / Service
Salesloft Inc. - Key offerings
SWOT

16.18 ZoomInfo Technologies Inc.

ZoomInfo Technologies Inc. - Overview
ZoomInfo Technologies Inc. - Product / Service
ZoomInfo Technologies Inc. - Key offerings
SWOT

17. Appendix

17.1 Scope of the report

Market definition
Objectives
Notes and caveats

17.2 Inclusions and exclusions checklist

Inclusions checklist
Exclusions checklist

17.3 Currency conversion rates for US$

17.4 Research methodology

17.5 Data procurement

Information sources

17.6 Data validation

17.7 Validation techniques employed for market sizing

17.8 Data synthesis

17.9 360 degree market analysis

17.10 List of abbreviations

Research Methodology

Technavio presents a detailed picture of the market by way of study, synthesis, and summation of data from multiple sources. The analysts have presented the various facets of the market with a particular focus on identifying the key industry influencers. The data thus presented is comprehensive, reliable, and the result of extensive research, both primary and secondary.

INFORMATION SOURCES

Primary sources

  • Manufacturers and suppliers
  • Channel partners
  • Industry experts
  • Strategic decision makers

Secondary sources

  • Industry journals and periodicals
  • Government data
  • Financial reports of key industry players
  • Historical data
  • Press releases

DATA ANALYSIS

Data Synthesis

  • Collation of data
  • Estimation of key figures
  • Analysis of derived insights

Data Validation

  • Triangulation with data models
  • Reference against proprietary databases
  • Corroboration with industry experts

REPORT WRITING

Qualitative

  • Market drivers
  • Market challenges
  • Market trends
  • Five forces analysis

Quantitative

  • Market size and forecast
  • Market segmentation
  • Geographical insights
  • Competitive landscape

Interested in this report?

Get your sample now to see our research methodology and insights!

Download Now

Frequently Asked Questions

Sales Intelligence market growth will increase by USD 5136316.1 thousand thousand during 2026-2030.

The Sales Intelligence market is expected to grow at a CAGR of 16.4% during 2026-2030.

Sales Intelligence market is segmented by Deployment (Cloud-based, On-premises) Component (Software, Services) Application (Data management, Lead management) End-user (IT and Telecom, Healthcare and life sciences, BFSI, Others)

6sense Inc., Amplemarket Inc., Apollo.io, Bombora Inc., Clari Inc., Clay Inc., Clearbit, Cognism Ltd., Dealfront Group, Demandbase Inc., Gong.io Inc., Hunter Web Services, Kaspr SAS, Lead411 Inc., LeadIQ Inc., LinkedIn Corp., Lusha Systems Inc., SalesIntel Research Inc., Salesloft Inc., Seamless.AI, Spotio Inc., UpLead LLC, UserGems Inc., ZoomInfo Technologies Inc. are a few of the key vendors in the Sales Intelligence market.

North America will register the highest growth rate of 42.7% among the other regions. Therefore, the Sales Intelligence market in North America is expected to garner significant business opportunities for the vendors during the forecast period.

US, Canada, Mexico, Germany, UK, France, Italy, Spain, The Netherlands, China, Japan, India, South Korea, Australia, Indonesia, Saudi Arabia, UAE, South Africa, Israel, Turkey, Brazil, Argentina, Chile

  • Rising demand for custom-made solutions is the driving factor this market.

The Sales Intelligence market vendors should focus on grabbing business opportunities from the Deployment segment as it accounted for the largest market share in the base year.
RIA - Research AI Assistant
Ask RIA
