Sea Salt Market Analysis APAC, Europe, North America, South America, Middle East and Africa - China, India, Germany, France, US, Japan, Brazil, Italy, South Korea, Spain - Size and Forecast 2024-2028

Sea Salt Market Analysis APAC, Europe, North America, South America, Middle East and Africa - China, India, Germany, France, US, Japan, Brazil, Italy, South Korea, Spain - Size and Forecast 2024-2028

Published: Sep 2024 199 Pages SKU: IRTNTR80192

Market Overview at a Glance

$3.64 B
Market Opportunity
3.7%
CAGR
3.5
YoY growth 2023-2024(%)

Sea Salt Market Size 2024-2028 

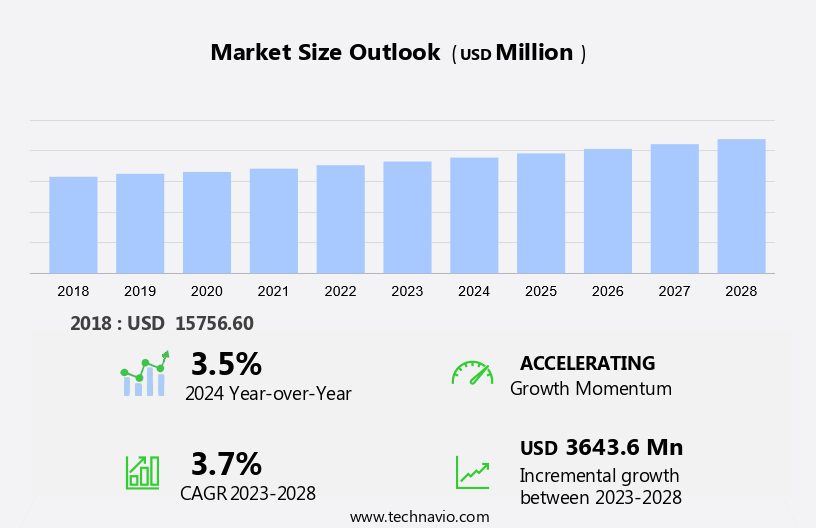
The sea salt market size is forecast to increase by USD 3.64 billion at a CAGR of 3.7% between 2023 and 2028. The market is experiencing significant growth due to the increasing demand for processed foods, particularly in the foodservice and retail industries. The market is also driven by advancements in packaging technologies, particularly in the textiles and paper sectors, which enable better preservation of salt. Strict regulatory and compliance standards, especially in the oil and gas industry for de-icing applications, further fuel market growth. Renewable energy sources, such as solar evaporation, are gaining popularity in the production of solar salt, contributing to the market's expansion. Waste management and chemical processing are other areas where sea salt finds applications, making it a versatile commodity. Ion exchange resins are increasingly being used in the market, offering opportunities for innovation and efficiency. Overall, the market is witnessing steady growth, driven by its diverse applications and the need for high-quality, sustainable salt production.

What will be the Size of the Market During the Forecast Period?

Sea Salt Market Size

 Request Free Sample

Sea salt, a natural mineral product obtained from the evaporation of seawater, holds a significant position in various industries, including food, agriculture, and manufacturing. The market in the United States is driven by several factors, including the demand for healthier alternatives, increasing applications in diverse sectors, and the focus on sustainable solutions. The food industry is a major consumer of sea salt. With the transitioning lifestyles and growing health consciousness, consumers are increasingly opting for natural and unprocessed food items. Sea salt, with its natural minerals and trace elements, is gaining popularity as a healthier alternative to refined table salt.

Moreover, sea salt's unique flavor profile is highly sought after in the culinary industry, further boosting market growth. Apart from human food applications, sea salt is also used extensively in animal feed, water treatment, cosmetics, and agriculture. In animal feed, sea salt serves as a natural source of essential minerals and inorganic compounds. In water treatment, it acts as a natural coagulant, improving water quality. In cosmetics, sea salt's antimicrobial properties make it an effective ingredient in various personal care products. In agriculture, sea salt is used as a soil conditioner and fertilizer, enhancing crop growth and yield. Logistics costs and events are two significant challenges impacting the market in the United States.

Furthermore, the high logistics costs associated with the transportation of sea salt from production sites to consumers can affect market growth. Additionally, seasonal events, such as hurricanes and typhoons, can disrupt sea salt production and supply, leading to price fluctuations. To mitigate these challenges, several sustainable solutions are being adopted. Mechanical vapor recompressors (MVR) are being used to reduce energy consumption and cost in sea salt production. These systems help in the efficient recovery of heat and energy, making the production process more sustainable and cost-effective. Furthermore, proper labeling and mandatory certifications are essential to ensure the quality and safety of sea salt..

Market Segmentation

The market research report provides comprehensive data (region-wise segment analysis), with forecasts and estimates in "USD billion" for the period 2024-2028, as well as historical data from 2018-2022 for the following segments.

  • Type
    • Fine grains
    • Crystal
  • Application
    • Food
    • Industrial
  • Geography
    • APAC
      • China
      • India
    • Europe
      • Germany
      • France
    • North America
    • South America
    • Middle East and Africa

By Type Insights

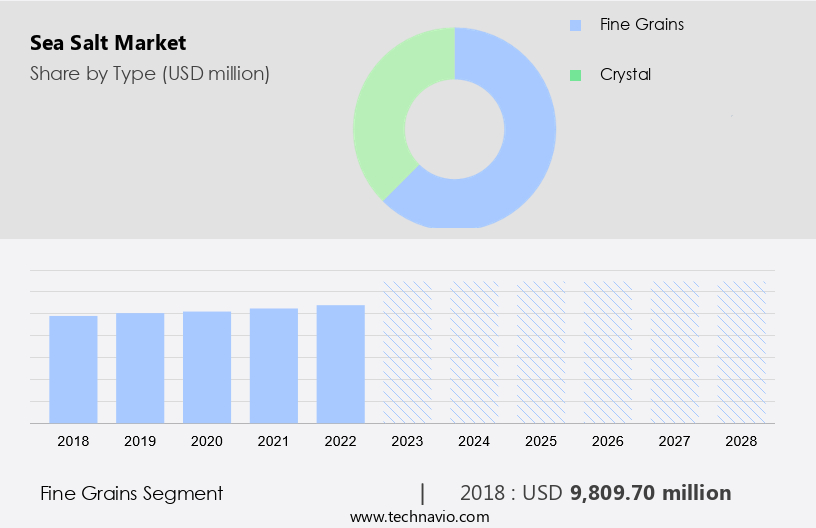
The fine grains segment is estimated to witness significant growth during the forecast period. Sea salt, particularly in its fine grain form, has gained significant traction in various industries, including the HORECA sector. The fine texture of this salt, which is achieved through careful pulverization, offers several advantages. Its small granules ensure even distribution, making it an excellent choice for experimental cuisine and enhancing the flavors of dishes such as vegan cheese, pasta, bagels, and spice shop blends. Beyond the culinary realm, fine sea salt has also found a place in the cosmetics industries. Sea salt-based cosmetics have become increasingly popular due to their natural origin and potential health benefits. Seasoning companies and agriculture sectors also utilize fine sea salt for its preservative properties, extending the shelf life of packaged rice and other food products.

Furthermore, the convenience-driven lifestyle of North American consumers has fueled the demand for ready-to-eat items. As a result, fine sea salt, with its extended shelf life, has become a preferred ingredient for seafood restaurants and other food service establishments. The versatility of this salt, combined with its ability to enhance flavors and preserve food, has made it an essential component in various industries. Fine sea salt is available in bags with resealable closures, ensuring that it remains fresh and ready for use.

Sea Salt Market Size

Get a glance at the market share of various segments Request Free Sample

The fine grains segment accounted for USD 9.81 billion in 2018 and showed a gradual increase during the forecast period.

Regional Insights

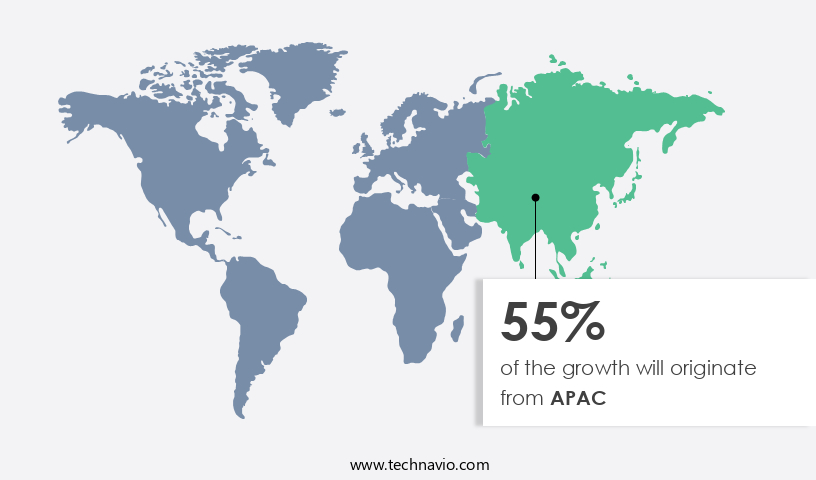
APAC is estimated to contribute 55% to the growth of the global market during the forecast period. Technavio's analysts have elaborately explained the regional trends and drivers that shape the market during the forecast period.

Sea Salt Market Share by Geography

For more insights on the market share of various regions Request Free Sample

The market in the Asia Pacific (APAC) region is experiencing notable growth due to the increasing demand for this natural seasoning in various industries and food consumption. The expansion is mainly fueled by the rapid industrialization in countries like India and China, which has led to an increase in demand from sectors such as food processing, chemical production, and gourmet food products. In particular, industries like pulp and paper, leather, and chemical processing heavily rely on sea salt for their operations, using it as a raw material for the production of inorganic compounds and minerals. China is the leading producer of sea salt in the APAC region, supplying a significant portion of the global demand.

Furthermore, this trend is expected to continue as consumers increasingly prefer clean label products and seek low sodium alternatives, further boosting the demand for sea salt in the region. The health benefits associated with sea salt, including its rich mineral content and absence of additives, also contribute to its popularity. Food consumption remains a major application area for sea salt, with its use extending beyond the kitchen to various industries for diverse purposes. However, it is important to note that while sea salt is a natural product, it still contains sodium and chloride, which can pose health concerns if consumed in excess. Therefore, it is essential to maintain proper consumption levels to reap the benefits while minimizing potential health risks.

Our researchers analyzed the data with 2023 as the base year, along with the key drivers, trends, and challenges. A holistic analysis of drivers will help companies refine their marketing strategies to gain a competitive advantage.

Market Driver

Growing demand for processed foods is the key driver of the market. The demand for sea salt is on the rise due to its extensive usage in various industries, particularly in the food sector. Sea salt is extracted from seawater through a process known as brine extraction. This process involves the evaporation of seawater, leaving behind the salt crystals. Sea salt is also derived from rock salt through mining. In the food industry, sea salt is used as a seasoning and a preservative. It is also preferred over table salt due to the healthier eating trend, as sea salt contains more minerals and less processed additives. In addition, sea salt is used as a de-icing product during winter months.

Furthermore, the production of chlorine-alkali chemicals, such as caustic soda and soda ash, involves the use of sea salt as a catalyst and a drying agent. These chemicals are essential in various industries, including water treatment and textiles. Sea salt is also used in the industrial sector for various applications, including as a purification process agent. The market is expected to grow due to the increasing demand for processed foods and the expanding industrial sector. In the US, the food processing industry is a significant consumer of sea salt. The growing preference for convenience foods and the increasing population are driving the demand for sea salt.

Additionally, the increasing awareness of healthier eating habits is leading to a rise in demand for natural and organic sea salt. In conclusion, sea salt is a versatile product with numerous applications across various industries. Its demand is expected to grow due to the expanding food and industrial sectors and the increasing trend towards healthier eating.

Market Trends

Cutting-edge packaging innovations is the upcoming trend in the market. The market in the United States is experiencing a notable trend towards innovative packaging solutions, which are increasingly influencing consumer purchasing decisions. Packaging serves as the initial contact between consumers and the product, making it a significant element of marketing strategies. Innovative packaging not only improves the visual appeal of sea salt products but also plays a vital role in brand differentiation and shelf presence. One notable advancement in this area is the integration of resealable packaging. This type of packaging preserves product freshness and prevents caking, thereby extending the product's shelf life. 

Market Challenge

Strict regulatory and compliance standards related to sea salt is a key challenge affecting the market growth. The market in the United States faces regulatory hurdles that necessitate strict adherence to consumer safety and product quality standards. These regulations, imposed by various industry oversight bodies such as the Food and Drug Administration (FDA), influence the production, distribution, and utilization of sea salt. In the food industry, the FDA sets specific guidelines for the application of food additives, including sea salt. Beyond food applications, sea salt is employed in various industries, including textiles, paper manufacturing, solar evaporation for renewable energy, waste management, de-icing, solar salt, processed foods, vacuum pan salt, chemical processing, oil and gas, and flavoring agent.

Furthermore, the market for sea salt is driven by its use in the food industry, particularly in the production of processed foods and as a flavoring agent. Additionally, the market for sea salt is expanding in the renewable energy sector due to its application in solar evaporation for the production of solar salt. Furthermore, the market is expected to grow in the waste management sector due to the increasing focus on sustainable wastewater treatment methods that utilize sea salt.

Exclusive Customer Landscape

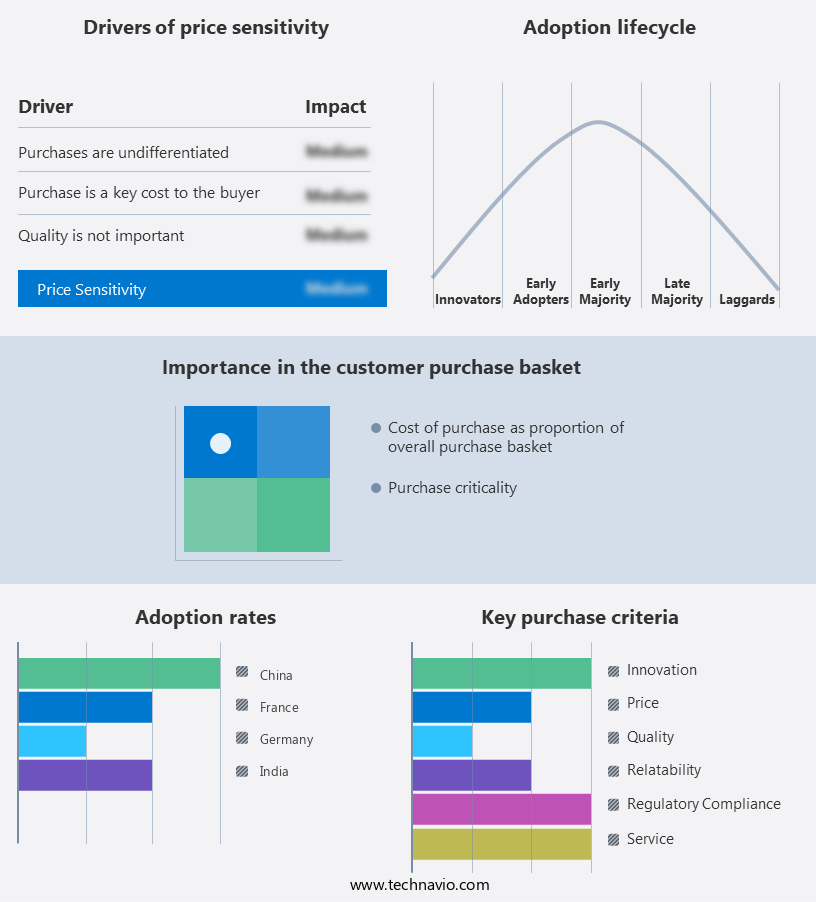
The market forecasting report includes the adoption lifecycle of the market, covering from the innovator's stage to the laggard's stage. It focuses on adoption rates in different regions based on penetration. Furthermore, the report also includes key purchase criteria and drivers of price sensitivity to help companies evaluate and develop their market growth analysis strategies.

Sea Salt Market Share by Geography

 Customer Landscape

Key Companies & Market Insights

Companies are implementing various strategies, such as strategic alliances, partnerships, mergers and acquisitions, geographical expansion, and product/service launches, to enhance their presence in the market.

Ahir Salt Industries: The company offers a variety of sea salt products which includes Food Grade and Industrial Grade sea salt, animal feed coarse salt, textile grade salt and others.

The market research and growth report includes detailed analyses of the competitive landscape of the market and information about key companies, including:

  • Cape Ann Sea Salt Co
  • Cargill Inc.
  • Cheetham Salt Ltd
  • Compania Espanola de Investigacion y Fomento Minero S A
  • Cornish Sea Salt Co. Ltd.
  • GURAVE Trade LLP
  • Isle of Skye Sea Salt Co Ltd
  • Israel Chemicals Ltd.
  • Ittefaq Trading Co
  • Jagannath Halogen Pvt Ltd
  • Maldon Crystal Salt Co Ltd
  • Misr Salt
  • Morton Salt Inc.
  • S.K.S.C. Nadarajan and Bror
  • Salt of the Haaretz Ltd
  • Sankhs and Surya Products
  • SKC Industries LLP
  • Tata Consumer Products Ltd.
  • True Salt LLC
  • V.A.S. Palappa Nadar Sons

Qualitative and quantitative analysis of companies has been conducted to help clients understand the wider business environment as well as the strengths and weaknesses of key market players. Data is qualitatively analyzed to categorize companies as pure play, category-focused, industry-focused, and diversified; it is quantitatively analyzed to categorize companies as dominant, leading, strong, tentative, and weak.

Research Analyst Overview

Sea salt, derived from seawater or mineral-rich brines, is a valuable commodity in various industries, including food, animal feed, and cosmetics. Proper labeling and fortifications are essential for sea salt to cater to diverse consumer needs, such as health-conscious individuals and those following specific diets like paleo. The transitioning lifestyles and events have led to increased demand for sea salt in the culinary industry, horeca sector, and experimental cuisine. Sea salt, a natural product obtained from the evaporation of seawater, holds a significant market position due to its various applications in human food, animal feed, agriculture, industrial water treatment, cosmetics, and the culinary industry. Logistics costs and de-carbonization efforts have driven the adoption of sustainable solutions like mechanical vapor recompressors (MVR) and electric boilers. Sea salt finds applications in human food, such as packaged rice, vegan cheese, pasta, bagels, spice shops, and seafood restaurants.

Furthermore, it is also used in animal feed and water treatment for its antimicrobial properties and natural coagulant capabilities. In the cosmetics industries, sea salt-based cosmetics offer mineral-infused flavors and health benefits, including digestion aid, immunity boost, and nourishing creams. Antimicrobial properties and use as a natural coagulant in water treatment add to its versatility. Its applications extend to animal feed, agriculture, and even luxury cosmetics. Sea salt's nutritional value and flavor enhancement properties make it an essential ingredient in food processing and chemical production. Its mineral content, including calcium, magnesium, and potassium, makes it an essential ingredient in animal feed. Sustainable production methods, such as solar evaporation and renewable energy, are gaining popularity to reduce costs and minimize environmental impact. Sea salt is also used in de-icing applications, water quality remineralization, and as a natural alternative to inorganic compounds in various industries.

Market Scope

Report Coverage

Details

Page number

199

Base year

2023

Historic period

2018-2022

Forecast period

2024-2028

Growth momentum & CAGR

Accelerate at a CAGR of 3.7%

Market growth 2024-2028

USD 3.64 billion

Market structure

Fragmented

YoY growth 2023-2024(%)

3.5

Regional analysis

APAC, Europe, North America, South America, and Middle East and Africa

Performing market contribution

APAC at 55%

Key countries

China, India, Germany, and France

Competitive landscape

Leading Companies, Market Positioning of Companies, Competitive Strategies, and Industry Risks

Key companies profiled

Ahir Salt Industries, Cape Ann Sea Salt Co, Cargill Inc., Cheetham Salt Ltd, Compania Espanola de Investigacion y Fomento Minero S A, Cornish Sea Salt Co. Ltd., GURAVE Trade LLP, Isle of Skye Sea Salt Co Ltd, Israel Chemicals Ltd., Ittefaq Trading Co, Jagannath Halogen Pvt Ltd, Maldon Crystal Salt Co Ltd, Misr Salt, Morton Salt Inc., S.K.S.C. Nadarajan and Bror, Salt of the Haaretz Ltd, Sankhs and Surya Products, SKC Industries LLP, Tata Consumer Products Ltd., True Salt LLC, and V.A.S. Palappa Nadar Sons

Market dynamics

Parent market analysis, market growth inducers and obstacles, market forecast, fast-growing and slow-growing segment analysis, COVID-19 impact and recovery analysis and future consumer dynamics, market condition analysis for the forecast period

Customization purview

If our market report has not included the data that you are looking for, you can reach out to our analysts and get segments customized.

Request Free Sample

What are the Key Data Covered in this Market Research and Growth Report?

  • CAGR of the market during the forecast period
  • Detailed information on factors that will drive the market growth and forecasting between 2024 and 2028
  • Precise estimation of the size of the market  and its contribution of the market in focus to the parent market
  • Accurate predictions about upcoming market growth and trends and changes in consumer behaviour
  • Growth of the market across APAC, Europe, North America, South America, and Middle East and Africa
  • Thorough analysis of the market's competitive landscape and detailed information about companies
  • Comprehensive analysis of factors that will challenge the growth of market companies

We can help! Our analysts can customize this market research report to meet your requirements. Get in touch

1 Executive Summary

  • 1.1 Market overview
    • Executive Summary - Chart on Market Overview
    • Executive Summary - Data Table on Market Overview
    • Executive Summary - Chart on Global Market Characteristics
    • Executive Summary - Chart on Market by Geography
    • Executive Summary - Chart on Market Segmentation by Type
    • Executive Summary - Chart on Market Segmentation by Application
    • Executive Summary - Chart on Incremental Growth
    • Executive Summary - Data Table on Incremental Growth
    • Executive Summary - Chart on Company Market Positioning

2 Technavio Analysis

  • 2.1 Analysis of price sensitivity, lifecycle, customer purchase basket, adoption rates, and purchase criteria
    • Analysis of price sensitivity, lifecycle, customer purchase basket, adoption rates, and purchase criteria
  • 2.2 Criticality of inputs and Factors of differentiation
    • Overview on criticality of inputs and factors of differentiation
  • 2.3 Factors of disruption
    • Overview on factors of disruption
  • 2.4 Impact of drivers and challenges
    • Impact of drivers and challenges in 2023 and 2028

3 Market Landscape

  • 3.1 Market ecosystem
    • Parent Market
    • Data Table on - Parent Market
  • 3.2 Market characteristics
    • Market characteristics analysis
  • 3.3 Value chain analysis
    • Value Chain Analysis

4 Market Sizing

  • 4.1 Market definition
    • Offerings of companies included in the market definition
  • 4.2 Market segment analysis
    • Market segments
  • 4.3 Market size 2023
    • 4.4 Market outlook: Forecast for 2023-2028
      • Chart on Global - Market size and forecast 2023-2028 ($ million)
      • Data Table on Global - Market size and forecast 2023-2028 ($ million)
      • Chart on Global Market: Year-over-year growth 2023-2028 (%)
      • Data Table on Global Market: Year-over-year growth 2023-2028 (%)

    5 Historic Market Size

    • 5.1 Global Sea Salt Market 2018 - 2022
      • Historic Market Size - Data Table on Global Sea Salt Market 2018 - 2022 ($ million)
    • 5.2 Type segment analysis 2018 - 2022
      • Historic Market Size - Type Segment 2018 - 2022 ($ million)
    • 5.3 Application segment analysis 2018 - 2022
      • Historic Market Size - Application Segment 2018 - 2022 ($ million)
    • 5.4 Geography segment analysis 2018 - 2022
      • Historic Market Size - Geography Segment 2018 - 2022 ($ million)
    • 5.5 Country segment analysis 2018 - 2022
      • Historic Market Size - Country Segment 2018 - 2022 ($ million)

    6 Qualitative Analysis

    • 6.1 Impact of AI on the Global Sea Salt Market

      7 Five Forces Analysis

      • 7.1 Five forces summary
        • Five forces analysis - Comparison between 2023 and 2028
      • 7.2 Bargaining power of buyers
        • Bargaining power of buyers - Impact of key factors 2023 and 2028
      • 7.3 Bargaining power of suppliers
        • Bargaining power of suppliers - Impact of key factors in 2023 and 2028
      • 7.4 Threat of new entrants
        • Threat of new entrants - Impact of key factors in 2023 and 2028
      • 7.5 Threat of substitutes
        • Threat of substitutes - Impact of key factors in 2023 and 2028
      • 7.6 Threat of rivalry
        • Threat of rivalry - Impact of key factors in 2023 and 2028
      • 7.7 Market condition
        • Chart on Market condition - Five forces 2023 and 2028

      8 Market Segmentation by Type

      • 8.1 Market segments
        • Chart on Type - Market share 2023-2028 (%)
        • Data Table on Type - Market share 2023-2028 (%)
      • 8.2 Comparison by Type
        • Chart on Comparison by Type
        • Data Table on Comparison by Type
      • 8.3 Fine grains - Market size and forecast 2023-2028
        • Chart on Fine grains - Market size and forecast 2023-2028 ($ million)
        • Data Table on Fine grains - Market size and forecast 2023-2028 ($ million)
        • Chart on Fine grains - Year-over-year growth 2023-2028 (%)
        • Data Table on Fine grains - Year-over-year growth 2023-2028 (%)
      • 8.4 Crystal - Market size and forecast 2023-2028
        • Chart on Crystal - Market size and forecast 2023-2028 ($ million)
        • Data Table on Crystal - Market size and forecast 2023-2028 ($ million)
        • Chart on Crystal - Year-over-year growth 2023-2028 (%)
        • Data Table on Crystal - Year-over-year growth 2023-2028 (%)
      • 8.5 Market opportunity by Type
        • Market opportunity by Type ($ million)
        • Data Table on Market opportunity by Type ($ million)

      9 Market Segmentation by Application

      • 9.1 Market segments
        • Chart on Application - Market share 2023-2028 (%)
        • Data Table on Application - Market share 2023-2028 (%)
      • 9.2 Comparison by Application
        • Chart on Comparison by Application
        • Data Table on Comparison by Application
      • 9.3 Food - Market size and forecast 2023-2028
        • Chart on Food - Market size and forecast 2023-2028 ($ million)
        • Data Table on Food - Market size and forecast 2023-2028 ($ million)
        • Chart on Food - Year-over-year growth 2023-2028 (%)
        • Data Table on Food - Year-over-year growth 2023-2028 (%)
      • 9.4 Industrial - Market size and forecast 2023-2028
        • Chart on Industrial - Market size and forecast 2023-2028 ($ million)
        • Data Table on Industrial - Market size and forecast 2023-2028 ($ million)
        • Chart on Industrial - Year-over-year growth 2023-2028 (%)
        • Data Table on Industrial - Year-over-year growth 2023-2028 (%)
      • 9.5 Market opportunity by Application
        • Market opportunity by Application ($ million)
        • Data Table on Market opportunity by Application ($ million)

      10 Customer Landscape

      • 10.1 Customer landscape overview
        • Analysis of price sensitivity, lifecycle, customer purchase basket, adoption rates, and purchase criteria

      11 Geographic Landscape

      • 11.1 Geographic segmentation
        • Chart on Market share by geography 2023-2028 (%)
        • Data Table on Market share by geography 2023-2028 (%)
      • 11.2 Geographic comparison
        • Chart on Geographic comparison
        • Data Table on Geographic comparison
      • 11.3 APAC - Market size and forecast 2023-2028
        • Chart on APAC - Market size and forecast 2023-2028 ($ million)
        • Data Table on APAC - Market size and forecast 2023-2028 ($ million)
        • Chart on APAC - Year-over-year growth 2023-2028 (%)
        • Data Table on APAC - Year-over-year growth 2023-2028 (%)
      • 11.4 Europe - Market size and forecast 2023-2028
        • Chart on Europe - Market size and forecast 2023-2028 ($ million)
        • Data Table on Europe - Market size and forecast 2023-2028 ($ million)
        • Chart on Europe - Year-over-year growth 2023-2028 (%)
        • Data Table on Europe - Year-over-year growth 2023-2028 (%)
      • 11.5 North America - Market size and forecast 2023-2028
        • Chart on North America - Market size and forecast 2023-2028 ($ million)
        • Data Table on North America - Market size and forecast 2023-2028 ($ million)
        • Chart on North America - Year-over-year growth 2023-2028 (%)
        • Data Table on North America - Year-over-year growth 2023-2028 (%)
      • 11.6 South America - Market size and forecast 2023-2028
        • Chart on South America - Market size and forecast 2023-2028 ($ million)
        • Data Table on South America - Market size and forecast 2023-2028 ($ million)
        • Chart on South America - Year-over-year growth 2023-2028 (%)
        • Data Table on South America - Year-over-year growth 2023-2028 (%)
      • 11.7 Middle East and Africa - Market size and forecast 2023-2028
        • Chart on Middle East and Africa - Market size and forecast 2023-2028 ($ million)
        • Data Table on Middle East and Africa - Market size and forecast 2023-2028 ($ million)
        • Chart on Middle East and Africa - Year-over-year growth 2023-2028 (%)
        • Data Table on Middle East and Africa - Year-over-year growth 2023-2028 (%)
      • 11.8 China - Market size and forecast 2023-2028
        • Chart on China - Market size and forecast 2023-2028 ($ million)
        • Data Table on China - Market size and forecast 2023-2028 ($ million)
        • Chart on China - Year-over-year growth 2023-2028 (%)
        • Data Table on China - Year-over-year growth 2023-2028 (%)
      • 11.9 India - Market size and forecast 2023-2028
        • Chart on India - Market size and forecast 2023-2028 ($ million)
        • Data Table on India - Market size and forecast 2023-2028 ($ million)
        • Chart on India - Year-over-year growth 2023-2028 (%)
        • Data Table on India - Year-over-year growth 2023-2028 (%)
      • 11.10 Germany - Market size and forecast 2023-2028
        • Chart on Germany - Market size and forecast 2023-2028 ($ million)
        • Data Table on Germany - Market size and forecast 2023-2028 ($ million)
        • Chart on Germany - Year-over-year growth 2023-2028 (%)
        • Data Table on Germany - Year-over-year growth 2023-2028 (%)
      • 11.11 France - Market size and forecast 2023-2028
        • Chart on France - Market size and forecast 2023-2028 ($ million)
        • Data Table on France - Market size and forecast 2023-2028 ($ million)
        • Chart on France - Year-over-year growth 2023-2028 (%)
        • Data Table on France - Year-over-year growth 2023-2028 (%)
      • 11.12 US - Market size and forecast 2023-2028
        • Chart on US - Market size and forecast 2023-2028 ($ million)
        • Data Table on US - Market size and forecast 2023-2028 ($ million)
        • Chart on US - Year-over-year growth 2023-2028 (%)
        • Data Table on US - Year-over-year growth 2023-2028 (%)
      • 11.13 Japan - Market size and forecast 2023-2028
        • Chart on Japan - Market size and forecast 2023-2028 ($ million)
        • Data Table on Japan - Market size and forecast 2023-2028 ($ million)
        • Chart on Japan - Year-over-year growth 2023-2028 (%)
        • Data Table on Japan - Year-over-year growth 2023-2028 (%)
      • 11.14 Brazil - Market size and forecast 2023-2028
        • Chart on Brazil - Market size and forecast 2023-2028 ($ million)
        • Data Table on Brazil - Market size and forecast 2023-2028 ($ million)
        • Chart on Brazil - Year-over-year growth 2023-2028 (%)
        • Data Table on Brazil - Year-over-year growth 2023-2028 (%)
      • 11.15 Italy - Market size and forecast 2023-2028
        • Chart on Italy - Market size and forecast 2023-2028 ($ million)
        • Data Table on Italy - Market size and forecast 2023-2028 ($ million)
        • Chart on Italy - Year-over-year growth 2023-2028 (%)
        • Data Table on Italy - Year-over-year growth 2023-2028 (%)
      • 11.16 South Korea - Market size and forecast 2023-2028
        • Chart on South Korea - Market size and forecast 2023-2028 ($ million)
        • Data Table on South Korea - Market size and forecast 2023-2028 ($ million)
        • Chart on South Korea - Year-over-year growth 2023-2028 (%)
        • Data Table on South Korea - Year-over-year growth 2023-2028 (%)
      • 11.17 Spain - Market size and forecast 2023-2028
        • Chart on Spain - Market size and forecast 2023-2028 ($ million)
        • Data Table on Spain - Market size and forecast 2023-2028 ($ million)
        • Chart on Spain - Year-over-year growth 2023-2028 (%)
        • Data Table on Spain - Year-over-year growth 2023-2028 (%)
      • 11.18 Market opportunity by geography
        • Market opportunity by geography ($ million)
        • Data Tables on Market opportunity by geography ($ million)

      12 Drivers, Challenges, and Opportunity/Restraints

      • 12.1 Market drivers
        • 12.2 Market challenges
          • 12.3 Impact of drivers and challenges
            • Impact of drivers and challenges in 2023 and 2028
          • 12.4 Market opportunities/restraints

            13 Competitive Landscape

            • 13.1 Overview
              • 13.2 Competitive Landscape
                • Overview on criticality of inputs and factors of differentiation
              • 13.3 Landscape disruption
                • Overview on factors of disruption
              • 13.4 Industry risks
                • Impact of key risks on business

              14 Competitive Analysis

              • 14.1 Companies profiled
                • Companies covered
              • 14.2 Company ranking index
                • Company ranking index
              • 14.3 Market positioning of companies
                • Matrix on companies position and classification
              • 14.4 Ahir Salt Industries
                • Ahir Salt Industries - Overview
                • Ahir Salt Industries - Product / Service
                • Ahir Salt Industries - Key offerings
                • SWOT
              • 14.5 Cape Ann Sea Salt Co
                • Cape Ann Sea Salt Co - Overview
                • Cape Ann Sea Salt Co - Product / Service
                • Cape Ann Sea Salt Co - Key offerings
                • SWOT
              • 14.6 Cargill Inc.
                • Cargill Inc. - Overview
                • Cargill Inc. - Product / Service
                • Cargill Inc. - Key offerings
                • SWOT
              • 14.7 Cheetham Salt Ltd
                • Cheetham Salt Ltd - Overview
                • Cheetham Salt Ltd - Product / Service
                • Cheetham Salt Ltd - Key offerings
                • SWOT
              • 14.8 Compania Espanola de Investigacion y Fomento Minero S A
                • Compania Espanola de Investigacion y Fomento Minero S A - Overview
                • Compania Espanola de Investigacion y Fomento Minero S A - Product / Service
                • Compania Espanola de Investigacion y Fomento Minero S A - Key offerings
                • SWOT
              • 14.9 GURAVE Trade LLP
                • GURAVE Trade LLP - Overview
                • GURAVE Trade LLP - Product / Service
                • GURAVE Trade LLP - Key offerings
                • SWOT
              • 14.10 Isle of Skye Sea Salt Co Ltd
                • Isle of Skye Sea Salt Co Ltd - Overview
                • Isle of Skye Sea Salt Co Ltd - Product / Service
                • Isle of Skye Sea Salt Co Ltd - Key offerings
                • SWOT
              • 14.11 Israel Chemicals Ltd.
                • Israel Chemicals Ltd. - Overview
                • Israel Chemicals Ltd. - Business segments
                • Israel Chemicals Ltd. - Key offerings
                • Israel Chemicals Ltd. - Segment focus
                • SWOT
              • 14.12 Maldon Crystal Salt Co Ltd
                • Maldon Crystal Salt Co Ltd - Overview
                • Maldon Crystal Salt Co Ltd - Product / Service
                • Maldon Crystal Salt Co Ltd - Key offerings
                • SWOT
              • 14.13 Misr Salt
                • Misr Salt - Overview
                • Misr Salt - Product / Service
                • Misr Salt - Key offerings
                • SWOT
              • 14.14 Morton Salt Inc.
                • Morton Salt Inc. - Overview
                • Morton Salt Inc. - Product / Service
                • Morton Salt Inc. - Key offerings
                • SWOT
              • 14.15 S.K.S.C. Nadarajan and Bror
                • S.K.S.C. Nadarajan and Bror - Overview
                • S.K.S.C. Nadarajan and Bror - Product / Service
                • S.K.S.C. Nadarajan and Bror - Key offerings
                • SWOT
              • 14.16 Salt of the Haaretz Ltd
                • Salt of the Haaretz Ltd - Overview
                • Salt of the Haaretz Ltd - Product / Service
                • Salt of the Haaretz Ltd - Key offerings
                • SWOT
              • 14.17 SKC Industries LLP
                • SKC Industries LLP - Overview
                • SKC Industries LLP - Product / Service
                • SKC Industries LLP - Key offerings
                • SWOT
              • 14.18 Tata Consumer Products Ltd.
                • Tata Consumer Products Ltd. - Overview
                • Tata Consumer Products Ltd. - Business segments
                • Tata Consumer Products Ltd. - Key news
                • Tata Consumer Products Ltd. - Key offerings
                • Tata Consumer Products Ltd. - Segment focus
                • SWOT

              15 Appendix

              • 15.1 Scope of the report
                • 15.2 Inclusions and exclusions checklist
                  • Inclusions checklist
                  • Exclusions checklist
                • 15.3 Currency conversion rates for US$
                  • Currency conversion rates for US$
                • 15.4 Research methodology
                  • Research methodology
                • 15.5 Data procurement
                  • Information sources
                • 15.6 Data validation
                  • Data validation
                • 15.7 Validation techniques employed for market sizing
                  • Validation techniques employed for market sizing
                • 15.8 Data synthesis
                  • Data synthesis
                • 15.9 360 degree market analysis
                  • 360 degree market analysis
                • 15.10 List of abbreviations
                  • List of abbreviations
                  • o Expand into international markets

                Research Methodology

                Technavio presents a detailed picture of the market by way of study, synthesis, and summation of data from multiple sources. The analysts have presented the various facets of the market with a particular focus on identifying the key industry influencers. The data thus presented is comprehensive, reliable, and the result of extensive research, both primary and secondary.

                INFORMATION SOURCES

                Primary sources

                • Manufacturers and suppliers
                • Channel partners
                • Industry experts
                • Strategic decision makers

                Secondary sources

                • Industry journals and periodicals
                • Government data
                • Financial reports of key industry players
                • Historical data
                • Press releases

                DATA ANALYSIS

                Data Synthesis

                • Collation of data
                • Estimation of key figures
                • Analysis of derived insights

                Data Validation

                • Triangulation with data models
                • Reference against proprietary databases
                • Corroboration with industry experts

                REPORT WRITING

                Qualitative

                • Market drivers
                • Market challenges
                • Market trends
                • Five forces analysis

                Quantitative

                • Market size and forecast
                • Market segmentation
                • Geographical insights
                • Competitive landscape

                Interested in this report?

                Get your sample now to see our research methodology and insights!

                Download Now

                Frequently Asked Questions

                Sea Salt market growth will increase by $ 3643.6 mn during 2024-2028 .

                The Sea Salt market is expected to grow at a CAGR of 3.7% during 2024-2028 .

                Sea Salt market is segmented by Type( Fine grains, Crystal) Application( Food, Industrial)

                Ahir Salt Industries, Cape Ann Sea Salt Co, Cargill Inc., Cheetham Salt Ltd, Compania Espanola de Investigacion y Fomento Minero S A, Cornish Sea Salt Co. Ltd., GURAVE Trade LLP, Isle of Skye Sea Salt Co Ltd, Israel Chemicals Ltd., Ittefaq Trading Co, Jagannath Halogen Pvt Ltd, Maldon Crystal Salt Co Ltd, Misr Salt, Morton Salt Inc., S.K.S.C. Nadarajan and Bror, Salt of the Haaretz Ltd, Sankhs and Surya Products, SKC Industries LLP, Tata Consumer Products Ltd., True Salt LLC, V.A.S. Palappa Nadar Sons are a few of the key vendors in the Sea Salt market.

                APAC will register the highest growth rate of 55% among the other regions. Therefore, the Sea Salt market in APAC is expected to garner significant business opportunities for the vendors during the forecast period.

                China, India, Germany, France

                • Growing demand for processed foodsThe global sea salt market is experiencing a significant boost due to the rising demand for processed foods. Various chemical and mechanical processes are employed in food processing is the driving factor this market.
                • with salt is the driving factor this market.
                • including sea salt is the driving factor this market.
                • being a crucial ingredient. Processed foods are favored over whole foods for their enhanced taste is the driving factor this market.
                • appearance is the driving factor this market.
                • and texture is the driving factor this market.
                • which appeal to a broad consumer base.In rapidly developing countries such as China and India is the driving factor this market.
                • economic growth and increased disposable incomes have led to a surge in demand for convenient processed food products. The expanding working population in regions such as the APAC is also contributing to this trend is the driving factor this market.
                • as busy lifestyles drive the preference for ready-to-eat and easy-to-prepare food items.The growth of the food processing industry in these developed economies has is the driving factor this market.
                • in turn is the driving factor this market.
                • escalated the demand for sea salt. India is the driving factor this market.
                • one of the largest and fastest-growing economies in the world. The food processing industry in India significantly contributes to economic growth and food security. With its rich agricultural resources is the driving factor this market.
                • India is a major global producer of various food commodities is the driving factor this market.
                • including milk is the driving factor this market.
                • millet is the driving factor this market.
                • grains is the driving factor this market.
                • fruits is the driving factor this market.
                • vegetables is the driving factor this market.
                • tea is the driving factor this market.
                • and fish. This robust agricultural foundation supports a thriving food processing sector. Agri-food exports in India reached an impressive $46.4 billion in the 2023-2024 financial year is the driving factor this market.
                • underscoring the rapid growth of sector and increasing global influence. The share of processed food in total agri-food exports has risen substantially is the driving factor this market.
                • from $4.90 billion in 2014-15 to $10.88 billion in 2023-24.Thus is the driving factor this market.
                • the increased demand for processed foods is a key driver for the global sea salt market is the driving factor this market.
                • fueled by economic growth is the driving factor this market.
                • rising disposable incomes is the driving factor this market.
                • and the expanding food processing sector in major economies such as India and China. This in turn will drive the market in focus during the forecast period. is the driving factor this market.

                The Sea Salt market vendors should focus on grabbing business opportunities from the Fine grains segment as it accounted for the largest market share in the base year.