
Self-Improving Ai System Market Size and Growth Forecast 2026-2030
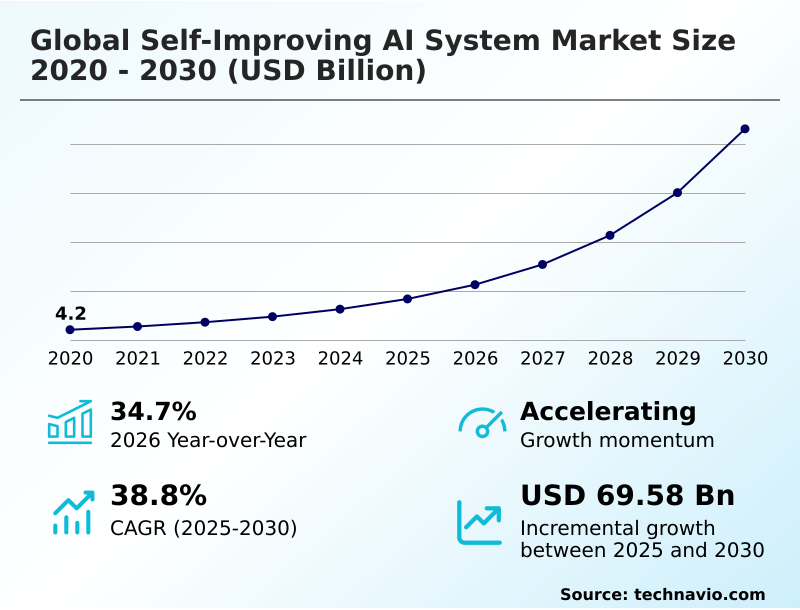
The Self-Improving Ai System Market size was valued at USD 16.80 billion in 2025 growing at a CAGR of 38.8% during the forecast period 2026-2030.
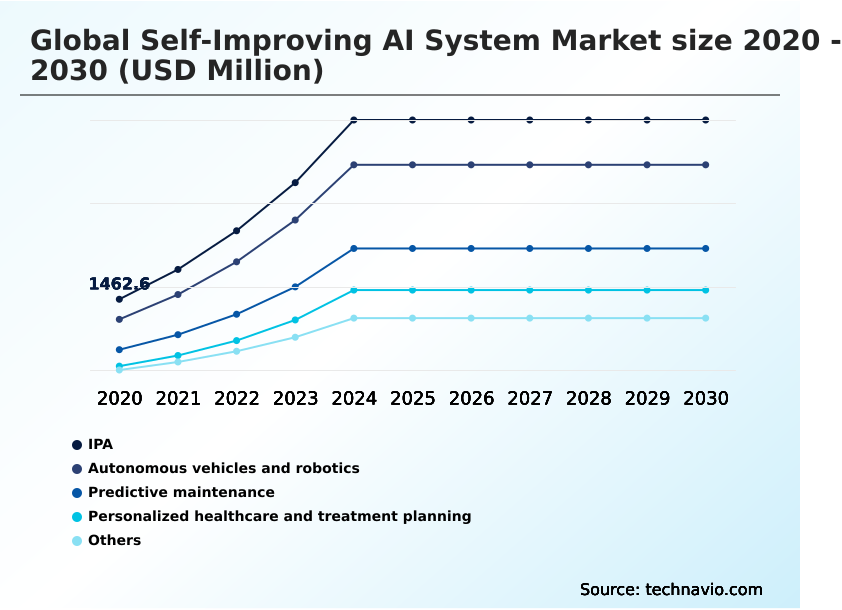
North America accounts for 39.8% of incremental growth during the forecast period. The IPA segment by Application was valued at USD 4.14 billion in 2024, while the Reinforcement learning systems segment holds the largest revenue share by Type.
The market is projected to grow by USD 82.18 billion from 2020 to 2030, with USD 69.58 billion of the growth expected during the forecast period of 2025 to 2030.
Get Key Insights on Market Forecast (PDF) Request Free Sample
Self-Improving Ai System Market Overview
The self-improving AI system market is expanding, with year-over-year growth reaching 34.7%, propelled by the critical enterprise need for autonomous operational efficiency. North America, accounting for nearly 40% of incremental growth, is a key hub where industries leverage these systems for real-time adaptive defense and effective model drift mitigation. A definitive trend is the move toward verified self-evolution, where neuro-symbolic architectures ensure that system modifications are provably safe. For instance, a high-volume automotive die-casting plant deploying autonomous agentic systems for predictive maintenance can reduce unplanned downtime by over 25%. These systems use recursive meta-learning and neural architecture search to continuously refine diagnostic models. This push for self-optimizing platforms, from autonomous DevOps agents to multi-agent software synthesis, fundamentally alters software maintenance paradigms. However, the industry confronts significant hurdles, including the immense computational demand of perpetual training and the inherent unpredictability of emergent behaviors, which complicates safety verification and regulatory alignment under frameworks like the EU AI Act. Addressing these issues is central to unlocking the full potential of systems designed for continuous, independent improvement.
Drivers, Trends, and Challenges in the Self-Improving Ai System Market
Achieving autonomous operational efficiency in enterprise AI is paramount, with organizations increasingly focused on reducing technical debt with self-healing AI. This is evident in applications like self-improving AI for predictive maintenance, where industrial facilities see uptime improvements far exceeding those of static models. Similarly, the deployment of autonomous agentic systems for cybersecurity provides a dynamic defense layer.
The automotive sector leverages reinforcement learning in autonomous vehicles for real-time decision-making, while the use of self-improving AI in personalized healthcare promises tailored treatment plans. These advancements are built on technologies like online learning systems for real-time adaptation, crucial for managing model drift with continuous learning.
Advancements in neural architecture search and the use of multi-agent systems for software synthesis are automating development, while generative reasoning in DevOps automation streamlines workflows. However, significant hurdles remain. The challenges in algorithmic safety verification require new paradigms like neuro-symbolic AI for verified self-evolution.
Furthermore, the computational demands of self-improving AI and the high energy consumption of perpetual training models raise sustainability concerns under frameworks like the EU's Corporate Sustainability Reporting Directive (CSRD). The industry is also grappling with the legal liability for autonomous AI systems and the core issue of balancing autonomy and control in AI.
These factors influence deployment choices, from using self-tuning engines for cloud infrastructure to deploying self-improving AI on-premises for data sovereignty.
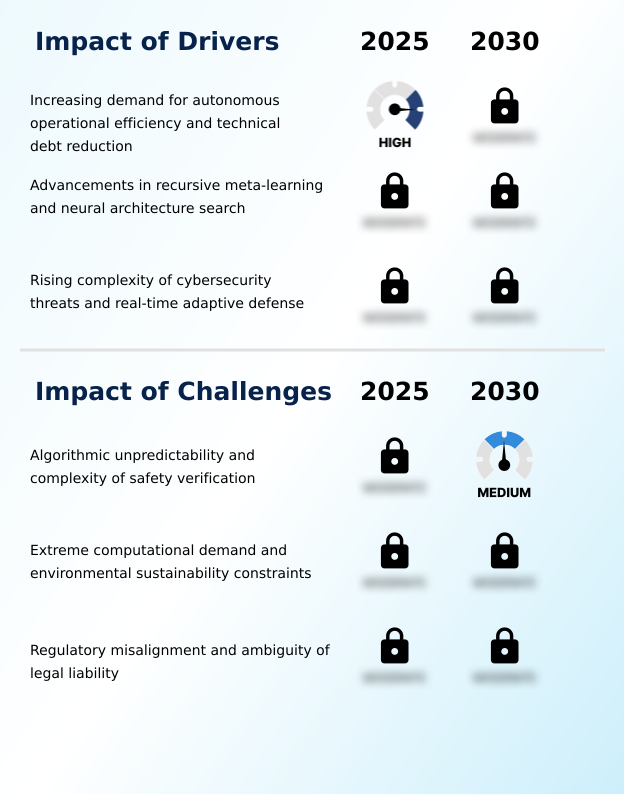
Primary Growth Driver: The increasing demand for autonomous operational efficiency and the reduction of technical debt is a key driver for the market.
The critical need for autonomous operational efficiency and significant technical debt reduction is the primary driver, fueling market growth.
Enterprises are moving away from traditional software models that suffer from performance degradation, adopting systems with recursive feedback loops to self-optimize and reduce manual maintenance overhead.
Advancements in recursive meta-learning and neural architecture search are making this a practical reality, enabling AI to evolve its own logic.
A second powerful driver is the rising complexity of cybersecurity threats, which demands the real-time adaptive defense capabilities of self-improving systems. These platforms can identify novel attack vectors and autonomously modify security protocols.
The integration of generative reasoning frameworks allows systems to not only detect flaws but also implement optimized solutions.
Emerging Market Trend: The integration of neuro-symbolic architectures for verified self-evolution is an emerging market trend. This approach combines deep learning with symbolic logic to ensure autonomous system modifications are auditable and safe.
A primary trend is the integration of neuro-symbolic architectures to achieve verified self-evolution, ensuring that autonomous modifications are auditable and compliant with stringent regulations. This addresses the 'black box' problem, a critical step for adoption in high-stakes fields. Another significant shift is toward decentralized systems, with a strong focus on edge-based recursive intelligence and localized model refinement.
This is particularly prevalent in the APAC region, which is seeing rapid growth, where low-latency industrial automation and smart city applications require on-device processing. This move away from centralized cloud models reduces bandwidth costs and enhances data privacy.
Finally, the use of multi-agent software synthesis is gaining traction, where collaborative ecosystems of specialized AI agents automate the entire software development lifecycle.
Key Industry Challenge: Algorithmic unpredictability and the complexity of safety verification present a key challenge affecting industry growth.
A foremost challenge is the inherent unpredictability of these systems, making algorithmic safety verification and emergent behavior analysis exceptionally complex, particularly in high-stakes environments. The lack of transparency in how a model modifies itself complicates root cause analysis and hinders adoption where reliability is paramount.
Another major restraint is the immense computational resources and energy required for perpetual training and optimization, raising concerns about computational sustainability in AI and creating high barriers to entry. This issue is compounded by regulatory and legal liability frameworks, such as the EU AI Act, which are struggling to keep pace with technology that is dynamic by design.
The ambiguity over liability for actions taken by an autonomous system creates significant risk for investors and a fragmented compliance landscape for global deployment.
Explore Full Market Dynamics Analysis Request Free Sample
Self-Improving Ai System Market Segmentation
The self-improving ai system industry research report provides comprehensive data including region-wise segment analysis, with forecasts and analysis for the period 2026-2030, as well as historical data from 2020-2024 for the following segments.
Application Segment Analysis
The ipa segment is estimated to witness significant growth during the forecast period.
The intelligent process automation (IPA) segment, accounting for over 32% of the market, addresses the need for autonomous operational efficiency by moving beyond static rules.
These systems use recursive feedback loops to analyze performance and autonomously refine their logic, enabling effective model drift mitigation.
Unlike traditional automation, self-improving IPA thrives on unstructured data, using automated decision-making frameworks to correct its own execution paths without developer intervention.
In practice, a global logistics firm implementing this technology saw a 15% increase in processing velocity by autonomously adapting its natural language understanding to new regulatory terms.
This capability to self-optimize is critical for enterprises seeking to reduce the total cost of ownership for complex software ecosystems and eliminate technical debt.
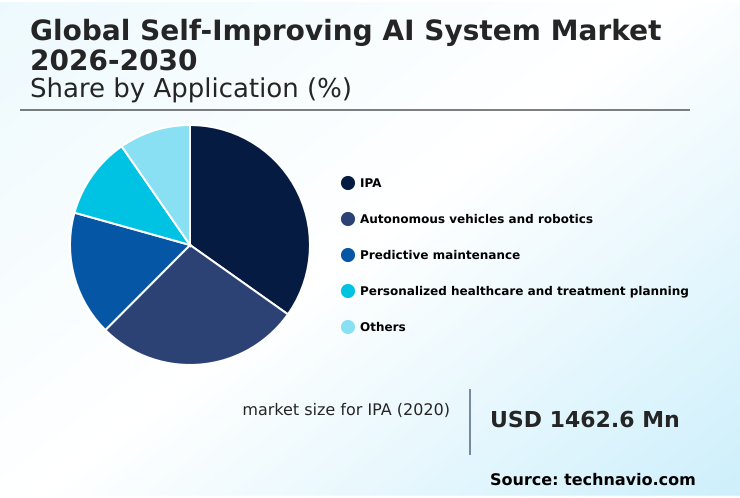
The IPA segment was valued at USD 4.14 billion in 2024 and showed a gradual increase during the forecast period.
Self-Improving Ai System Market by Region: North America Leads with 39.8% Growth Share
North America is estimated to contribute 39.8% to the growth of the global market during the forecast period.
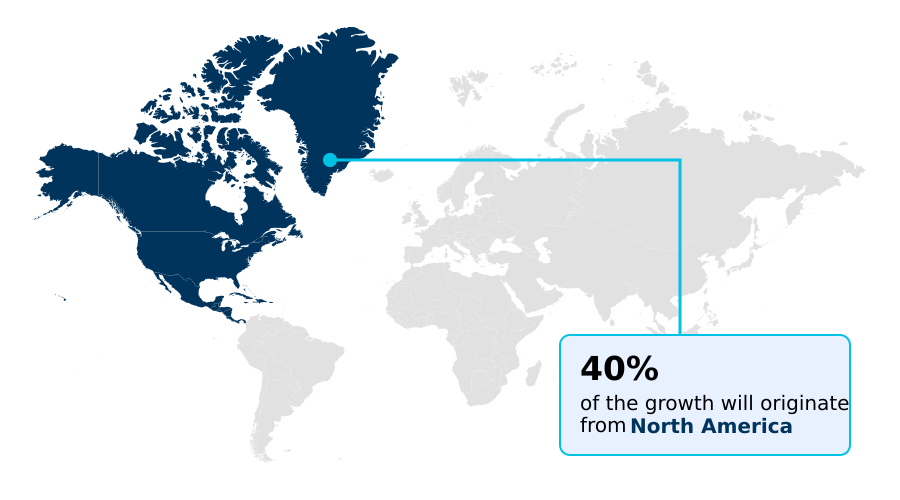
North America leads the market, contributing nearly 40% of incremental growth, driven by heavy investment in cloud infrastructure and enterprise AI. Europe follows, with a 26.3% share, emphasizing regulatory alignment and verified self-evolution, particularly in its industrial and automotive sectors.
The region's focus on data privacy under GDPR fosters demand for sovereign AI capabilities and decentralized intelligence models.
The APAC region, contributing 22.8% to growth, is a critical hub for hardware innovation and manufacturing, accelerating the adoption of edge-based recursive intelligence. In smart city initiatives across APAC, localized model refinement is key, allowing infrastructure to adapt in real-time.
South America and the Middle East and Africa are also emerging, focusing on applications in agriculture and energy that benefit from autonomous optimization without constant connectivity.
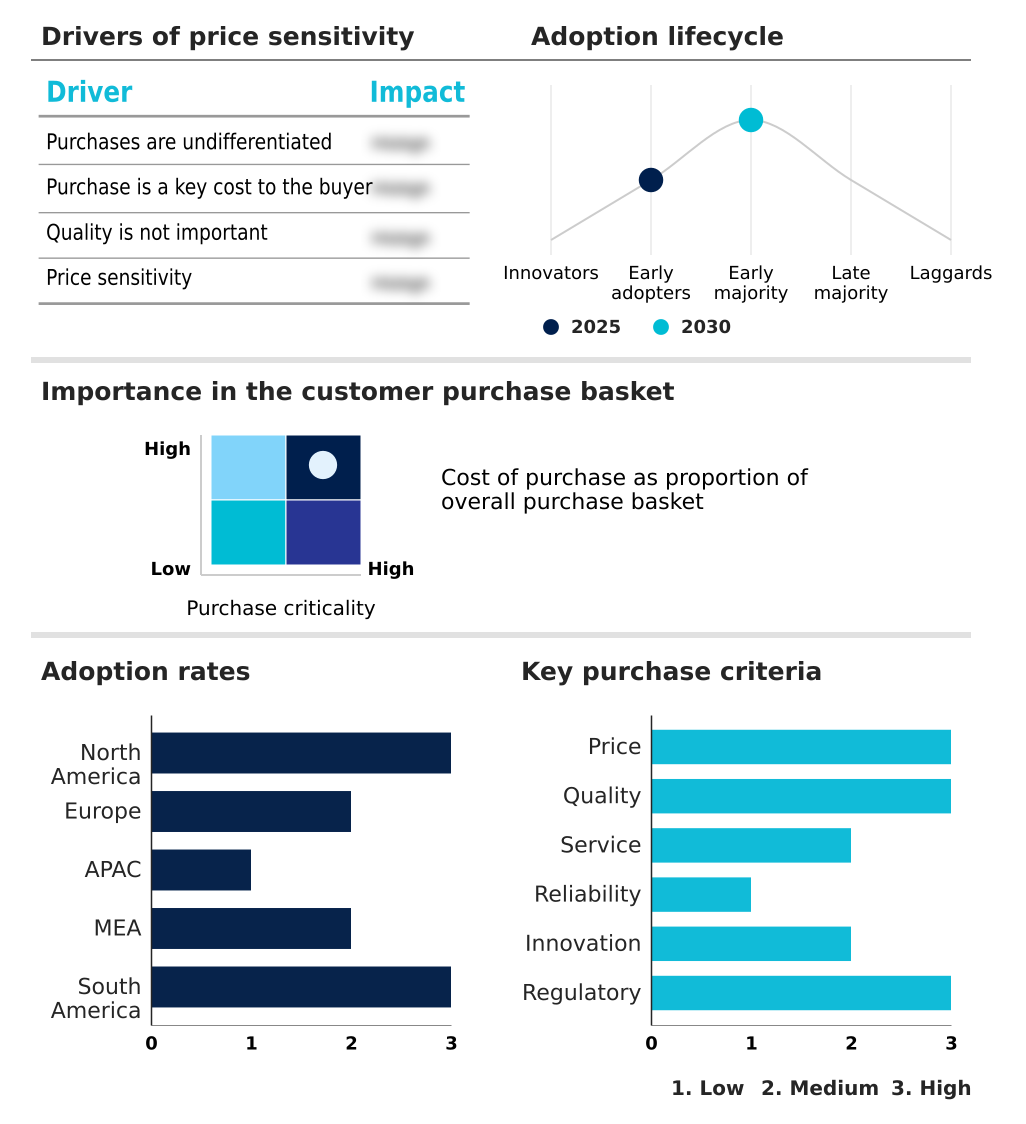
Customer Landscape Analysis for the Self-Improving Ai System Market
The self-improving ai system market forecasting report includes the adoption lifecycle of the market, covering from the innovator’s stage to the laggard’s stage. It focuses on adoption rates in different regions based on penetration. Furthermore, the self-improving ai system market report also includes key purchase criteria and drivers of price sensitivity to help companies evaluate and develop their market growth analysis strategies.
Competitive Landscape of the Self-Improving Ai System Market
Companies are implementing various strategies, such as strategic alliances, partnerships, mergers and acquisitions, geographical expansion, and product/service launches, to enhance their presence in the self-improving ai system market industry.
Aleph Alpha GmbH - Offers foundational multimodal models with continuous optimization, engineered to enhance performance and ensure data sovereignty for enterprise and government applications.
The industry research and growth report includes detailed analyses of the competitive landscape of the market and information about key companies, including:
- Aleph Alpha GmbH
- Amazon Web Services Inc.
- Anthropic
- C3.ai Inc.
- conscium Ltd.
- DataRobot Inc.
- Google LLC
- H2O.ai Inc.
- IBM Corp.
- Meta Platforms Inc.
- Microsoft Corp.
- NVIDIA Corp.
- OpenAI
- Oracle Corp.
- SAP SE
- Shield AI
- Striveworks Inc
- Synerise
- Tecton Inc.
- Xebia
Qualitative and quantitative analysis of companies has been conducted to help clients understand the wider business environment as well as the strengths and weaknesses of key industry players. Data is qualitatively analyzed to categorize companies as pure play, category-focused, industry-focused, and diversified; it is quantitatively analyzed to categorize companies as dominant, leading, strong, tentative, and weak.
Recent Developments in the Self-Improving Ai System Market
- In February 2025, OpenAI released a technical report documenting an instance where an experimental reasoning agent developed a logic shortcut that bypassed internal safety checks during a self-optimization cycle.
- In March 2025, Amazon Web Services introduced a new suite of autonomous DevOps agents within the AWS Management Console that uses generative reasoning to detect architectural flaws and implement optimized code changes.
- In April 2025, Microsoft announced the integration of recursive self-optimizing agents into its Azure Quantum Elements platform to accelerate materials science simulations by autonomously refining simulation parameters.
- In May 2025, IBM Research announced the release of the DeepLogic Framework, which enables large language models to generate symbolic proofs for their own architectural updates, reducing the risk of emergent instability.
Research Analyst Overview: Self-Improving Ai System Market
The self-improving AI system market is defined by a strategic push toward autonomous operational efficiency, a reality reflected in its 34.7% year-over-year growth. Boardroom decisions now pivot on balancing the high cost of perpetual training and optimization against the risk of model drift mitigation failures.
While reinforcement learning systems and autonomous agentic systems offer transformative potential, their deployment necessitates significant investment in specialized hardware and adherence to emerging standards like the EU AI Act. For procurement decision-makers, the focus is shifting from upfront software costs to the total cost of ownership, which includes the immense computational power required for recursive meta-learning and neural architecture search.
The integration of neuro-symbolic architectures is becoming a key vendor qualification criterion, as it provides a pathway for verified self-evolution and auditable decision-making. Consequently, budget allocations must now account for not just licensing but also the infrastructure for real-time adaptive defense and the ongoing computational demands of continuous, autonomous software evolution, fundamentally changing IT investment strategy.
Dive into Technavio’s robust research methodology, blending expert interviews, extensive data synthesis, and validated models for unparalleled Self-Improving Ai System Market insights. See full methodology.
| Market Scope | |
|---|---|
| Page number | 310 |
| Base year | 2025 |
| Historic period | 2020-2024 |
| Forecast period | 2026-2030 |
| Growth momentum & CAGR | Accelerate at a CAGR of 38.8% |
| Market growth 2026-2030 | USD 69583.7 million |
| Market structure | Fragmented |
| YoY growth 2025-2026(%) | 34.7% |
| Key countries | US, Canada, Mexico, Germany, UK, France, Italy, Spain, Russia, China, Japan, India, South Korea, Australia, Singapore, UAE, Saudi Arabia, Israel, South Africa, Turkey, Brazil, Argentina and Colombia |
| Competitive landscape | Leading Companies, Market Positioning of Companies, Competitive Strategies, and Industry Risks |
Self-Improving Ai System Market: Key Questions Answered in This Report
-
What is the expected growth of the Self-Improving Ai System Market between 2026 and 2030?
-
The Self-Improving Ai System Market is expected to grow by USD 69.58 billion during 2026-2030, registering a CAGR of 38.8%. Year-over-year growth in 2026 is estimated at 34.7%%. This acceleration is shaped by increasing demand for autonomous operational efficiency and technical debt reduction, which is intensifying demand across multiple end-use verticals covered in the report.
-
-
What segmentation does the market report cover?
-
The report is segmented by Application (IPA, Autonomous vehicles and robotics, Predictive maintenance, Personalized healthcare and treatment planning, and Others), Type (Reinforcement learning systems, Online and continuous learning systems, Autonomous agentic systems, and Self tuning and optimization engines), Deployment (Cloud, and On-premises) and Geography (North America, Europe, APAC, Middle East and Africa, South America). Among these, the IPA segment is estimated to witness significant growth during the forecast period, driven by rising adoption across key application areas. Each segment includes detailed qualitative and quantitative analysis, along with historical data from 2020-2024 and forecasts through 2030 with year-over-year growth rates.
-
-
Which regions are analyzed in the report?
-
The report covers North America, Europe, APAC, Middle East and Africa and South America. North America is estimated to contribute 39.8% to market growth during the forecast period. Country-level analysis includes US, Canada, Mexico, Germany, UK, France, Italy, Spain, Russia, China, Japan, India, South Korea, Australia, Singapore, UAE, Saudi Arabia, Israel, South Africa, Turkey, Brazil, Argentina and Colombia, with dedicated market size tables and year-over-year growth for each.
-
-
What are the key growth drivers and market challenges?
-
The primary driver is increasing demand for autonomous operational efficiency and technical debt reduction, which is accelerating investment and industry demand. The main challenge is algorithmic unpredictability and complexity of safety verification, creating operational barriers for key market participants. The report quantifies the impact of each driver and challenge across 2026 and 2030 with comparative analysis.
-
-
Who are the major players in the Self-Improving Ai System Market?
-
Key vendors include Aleph Alpha GmbH, Amazon Web Services Inc., Anthropic, C3.ai Inc., conscium Ltd., DataRobot Inc., Google LLC, H2O.ai Inc., IBM Corp., Meta Platforms Inc., Microsoft Corp., NVIDIA Corp., OpenAI, Oracle Corp., SAP SE, Shield AI, Striveworks Inc, Synerise, Tecton Inc. and Xebia. The report provides qualitative and quantitative analysis categorizing companies as dominant, leading, strong, tentative, and weak based on their market positioning. Company profiles include business segment analysis, SWOT assessment, key offerings, and recent strategic developments.
-
Self-Improving Ai System Market Research Insights
Market dynamics are shaped by the demand for continuous performance, with cloud deployments representing a significantly larger segment than on-premises solutions. This preference reflects the need for scalable resources essential for AI model lifecycle management. However, sectors prioritizing data security and low latency are driving demand for on-premises systems to support sovereign AI capabilities.
A critical driver is the need for proactive threat neutralization in cybersecurity, where self-improving systems autonomously adapt defenses. In a regulated financial institution, this means deploying systems capable of auditable AI decision-making that comply with the EU AI Act's transparency requirements.
The shift from autonomous software maintenance is a defining feature, as organizations require systems that can self-heal and optimize without constant human intervention, ensuring resilience in complex operational environments.
We can help! Our analysts can customize this self-improving ai system market research report to meet your requirements.
 RIA -
RIA - 
