Semiconductor Foundry Market Size 2025-2029
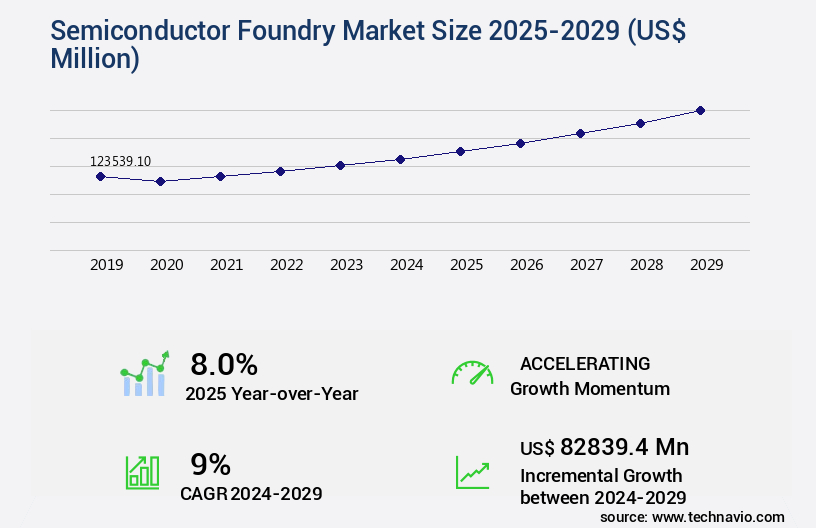
The semiconductor foundry market size is valued to increase USD 82.84 billion, at a CAGR of 9% from 2024 to 2029. Increasing demand for IoT in business will drive the semiconductor foundry market.
Major Market Trends & Insights
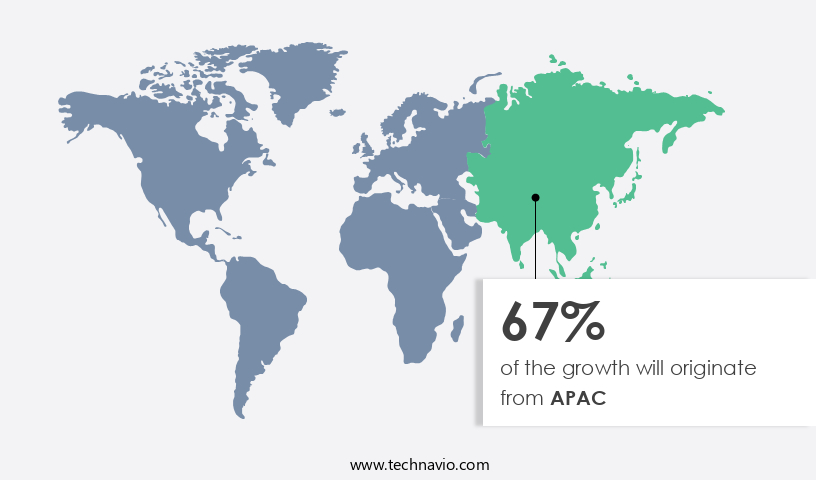
- APAC dominated the market and accounted for a 67% growth during the forecast period.
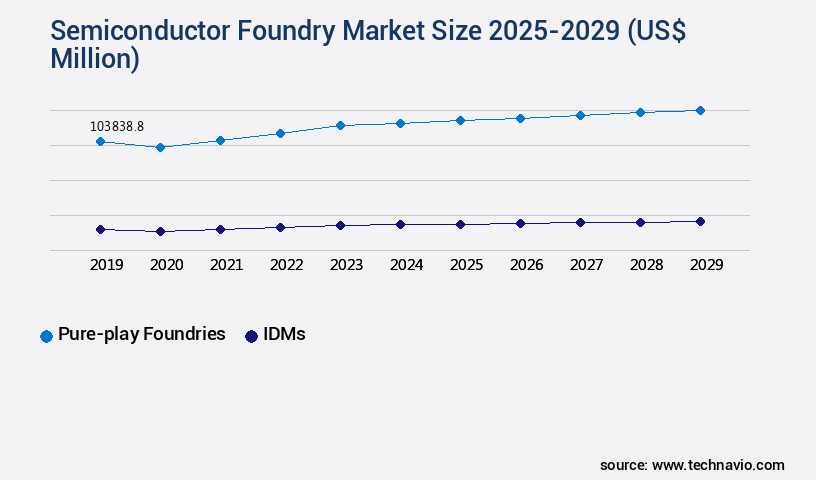
- By Type - Pure-play foundries segment was valued at USD 103.84 billion in 2023
- By Application - Communications segment accounted for the largest market revenue share in 2023
Market Size & Forecast
- Market Opportunities: USD 91.04 million
- Market Future Opportunities: USD 82839.40 million
- CAGR from 2024 to 2029 : 9%
Market Summary
- The market represents a dynamic and continually evolving landscape, driven by the increasing adoption of core technologies such as advanced analytics and the Internet of Things (IoT) in various industries. Semiconductor foundries, which produce customized semiconductor components for other companies, play a pivotal role in this market. According to a recent study, the semiconductor foundry services market is projected to account for over 30% of the global semiconductor market share by 2025. However, this market faces challenges due to the cyclic nature of semiconductor demand and the high fluctuations it brings.
- Despite these challenges, opportunities abound, particularly in the areas of automotive, industrial, and consumer electronics applications. The regulatory landscape also continues to evolve, with increasing focus on environmental sustainability and data security.
What will be the Size of the Semiconductor Foundry Market during the forecast period?
Get Key Insights on Market Forecast (PDF) Request Free Sample
How is the Semiconductor Foundry Market Segmented ?
The semiconductor foundry industry research report provides comprehensive data (region-wise segment analysis), with forecasts and estimates in "USD million" for the period 2025-2029, as well as historical data from 2019-2023 for the following segments.
- Type
- Pure-play foundries
- IDMs
- Application
- Communications
- PCs and desktop
- Consumers
- Automotive
- Others
- Technology
- 7nm and Below
- 10nm to 20nm
- 20nm to 45nm
- 45nm and above
- Geography
- North America
- US
- Canada
- Europe
- France
- Germany
- APAC
- China
- India
- Japan
- South Korea
- Taiwan
- South America
- Brazil
- Rest of World (ROW)
- North America
By Type Insights
The pure-play foundries segment is estimated to witness significant growth during the forecast period.
In the dynamic and evolving semiconductor industry, pure-play foundries have emerged as crucial players, specializing in the manufacturing of semiconductor devices for various clients. These entities, distinct from integrated device manufacturers (IDMs), focus exclusively on the fabrication process. Pure-play foundries cater to a diverse clientele, encompassing consumer electronics, automotive, telecommunications, industrial, and healthcare sectors. This broad customer base allows for risk mitigation, as market fluctuations in specific segments are balanced out, ensuring foundries' resilience to industry volatility. One significant factor contributing to the growth of pure-play foundries is the economies of scale they offer. Cleanroom environments are meticulously controlled to maintain contamination levels below acceptable thresholds, ensuring the highest quality manufacturing processes.
Manufacturing process control is stringently enforced through rigorous contamination control procedures, equipment maintenance protocols, and advanced lithography resolution enhancement techniques. Semiconductor material properties are characterized through materials characterization and critical dimension control to optimize fabrication processes. The semiconductor packaging process is an integral part of the foundry's offerings, employing failure analysis techniques and reliability testing methods to ensure product durability. Photolithography processes are employed to create integrated circuits, while wafer inspection systems are utilized for process control monitoring. Process integration challenges are addressed through process optimization techniques and yield enhancement strategies. Advanced packaging techniques, such as 3D chip stacking and wafer bonding methods, are employed to improve semiconductor device performance.
Chemical mechanical planarization and plasma etching methods are used to prepare the wafer surfaces for subsequent fabrication steps. Semiconductor metrology is employed to measure and monitor critical dimensions, while semiconductor device physics is used to understand the fundamental principles governing device behavior. The semiconductor industry anticipates a 15% increase in demand for pure-play foundry services in the next year, with a further 18% growth projection over the next five years. This growth is driven by the increasing adoption of advanced semiconductor technologies in various industries and the need for cost-effective manufacturing solutions. Despite these optimistic projections, process control monitoring and yield improvement strategies remain essential for maintaining competitiveness in the market.
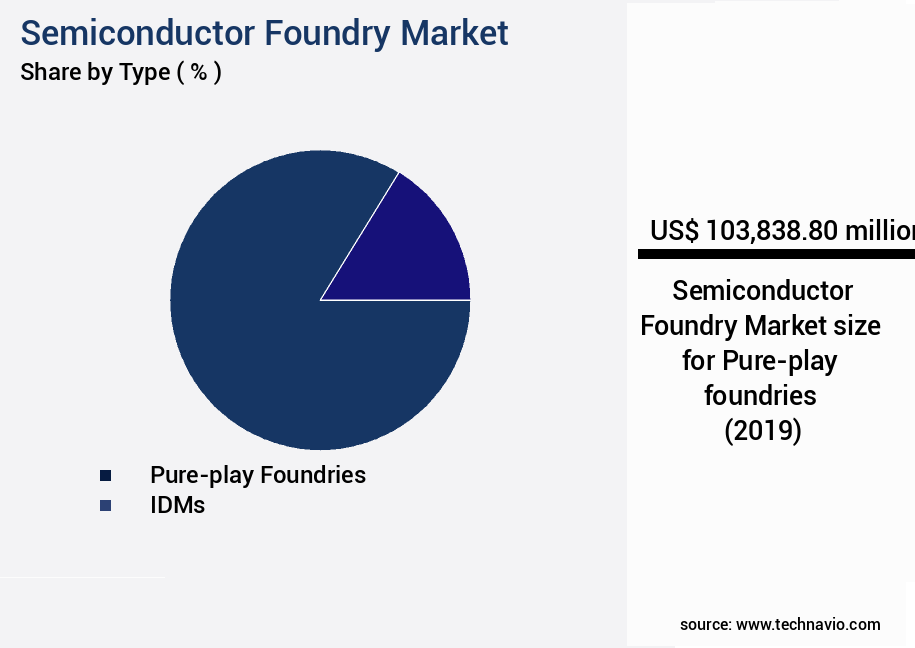
The Pure-play foundries segment was valued at USD 103.84 billion in 2019 and showed a gradual increase during the forecast period.
Regional Analysis
APAC is estimated to contribute 67% to the growth of the global market during the forecast period.Technavio’s analysts have elaborately explained the regional trends and drivers that shape the market during the forecast period.
See How Semiconductor Foundry Market Demand is Rising in APAC Request Free Sample
The market in APAC experiences significant expansion due to several key factors. Urbanization and economic growth in the region fuel the demand for advanced automotive components, particularly those integrated with energy-efficient materials like silicon carbide (SiC). This trend is driven by the increasing presence of automotive manufacturers and the growing demand from industries such as aerospace, electronics, and others in developing countries like China and India.
The market in APAC benefits from the presence of both global and local companies, ensuring a competitive and innovative landscape.
Market Dynamics
Our researchers analyzed the data with 2024 as the base year, along with the key drivers, trends, and challenges. A holistic analysis of drivers will help companies refine their marketing strategies to gain a competitive advantage.
The market is experiencing significant advancements driven by the relentless pursuit of smaller, more efficient semiconductor devices. Advanced node process technology, including high-k metal gate transistors and finFET fabrication techniques, are at the forefront of this evolution. These technologies enable the production of nanoscale devices, pushing the boundaries of silicon carbide power devices and gallium nitride semiconductor devices. The market's focus extends beyond traditional silicon-based semiconductors. High-performance computing chips, fueled by the demand for energy-efficient semiconductor devices, are a major growth area. Advanced semiconductor materials and low-power consumption designs are essential for addressing process variability reduction and defect reduction techniques.
Moreover, the semiconductor industry is embracing 3D integrated circuit packaging and heterogeneous integration methods to enhance performance and improve yield in semiconductor manufacturing. Precision manufacturing techniques and advanced metrology techniques are crucial for maintaining tight tolerances and ensuring consistent quality. Automated wafer handling systems and real-time process control systems are becoming increasingly important for managing the complexities of semiconductor fabrication. These technologies enable improved yield, reduced cycle times, and lower manufacturing costs. Compared to traditional semiconductor manufacturing processes, the adoption of extreme ultraviolet lithography is significantly more expensive. However, the benefits of smaller feature sizes, higher resolution, and reduced defects make it a worthwhile investment for semiconductor foundries.
In the competitive semiconductor foundry landscape, a minority of players, less than 15%, dominate the high-end market. These leading players invest heavily in research and development, ensuring they remain at the forefront of technology and process innovation.
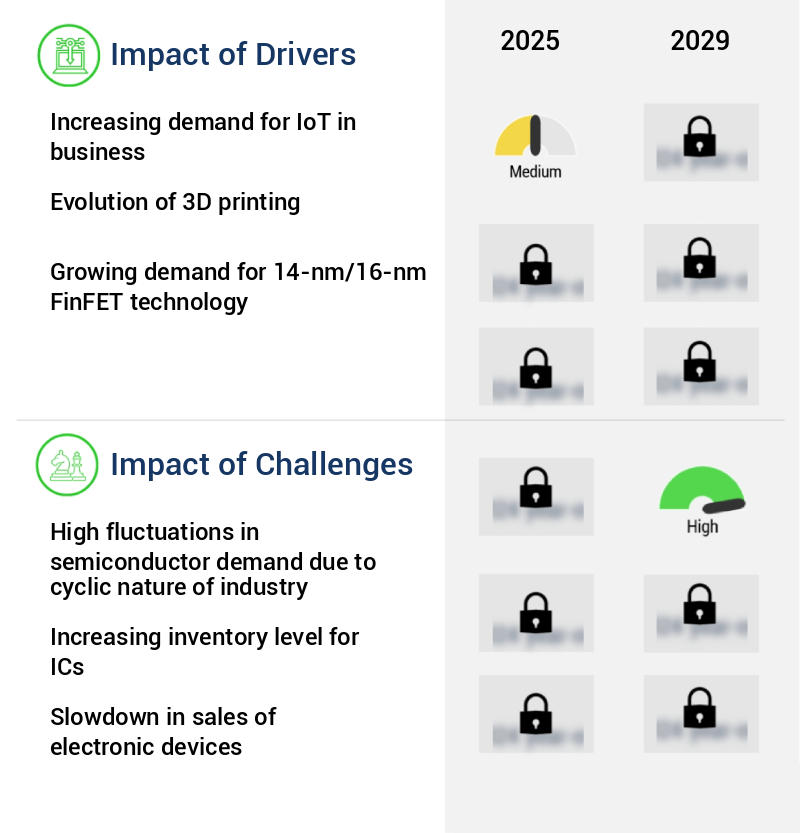
What are the key market drivers leading to the rise in the adoption of Semiconductor Foundry Industry?
- The surge in business demand for the Internet of Things (IoT) serves as the primary market catalyst.
- IoT, or the Internet of Things, represents a dynamic and expansive market where numerous devices are interconnected via the Internet. These devices span various sectors, encompassing consumer electronics like cell phones and tablets, as well as industrial applications such as cars, engines, and machinery in production facilities. The IoT landscape offers a myriad of business opportunities. Devices are assigned unique IP addresses, enabling them to collect and transmit data autonomously, eliminating the need for manual intervention. From a macro perspective, IoT devices can make informed decisions based on the data they receive, reducing reliance on human intervention.
- Semiconductors serve as the foundation for IoT devices, necessitating sensors, microcontrollers, and memory. The escalating demand for these components can be attributed to their substantial benefits across industries, including retail, healthcare, automotive, and electronics. IoT's continuous growth and evolution underscore its transformative potential in streamlining operations, enhancing efficiency, and fostering innovation.
What are the market trends shaping the Semiconductor Foundry Industry?
- The use of advanced analytics is becoming mandatory in semiconductor foundries. This market trend is characterized by the implementation of data-driven strategies to optimize production processes and enhance product quality.
- Semiconductor foundries are harnessing the power of big data to optimize their operations and make informed decisions. Big data, characterized by large volumes of information, offers significant potential for semiconductor foundries. These manufacturing facilities employ various tools equipped with sensors and data-collecting devices, creating a network of interconnected devices in fabs. This data flow enables foundries to address issues promptly, enhancing predictive maintenance, advanced process controls, and intelligent scheduling.
- By leveraging advanced analytics, semiconductor foundries simplify their manufacturing processes, moving away from relying on guesswork. This data-driven approach allows for more effective management and improved overall efficiency.
What challenges does the Semiconductor Foundry Industry face during its growth?
- The semiconductor industry faces significant growth challenges due to the cyclical nature of demand, which results in substantial fluctuations that must be addressed to ensure industry expansion.
- The semiconductor market experiences significant volatility due to the cyclical nature of demand for products utilizing these components. Semiconductors are integral to various sectors, including mobile devices, computers, consumer electronics, automotive goods, and telecommunication equipment. Market fluctuations in these industries influence the semiconductor market's trajectory. The semiconductor industry's volatility stems from several factors, including excess production capacity, obsolescence of products, and price erosion of Integrated Circuits (ICs). These downturns impact the semiconductor industry negatively and, subsequently, the global semiconductor foundries market. Despite these challenges, the semiconductor industry continues to evolve, with ongoing research and development in areas like artificial intelligence, Internet of Things, and automotive electronics driving growth.
- In summary, the semiconductor market's volatility is a result of the cyclical nature of demand for semiconductor-based products across various industries. Market fluctuations in these sectors influence the semiconductor industry, leading to periods of growth and decline. However, ongoing innovation and technological advancements provide opportunities for growth and expansion.
Exclusive Technavio Analysis on Customer Landscape
The semiconductor foundry market forecasting report includes the adoption lifecycle of the market, covering from the innovator’s stage to the laggard’s stage. It focuses on adoption rates in different regions based on penetration. Furthermore, the semiconductor foundry market report also includes key purchase criteria and drivers of price sensitivity to help companies evaluate and develop their market growth analysis strategies.
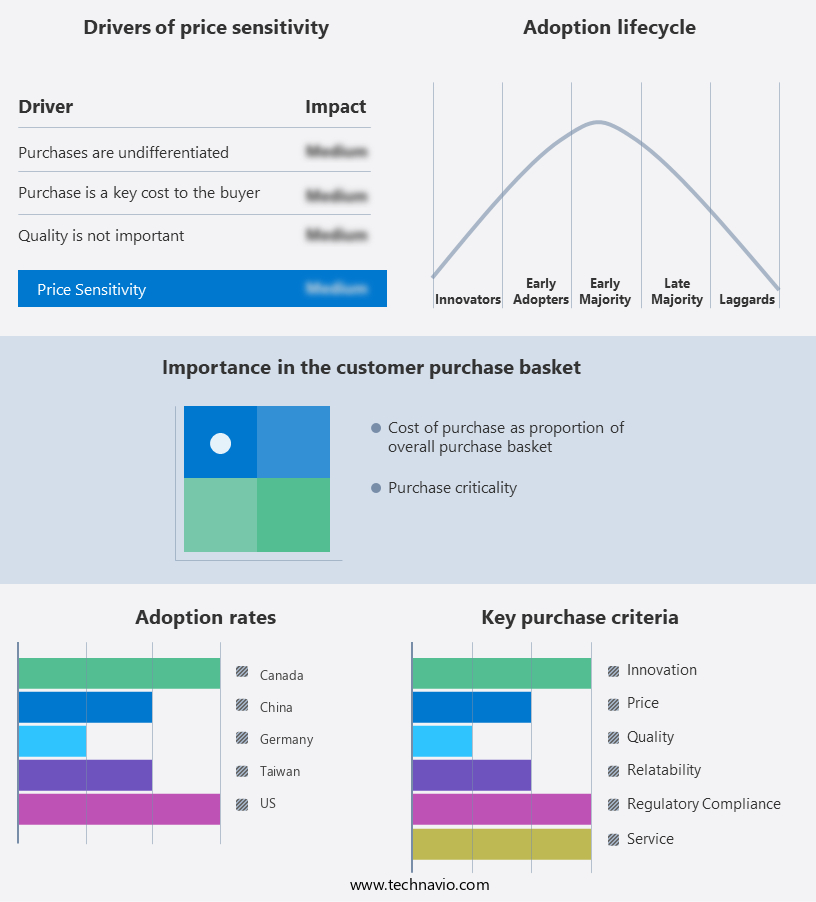
Customer Landscape of Semiconductor Foundry Industry
Competitive Landscape
Companies are implementing various strategies, such as strategic alliances, semiconductor foundry market forecast, partnerships, mergers and acquisitions, geographical expansion, and product/service launches, to enhance their presence in the industry.
Analog Devices Inc. - This company specializes in providing advanced semiconductor foundry solutions, including Attenuators, Beamformers, Phase Shifters, I Q Modulators and Demodulators, RF Amplifiers, 24GHz Radar Transceiver Chipsets, and more. Their offerings cater to various industries, showcasing expertise in cutting-edge technology and semiconductor innovation.
The industry research and growth report includes detailed analyses of the competitive landscape of the market and information about key companies, including:
- Analog Devices Inc.
- DB HITEK
- Fujitsu Ltd.
- Global Communication Semiconductors LLC
- Hua Hong Semiconductor Ltd.
- MACOM Technology Solutions Inc.
- MagnaChip Semiconductor Corp.
- NXP Semiconductors NV
- ON Semiconductor Corp.
- Powerchip Semiconductor Manufacturing Corp.
- Robert Bosch GmbH
- ROHM Co. Ltd.
- Samsung Electronics Co. Ltd.
- Semiconductor Manufacturing International Corp.
- STMicroelectronics NV
- Taiwan Semiconductor Manufacturing Co. Ltd.
- Toshiba Corp.
- Tower Semiconductor Ltd.
- United Microelectronics Corp.
- Win Semiconductor
- X-FAB Silicon Foundries SE
Qualitative and quantitative analysis of companies has been conducted to help clients understand the wider business environment as well as the strengths and weaknesses of key industry players. Data is qualitatively analyzed to categorize companies as pure play, category-focused, industry-focused, and diversified; it is quantitatively analyzed to categorize companies as dominant, leading, strong, tentative, and weak.
Recent Development and News in Semiconductor Foundry Market
- In January 2024, GlobalFoundries announced the expansion of its 7nm manufacturing capacity in New York, with a USD15 billion investment, as reported by Reuters. This expansion aimed to cater to the growing demand for advanced semiconductor technologies in sectors like AI, 5G, and automotive.
- In March 2024, Samsung Electronics and Intel Corporation announced a long-term extension of their foundry partnership, as disclosed in a Samsung press release. This collaboration enabled Intel to access Samsung's advanced 7nm and 5nm process technologies for its product roadmap, strengthening their strategic alliance in the semiconductor industry.
- In May 2024, TSMC (Taiwan Semiconductor Manufacturing Company) revealed its plans to invest USD10 billion in a new 3nm chip manufacturing facility in Arizona, according to a company press release. This expansion marked TSMC's commitment to increasing its global presence and capacity to meet the growing demand for advanced semiconductor technologies.
- In April 2025, SkyWater Technology, a US-based semiconductor foundry, completed its acquisition of Memjet, a leading inkjet printhead and manufacturing technology company, as stated in a SkyWater press release. This acquisition aimed to expand SkyWater's capabilities into the printing technology sector and broaden its market reach beyond traditional semiconductor applications.
Dive into Technavio’s robust research methodology, blending expert interviews, extensive data synthesis, and validated models for unparalleled Semiconductor Foundry Market insights. See full methodology.
|
Market Scope |
|
|
Report Coverage |
Details |
|
Page number |
231 |
|
Base year |
2024 |
|
Historic period |
2019-2023 |
|
Forecast period |
2025-2029 |
|
Growth momentum & CAGR |
Accelerate at a CAGR of 9% |
|
Market growth 2025-2029 |
USD 82839.4 million |
|
Market structure |
Fragmented |
|
YoY growth 2024-2025(%) |
8.0 |
|
Key countries |
Taiwan, US, China, Japan, South Korea, Germany, India, France, Canada, and Brazil |
|
Competitive landscape |
Leading Companies, Market Positioning of Companies, Competitive Strategies, and Industry Risks |
Research Analyst Overview
- In the dynamic and intricate realm of semiconductor foundry manufacturing, maintaining a cleanroom environment and implementing stringent contamination control procedures are paramount. These measures ensure the integrity of the manufacturing process, from silicon wafer fabrication to integrated circuit manufacturing. Manufacturing process control is a continuous endeavor, with equipment maintenance protocols playing a crucial role. Advanced techniques, such as 3D chip stacking and ion implantation, necessitate meticulous process control to mitigate potential complications. Semiconductor material properties are subject to constant scrutiny, as are front-end-of-line processes like lithography resolution enhancement and photolithography. Failure analysis techniques and reliability testing methods are employed to identify and address issues, while process optimization techniques and yield enhancement strategies are employed to maximize efficiency.
- Semiconductor metrology and semiconductor device physics are essential disciplines, with plasma etching methods and wafer dicing techniques contributing to the intricate process of creating advanced semiconductor devices. Process control monitoring and semiconductor packaging are integral components of the overall manufacturing process, with critical dimension control and defect density control being key considerations. The back-end-of-line processes, including wafer bonding methods and circuit design rules, are equally important. EUV lithography systems and thin film deposition techniques are employed to create the intricate structures required for modern semiconductor devices. Process integration challenges persist, necessitating ongoing research and development in areas like advanced packaging techniques, chemical mechanical planarization, and wafer handling automation.
- The semiconductor industry remains a vibrant and evolving landscape, with constant innovation and improvement driving progress.
What are the Key Data Covered in this Semiconductor Foundry Market Research and Growth Report?
-
What is the expected growth of the Semiconductor Foundry Market between 2025 and 2029?
-
USD 82.84 billion, at a CAGR of 9%
-
-
What segmentation does the market report cover?
-
The report segmented by Type (Pure-play foundries and IDMs), Application (Communications, PCs and desktop, Consumers, Automotive, and Others), Technology (7nm and Below, 10nm to 20nm, 20nm to 45nm, and 45nm and above), and Geography (APAC, North America, Europe, South America, and Middle East and Africa)
-
-
Which regions are analyzed in the report?
-
APAC, North America, Europe, South America, and Middle East and Africa
-
-
What are the key growth drivers and market challenges?
-
Increasing demand for IoT in business, High fluctuations in semiconductor demand due to cyclic nature of industry
-
-
Who are the major players in the Semiconductor Foundry Market?
-
Key Companies Analog Devices Inc., DB HITEK, Fujitsu Ltd., Global Communication Semiconductors LLC, Hua Hong Semiconductor Ltd., MACOM Technology Solutions Inc., MagnaChip Semiconductor Corp., NXP Semiconductors NV, ON Semiconductor Corp., Powerchip Semiconductor Manufacturing Corp., Robert Bosch GmbH, ROHM Co. Ltd., Samsung Electronics Co. Ltd., Semiconductor Manufacturing International Corp., STMicroelectronics NV, Taiwan Semiconductor Manufacturing Co. Ltd., Toshiba Corp., Tower Semiconductor Ltd., United Microelectronics Corp., Win Semiconductor, and X-FAB Silicon Foundries SE
-
Market Research Insights
- The market is a dynamic and complex industry characterized by continuous innovation and technological advancements. Two key metrics illustrate its current state and growth trajectory. First, the global semiconductor foundry revenue is projected to reach USD125 billion by 2025, representing a compound annual growth rate (CAGR) of 8.5% from 2020 to 2025. Second, the integration of advanced technologies, such as machine learning applications, automation systems, and statistical process control, has significantly improved process capabilities and yield prediction modeling. For instance, the average process capability index (Cpk) has increased from 1.3 to 1.6 over the past decade, leading to higher product reliability and lower failure mechanism analysis.
- These advancements have also enabled the mass production of smaller, more power-efficient chips, which is crucial for meeting the evolving demands of various industries, including automotive, consumer electronics, and telecommunications.
We can help! Our analysts can customize this semiconductor foundry market research report to meet your requirements.
 RIA -
RIA - 
