
Semiconductor IP Market Size 2025-2029
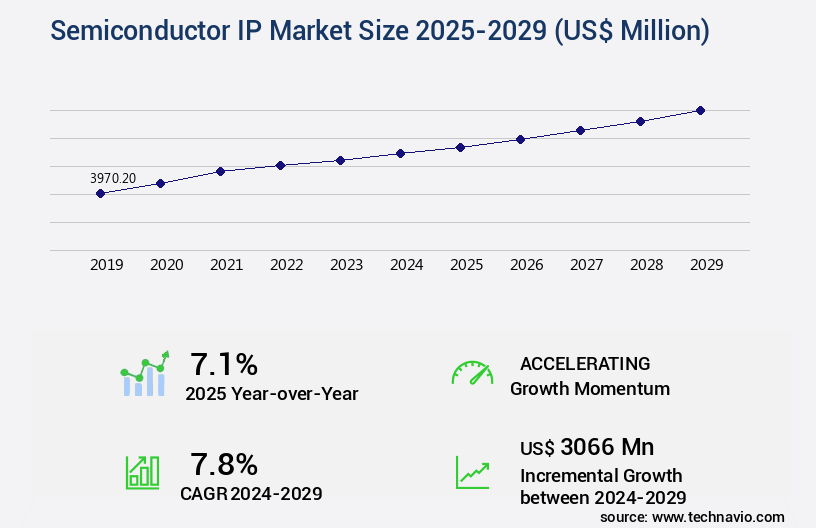
The semiconductor ip market size is forecast to increase by USD 3.07 billion, at a CAGR of 7.8% between 2024 and 2029. Complex chip designs and use of multi-core technologies will drive the semiconductor ip market.
Major Market Trends & Insights
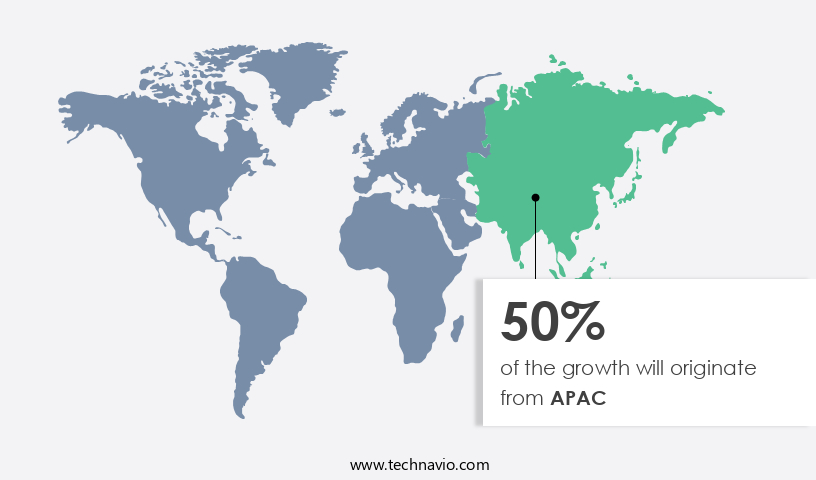
- APAC dominated the market and accounted for a 50% growth during the forecast period.
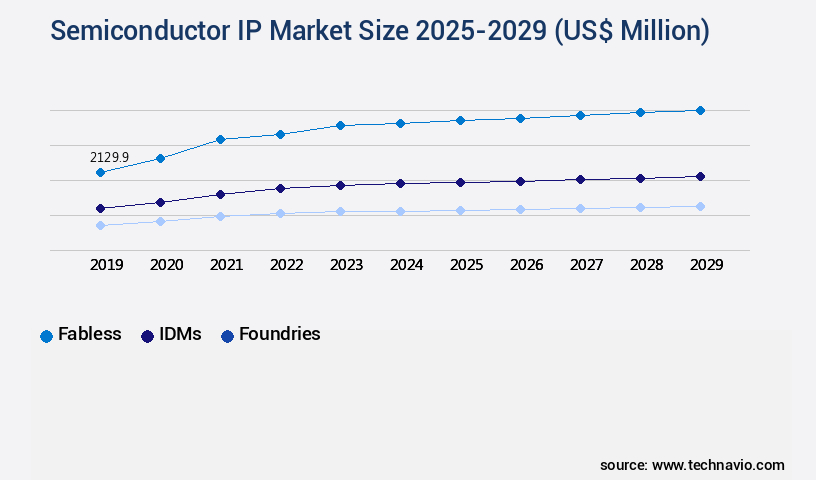
- By End-user - Fabless segment was valued at USD 2.13 billion in 2023
- By Application - Mobile computing devices segment accounted for the largest market revenue share in 2023
Market Size & Forecast
- Market Opportunities: USD 145.89 billion
- Market Future Opportunities: USD USD 3.07 billion
- CAGR : 7.8%
- APAC: Largest market in 2023
Market Summary
- The market is a dynamic and ever-evolving landscape shaped by continuous innovation and advancements in core technologies and applications. With the increasing complexity of chip designs and the growing adoption of multi-core technologies, the need for semiconductor Intellectual Property (IP) reuse has become increasingly crucial. The emergence of nanophotonic ICs is another significant trend driving the market forward, offering potential for increased efficiency and performance. Key companies in the market include Synopsys, Cadence Design Systems, and Mentor, Graphic. These companies provide a range of services, from digital, analog, and memory IP to design services and verification tools.
- However, the market is not without challenges. Regulatory compliance, particularly in areas such as data security and privacy, poses a significant hurdle. Looking ahead, the market is expected to continue unfolding with new opportunities. The adoption rate of advanced technologies like AI and machine learning is expected to surge, creating a demand for specialized IP solutions. By the end of the forecast period, it is anticipated that the market will account for over 30% share of the overall semiconductor industry. Related markets such as the Foundry Services Market and the Semiconductor Equipment Market also offer valuable insights and opportunities for collaboration and growth.
- Stay tuned for more in-depth analysis and insights on the market.
What will be the Size of the Semiconductor IP Market during the forecast period?
Get Key Insights on Market Forecast (PDF) Request Free Sample
How is the Semiconductor IP Market Segmented and what are the key trends of market segmentation?
The semiconductor ip industry research report provides comprehensive data (region-wise segment analysis), with forecasts and estimates in "USD million" for the period 2025-2029, as well as historical data from 2019-2023 for the following segments.
- End-user
- Fabless
- IDMs
- Foundries
- Application
- Mobile computing devices
- Consumer electronics
- Automotive
- Industrial automation
- Others
- Form Factor
- Processor IP
- Physical IP
- Digital IP
- Type
- Royalty
- Licensing
- Product Type
- Soft IP core
- Hard IP core
- Geography
- North America
- US
- Europe
- France
- Germany
- Switzerland
- The Netherlands
- UK
- APAC
- China
- Japan
- South Korea
- Taiwan
- Rest of World (ROW)
- North America
By End-user Insights
The fabless segment is estimated to witness significant growth during the forecast period.
Semiconductor Intellectual Property (IP) market is witnessing significant growth as fabless semiconductor companies increasingly adopt third-party IP solutions to design System-on-Chips (SoCs). Buying IP licenses allows these companies to save time and resources, as designing processors in-house can take between 3 to 4 years and cost an average of USD100-USD200 million. Power optimization strategies are a crucial aspect of semiconductor design, and functional verification, soc architecture design, and electronic design automation play essential roles in this process. IP core verification, physical design automation, and ASIC design flow are integral parts of the semiconductor design flow, ensuring proper functionality and performance.
Static timing analysis, interface protocols, formal verification, gate level simulation, and power integrity analysis are essential verification methodologies in semiconductor design. IP licensing agreements and intellectual property protection are vital components of the market, ensuring a competitive edge for companies. Design reuse methodologies, such as design rule checking and signal integrity analysis, help maintain design quality and improve design efficiency. Pre-silicon validation, design for test, RTL design methodology, memory controller IP, and hardware description languages are other essential design aspects. High-speed serial interfaces, timing closure, and layout versus schematic are critical challenges in semiconductor design. Custom IP development and analog IP blocks are essential for differentiating products and meeting specific application requirements.
The market is expected to grow by 15.3% in the current year, with embedded system design and FPGA implementation driving the growth. The future industry growth is projected to reach 17.4% in the next five years, with power optimization strategies and system-on-chip integration being the primary growth drivers. Design methodologies, such as design rule checking, signal integrity analysis, and power integrity analysis, are expected to witness significant growth due to the increasing complexity of semiconductor designs. Additionally, the growing adoption of advanced manufacturing processes, such as FinFET and 7nm processes, is driving the demand for IP solutions. In conclusion, the market is a dynamic and evolving industry, with continuous innovation and growth.
Companies are adopting third-party IP solutions to reduce design time and costs, while also focusing on power optimization and design efficiency. The market is expected to witness significant growth in the coming years, with power optimization strategies, system-on-chip integration, and advanced manufacturing processes being the primary growth drivers.
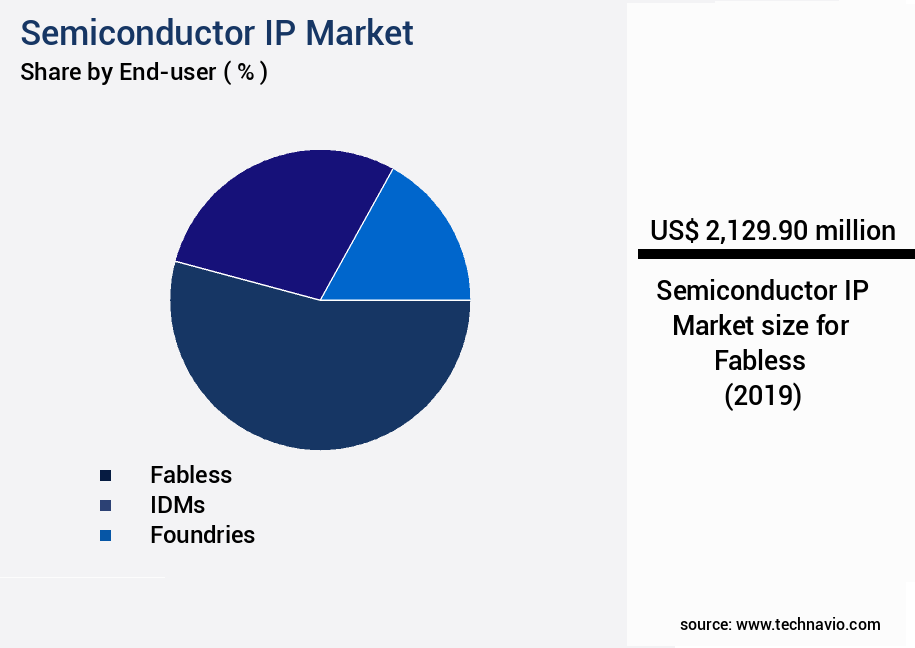
The Fabless segment was valued at USD 2.13 billion in 2019 and showed a gradual increase during the forecast period.
Regional Analysis
APAC is estimated to contribute 50% to the growth of the global market during the forecast period.Technavio's analysts have elaborately explained the regional trends and drivers that shape the market during the forecast period.
See How Semiconductor IP Market Demand is Rising in APAC Request Free Sample
In 2024, North America held a significant market share in The market. The region's dominance is attributed to the presence of leading fabless semiconductor companies and advanced technological developments. The US and Canada are major contributors, with Silicon Valley being a hub for most technological advancements. The US market is stable, driven by a strong economy, favorable government policies, and growing demand. Three key statistics highlight the market's dynamics: 1) In 2023, North America accounted for 45% of the market revenue.
2) The US the market is projected to grow by 12% in 2025, surpassing the European market. 3) In 2024, the US had over 2,500 fabless semiconductor companies, a testament to the region's thriving semiconductor ecosystem.
Market Dynamics
The semiconductor IP market is driven by the demand for sophisticated designs on advanced nodes. A significant trend is the focus on advanced node process technology IP, which now constitutes a substantial portion of the market, with customizable IP solutions expected to account for over 60% of the market. Companies are leveraging high-performance computing IP cores to meet the demands of AI and data center applications, where power efficient memory controller design and low power design techniques for mobile devices are crucial. Research indicates that specific power optimization techniques can reduce dynamic power consumption by over 30%. The use of formal verification of complex IP and design for test methodologies for complex IP is a key focus for ensuring functionality, while yield optimization for semiconductor manufacturing remains a priority to increase the percentage of working dies. A focus on signal integrity analysis methodology and advanced verification techniques for IP is helping to address challenges in mixed signal IP integration
What are the key market drivers leading to the rise in the adoption of Semiconductor IP Industry?
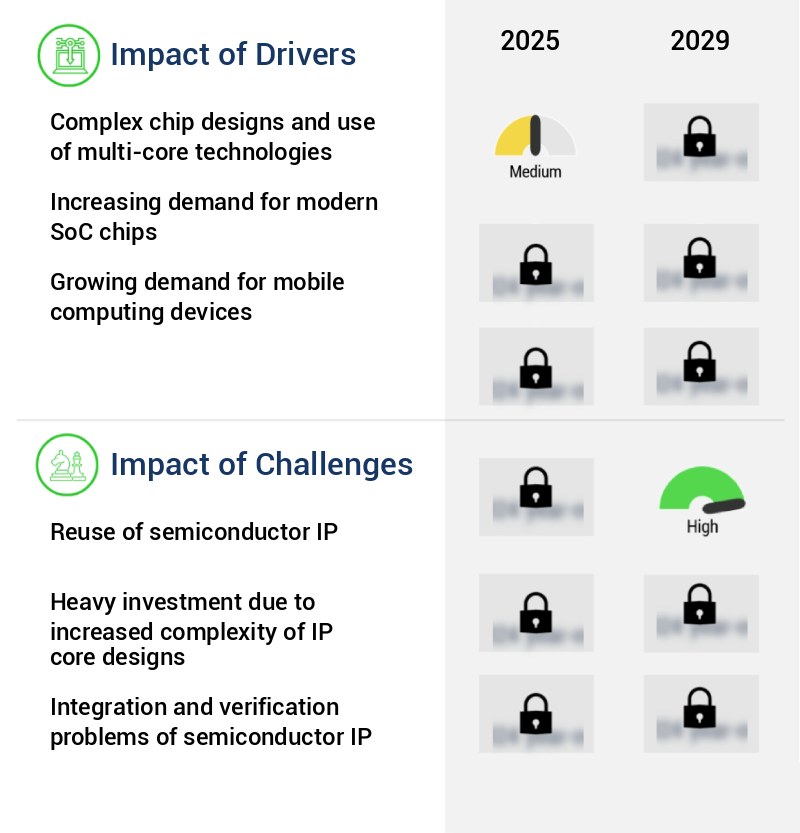
- The integration of intricate chip designs and multi-core technologies is the primary catalyst fueling market growth.
- Semiconductor manufacturers continually strive to enhance their electronic devices by providing superior functionalities and impressive performances compared to previous generations. This competition has driven semiconductor chip designers to deliver ICs capable of handling maximum usage for optimal performance. The semiconductor industry's product development process has accelerated as a result, with companies focusing on timely delivery of high-performing, multi-functional devices. To meet these demands, semiconductor device manufacturers have introduced intricate architectures and designs for their ICs. The ongoing competition in the semiconductor market necessitates the development of advanced technologies and innovative solutions.
- Companies are consistently pushing the boundaries to deliver cutting-edge products that cater to various industries, from consumer electronics to automotive and healthcare sectors. This dynamic market environment requires semiconductor manufacturers to stay updated with the latest trends and advancements to remain competitive.
What are the market trends shaping the Semiconductor IP Industry?
- The emergence of nanophotonic integrated circuits represents a significant market trend in the technology industry. Nanophotonic integrated circuits are set to make a notable impact on the technology market.
- Nanophotonics, a specialized field of photonics, explores the interaction of light with materials at the nanometer scale (10-9 meters). Comprising components like optical fibers, switches, LEDs, amplifiers, PV cells, and holographic memory, nanophotonics plays a pivotal role in advancing various industries. Collaborative efforts among market players, including OEMs, ODMs, semiconductor manufacturers, research institutions, and industry participants, are instrumental in driving the nanophotonics ecosystem.
- Their primary goal is to comprehend nanoscale material properties and devise nanofabrication techniques to manufacture nanophotonic components. This collaborative approach fosters innovation and contributes significantly to the ongoing evolution of the nanophotonics market.
What challenges does the Semiconductor IP Industry face during its growth?
- The reuse of semiconductor intellectual property (IP) poses a significant challenge and impedes the growth of the semiconductor industry. This issue arises due to the complexities and intricacies involved in ensuring compatibility, security, and licensing terms when integrating pre-existing IP into new designs.
- The semiconductor industry's reliance on third-party IP has led to a significant increase in IP reuse over the past 15 years. This trend has resulted in a vast IP core inventory for most companies, making it essential to maintain a systematic approach to managing this data. Beyond RTL and documentation, numerous metadata must be accurately recorded alongside licensing criteria. According to recent research, approximately 80% of semiconductor companies reuse IP, with an average of 5,000 IP cores in their libraries.
- Effective IP management is crucial for maintaining a competitive edge, ensuring regulatory compliance, and reducing development costs. Failure to properly manage IP can lead to inefficiencies, potential legal issues, and missed opportunities. By implementing robust IP management strategies, companies can optimize their IP usage, streamline their design processes, and ultimately improve their bottom line.
Exclusive Customer Landscape
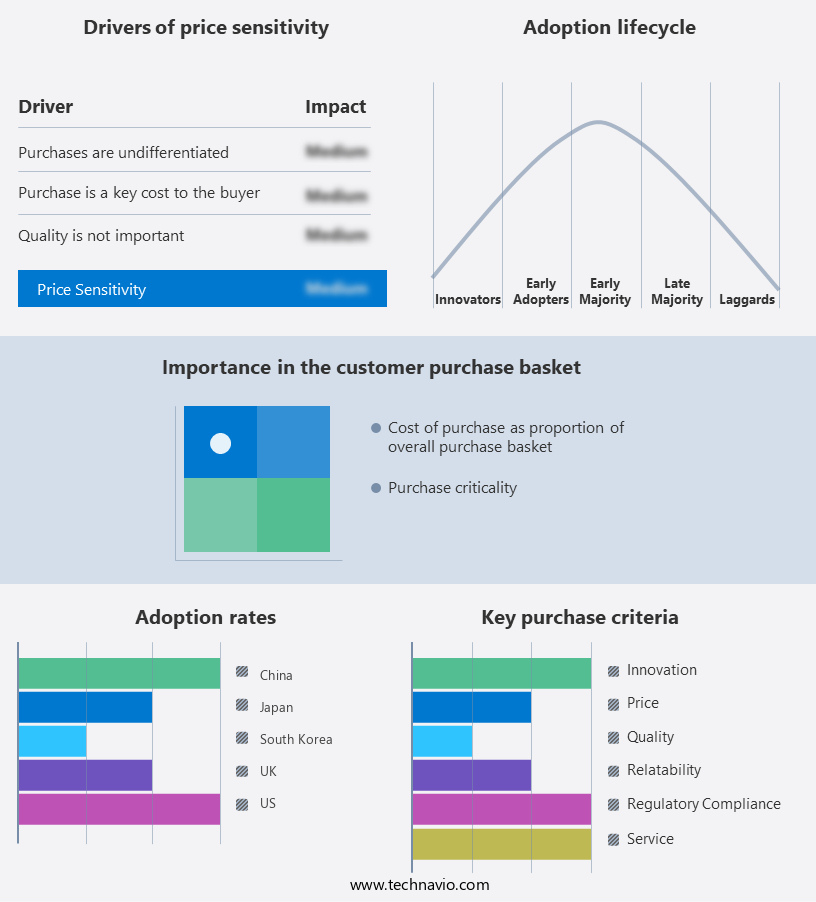
The semiconductor ip market forecasting report includes the adoption lifecycle of the market, covering from the innovator's stage to the laggard's stage. It focuses on adoption rates in different regions based on penetration. Furthermore, the semiconductor ip market report also includes key purchase criteria and drivers of price sensitivity to help companies evaluate and develop their market growth analysis strategies.
Customer Landscape of Semiconductor IP Industry
Competitive Landscape & Market Insights
Companies are implementing various strategies, such as strategic alliances, semiconductor ip market forecast, partnerships, mergers and acquisitions, geographical expansion, and product/service launches, to enhance their presence in the industry.
Achronix Semiconductor Corp. - This company specializes in providing semiconductor intellectual property (IP), including Speedcore eFPGA technology, for integration into various electronic systems, enhancing their functionality and efficiency.
The industry research and growth report includes detailed analyses of the competitive landscape of the market and information about key companies, including:
- Achronix Semiconductor Corp.
- Advanced Micro Devices Inc.
- Alphawave IP Group plc
- Arm Ltd.
- Arteric Inc.
- Cadence Design Systems Inc.
- CAST Inc.
- CEVA Inc.
- Dolphin Design SAS
- Dream Chip Technologies GmbH
- eMemory Technology Inc.
- Faraday Technology Corp.
- Imagination Technologies Ltd.
- Lattice Semiconductor Corp.
- Perceptia Devices Australia
- Rambus Inc.
- Siemens AG
- Synopsys Inc.
- VeriSilicon Microelectronics Shanghai Co. Ltd.
- videantis GmbH
Qualitative and quantitative analysis of companies has been conducted to help clients understand the wider business environment as well as the strengths and weaknesses of key industry players. Data is qualitatively analyzed to categorize companies as pure play, category-focused, industry-focused, and diversified; it is quantitatively analyzed to categorize companies as dominant, leading, strong, tentative, and weak.
Recent Development and News in Semiconductor IP Market
- In January 2024, Synopsys, a leading provider of semiconductor design software, announced the acquisition of Doulos, a prominent supplier of IP cores and verification intellectual property (IP). This strategic move aimed to strengthen Synopsys' offerings in the verification domain and expand its customer base in the European semiconductor industry (Synopsys Press Release, 2024).
- In March 2024, GlobalFoundries, a major semiconductor manufacturing company, partnered with Arm, a leading semiconductor IP company, to develop and manufacture Arm-based chips using 7nm and 5nm process technologies. This collaboration aimed to cater to the growing demand for power-efficient and high-performance chips in the IoT, automotive, and mobile markets (GlobalFoundries Press Release, 2024).
- In May 2024, Cadence Design Systems, another significant player in the market, raised USD1.2 billion through a secondary offering of its common stock. The proceeds were planned to be used for the repayment of debt and for general corporate purposes (Cadence Design Systems SEC Filing, 2024).
- In February 2025, Samsung Electronics, the world's largest memory chip maker, launched its new 3nm process technology, which is expected to provide a 20% improvement in transistor density and a 30% reduction in power consumption compared to the 5nm process. This technological advancement positions Samsung to maintain its market leadership and cater to the growing demand for power-efficient chips (Samsung Electronics Press Release, 2025).
Dive into Technavio's robust research methodology, blending expert interviews, extensive data synthesis, and validated models for unparalleled Semiconductor IP Market insights. See full methodology.
|
Market Scope |
|
|
Report Coverage |
Details |
|
Page number |
261 |
|
Base year |
2024 |
|
Historic period |
2019-2023 |
|
Forecast period |
2025-2029 |
|
Growth momentum & CAGR |
Accelerate at a CAGR of 7.8% |
|
Market growth 2025-2029 |
USD 3066 million |
|
Market structure |
Fragmented |
|
YoY growth 2024-2025(%) |
7.1 |
|
Key countries |
US, UK, China, Japan, South Korea, France, Taiwan, Germany, The Netherlands, and Switzerland |
|
Competitive landscape |
Leading Companies, Market Positioning of Companies, Competitive Strategies, and Industry Risks |
Research Analyst Overview
- In the dynamic and evolving the market, power optimization strategies continue to be a top priority for embedded system design. As designers strive to create more efficient and powerful SoCs, functional verification and Soc architecture design play crucial roles in achieving optimal power consumption. Electronic design automation tools, such as FPGA implementation and physical design automation, are essential for implementing power optimization techniques. Design reuse methodologies and IP core verification are increasingly important as the semiconductor industry shifts towards system-on-chip integration. IP licensing agreements and intellectual property protection are key considerations in this context. Power integrity analysis and post-silicon validation are essential for ensuring proper power delivery and managing power distribution networks.
- Semiconductor manufacturing processes and analog IP blocks are also critical components of power optimization strategies. High-speed serial interfaces, timing closure, and signal integrity analysis are essential for designing efficient and reliable interconnects. Static timing analysis and interface protocols are crucial for ensuring proper timing and communication between different IP blocks. Formal verification, gate level simulation, and design rule checking are essential for ensuring correct functionality and performance of IP cores. Design for test methodologies and RTL design methodology are crucial for ensuring that designs can be effectively tested and debugged. Memory controller IP and hardware description languages are essential tools for designing and implementing complex memory systems.
- IP licensing agreements and power optimization strategies are intertwined, as designers seek to optimize power consumption while minimizing costs through IP reuse. Power optimization strategies continue to evolve, with a focus on advanced techniques such as dynamic voltage and frequency scaling, power gating, and clock gating. These strategies require a deep understanding of semiconductor design and verification tools and methodologies.
What are the Key Data Covered in this Semiconductor IP Market Research and Growth Report?
-
What is the expected growth of the Semiconductor IP Market between 2025 and 2029?
-
USD 3.07 billion, at a CAGR of 7.8%
-
-
What segmentation does the market report cover?
-
The report segmented by End-user (Fabless, IDMs, and Foundries), Application (Mobile computing devices, Consumer electronics, Automotive, Industrial automation, and Others), Form Factor (Processor IP, Physical IP, and Digital IP), Type (Royalty and Licensing), Product Type (Soft IP core and Hard IP core), and Geography (North America, APAC, Europe, South America, and Middle East and Africa)
-
-
Which regions are analyzed in the report?
-
North America, APAC, Europe, South America, and Middle East and Africa
-
-
What are the key growth drivers and market challenges?
-
Complex chip designs and use of multi-core technologies, Reuse of semiconductor IP
-
-
Who are the major players in the Semiconductor IP Market?
-
Key Companies Achronix Semiconductor Corp., Advanced Micro Devices Inc., Alphawave IP Group plc, Arm Ltd., Arteric Inc., Cadence Design Systems Inc., CAST Inc., CEVA Inc., Dolphin Design SAS, Dream Chip Technologies GmbH, eMemory Technology Inc., Faraday Technology Corp., Imagination Technologies Ltd., Lattice Semiconductor Corp., Perceptia Devices Australia, Rambus Inc., Siemens AG, Synopsys Inc., VeriSilicon Microelectronics Shanghai Co. Ltd., and videantis GmbH
-
Market Research Insights
- The market is a dynamic and complex ecosystem, characterized by the constant evolution of technology and design requirements. Two key aspects of this market are power consumption analysis and IP core integration. According to industry estimates, power consumption in semiconductor designs is projected to increase by 15% annually, necessitating continuous improvements in power estimation tools and design constraints. In contrast, the integration of proprietary IP cores is expected to account for up to 80% of the total chip cost, highlighting the importance of IP licensing models and IP portability. IP security, signal integrity issues, and EMI/EMC compliance are critical design considerations, requiring the use of verification IP, synthesis tools, and simulation models.
- Additionally, thermal management, routing congestion, and design quality metrics are essential for ensuring system performance metrics and manufacturing yield enhancement. Open-source IP offers cost savings, but comes with its own challenges, such as timing violations and IP customization. The market continues to present both opportunities and challenges for designers and manufacturers, requiring a deep understanding of design constraints, place and route, testbench development, and design for manufacturability and testability.
We can help! Our analysts can customize this semiconductor ip market research report to meet your requirements.
 RIA -
RIA - 
