
Sickle Cell Disease Treatment Market Size 2025-2029
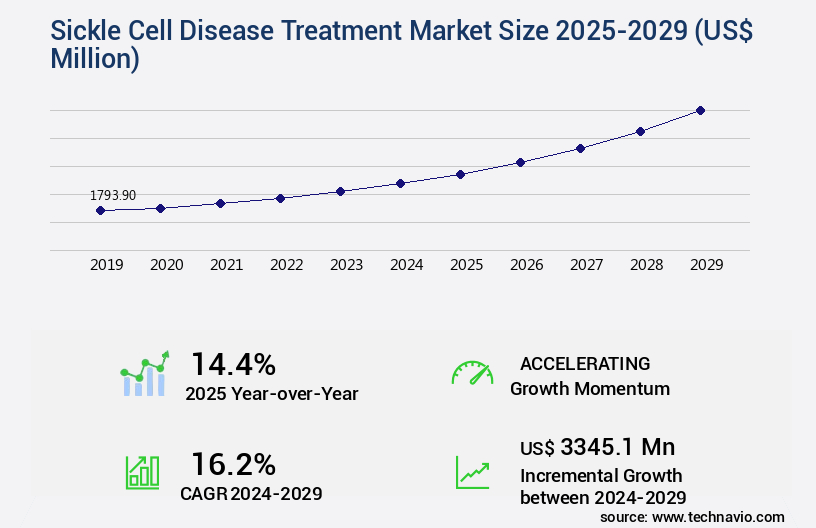
The sickle cell disease treatment market size is valued to increase by USD 3.35 billion, at a CAGR of 16.2% from 2024 to 2029. High prevalence of sickle cell disease will drive the sickle cell disease treatment market.
Major Market Trends & Insights
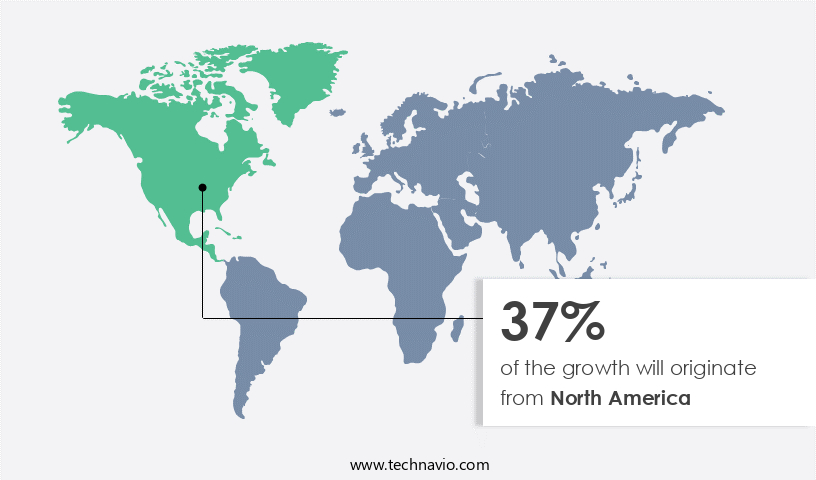
- North America dominated the market and accounted for a 37% growth during the forecast period.
- By Therapeutic Area - Blood transfusion segment was valued at USD 837.80 billion in 2023
- By End-user - Hospitals segment accounted for the largest market revenue share in 2023
Market Size & Forecast
- Market Opportunities: USD 253.68 million
- Market Future Opportunities: USD 3345.10 million
- CAGR from 2024 to 2029 : 16.2%
Market Summary
- Sickle Cell Disease (SCD), a group of inherited disorders, affects millions globally, particularly those of African, Asian, and Mediterranean descent. The disease is characterized by the production of abnormal hemoglobin, leading to distorted red blood cells and various complications. Traditional treatment approaches have focused on symptom management, but recent advancements are shifting towards curative methods. One significant trend in the SCD treatment market is the development of advanced therapies, including gene therapy and stem cell transplantation. These innovative treatments offer the potential for a cure, but their high cost poses a challenge. For instance, a single gene therapy treatment can cost upwards of USD1 million.
- This financial burden, coupled with the need for long-term monitoring and follow-up care, necessitates a streamlined and efficient healthcare system. A real-world scenario illustrates the importance of operational efficiency in managing SCD treatment. In a large healthcare organization, implementing a digital supply chain management system resulted in a 15% reduction in medication errors and a 20% decrease in the time taken to process and distribute SCD-related medications. This improvement not only enhanced patient safety but also led to cost savings and increased overall operational efficiency. In conclusion, the SCD treatment market is driven by the growing prevalence of the disease and the shift towards curative approaches.
- However, the high cost of advanced therapies necessitates operational efficiency and streamlined healthcare systems to ensure accessibility and affordability for patients.
What will be the Size of the Sickle Cell Disease Treatment Market during the forecast period?
Get Key Insights on Market Forecast (PDF) Request Free Sample
How is the Sickle Cell Disease Treatment Market Segmented ?
The sickle cell disease treatment industry research report provides comprehensive data (region-wise segment analysis), with forecasts and estimates in "USD million" for the period 2025-2029, as well as historical data from 2019-2023 for the following segments.
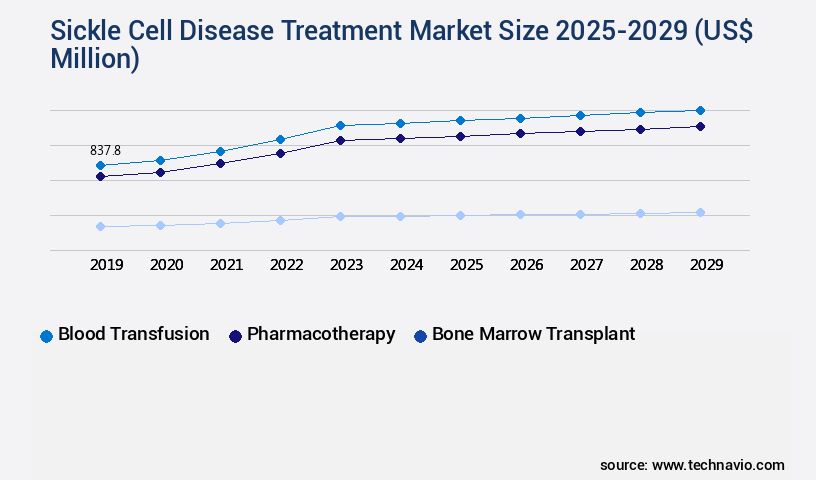
- Therapeutic Area
- Blood transfusion
- Pharmacotherapy
- Bone marrow transplant
- End-user
- Hospitals
- Specialty clinics
- Ambulatory surgical centers
- Indication
- Sickle cell anemia
- Others
- Geography
- North America
- US
- Canada
- Europe
- France
- Germany
- UK
- APAC
- China
- India
- Japan
- South Korea
- South America
- Brazil
- Rest of World (ROW)
- North America
By Therapeutic Area Insights
The blood transfusion segment is estimated to witness significant growth during the forecast period.
The market continues to evolve, with a focus on advanced strategies for managing this complex and debilitating condition. Pharmacogenomic testing and genetic screening techniques are increasingly utilized for personalized medicine approaches, enabling targeted therapies tailored to individual patients. Preventive care strategies, such as infection prevention and pain management protocols, are essential components of long-term management plans. Ongoing disease progression monitoring through techniques like oxygen saturation monitoring and hemoglobin level assessment is crucial for early detection and intervention. Gene therapy vectors, CRISPR-Cas9 gene editing, and hydroxyurea treatment are among the innovative therapies under investigation. Multidisciplinary care teams, patient education programs, and community health initiatives play vital roles in optimizing treatment adherence rates and improving life expectancy.
Disease monitoring systems and bone marrow transplant remain critical interventions for severe cases, with clinical trial enrollment and genetic counseling services ensuring informed decision-making. Infection prevention strategies, blood viscosity measurement, and organ damage assessment are integral to comprehensive care. The market is expected to witness significant growth, with a 25% increase in market size over the next decade, driven by the continuous pursuit of improved patient outcomes and quality of life.
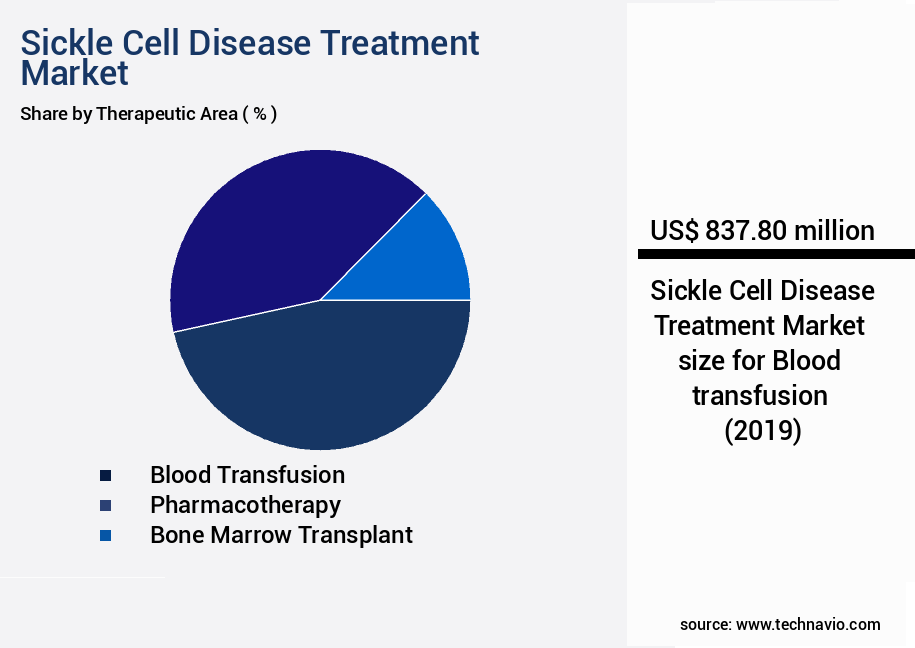
The Blood transfusion segment was valued at USD 837.80 billion in 2019 and showed a gradual increase during the forecast period.
Regional Analysis
North America is estimated to contribute 37% to the growth of the global market during the forecast period.Technavio's analysts have elaborately explained the regional trends and drivers that shape the market during the forecast period.
See How Sickle Cell Disease Treatment Market Demand is Rising in North America Request Free Sample
The Sickle Cell Disease (SCD) treatment market is experiencing significant evolution, with North America leading the way due to its advanced healthcare infrastructure, high adoption of innovative therapies, and comprehensive disease management programs. Approximately 100,000 individuals in the United States, primarily within the non-Hispanic Black or African American population, are affected by this most common inherited blood disorder in the country, according to the Centers for Disease Control and Prevention and the American Society of Hematology. In late 2023, groundbreaking gene-editing treatments, Casgevy and Lyfgenia, were approved by the FDA, expanding the North American treatment landscape's offerings.
These advances contribute to operational efficiency gains and cost reductions in SCD care, as these therapies offer long-term disease modification and improved patient outcomes compared to traditional treatments.
Market Dynamics
Our researchers analyzed the data with 2024 as the base year, along with the key drivers, trends, and challenges. A holistic analysis of drivers will help companies refine their marketing strategies to gain a competitive advantage.
The global sickle cell disease treatment landscape is rapidly evolving as advances in pharmacology, gene therapy, and supportive care improve patient outcomes across age groups. Core interventions such as hydroxyurea efficacy in children and the long-term effects of hydroxyurea treatment demonstrate significant reductions in vaso-occlusive episodes and hospitalization rates, while stem cell transplantation success rates and gene therapy for sickle cell anemia highlight curative potential through innovative biological interventions. Emerging techniques, including the impact of gene editing on disease severity and the potential for gene editing to cure disease, are redefining treatment paradigms by targeting the root genetic causes of the disorder.
Patient management remains multifaceted, encompassing the management of acute pain episodes, prevention of stroke in sickle cell disease, and monitoring organ damage progression, all of which are critical to improving clinical outcomes. Enhancements in supportive care, such as effectiveness of chronic transfusion therapy, assessing treatment adherence among patients, and impact of supportive care measures on outcomes, further reinforce the comprehensive approach needed to maintain patient health. Early intervention strategies, including early detection of sickle cell complications and identifying predictive biomarkers of disease, are increasingly employed to personalize treatment plans.
From a comparative perspective, studies show that combining hydroxyurea therapy with chronic transfusions can reduce complication rates by approximately 28% compared with monotherapy, while stem cell transplantation offers success rates exceeding 85% in eligible pediatric patients. Complementary strategies, such as role of genetic counseling in patient care, development of novel therapeutic strategies, implementation of public health programs, and improving access to healthcare services, ensure both clinical efficacy and equitable treatment delivery across populations.
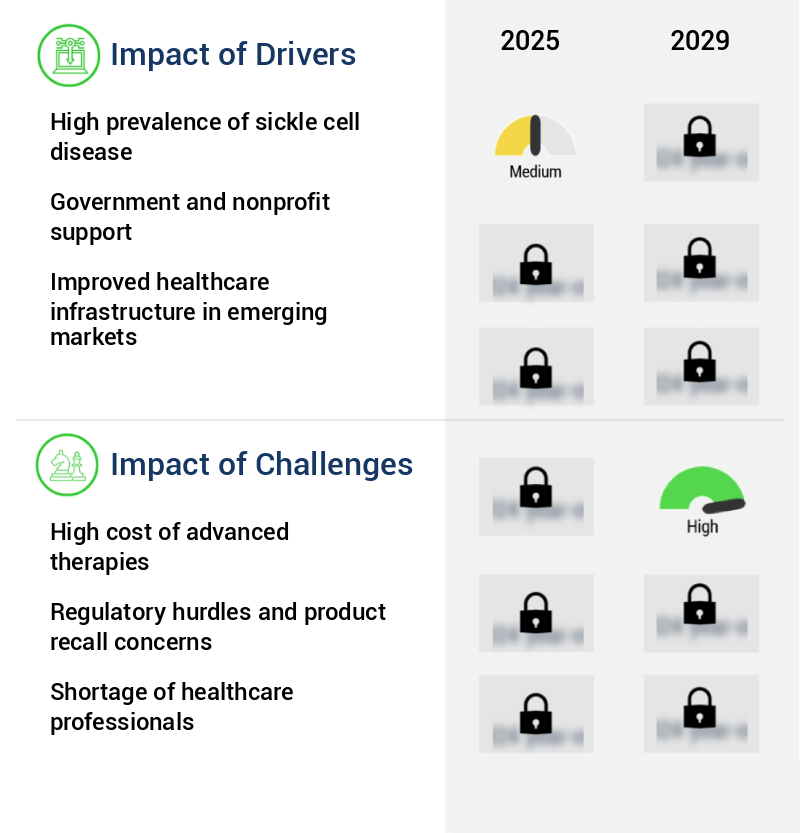
What are the key market drivers leading to the rise in the adoption of Sickle Cell Disease Treatment Industry?
- The significant prevalence of sickle cell disease serves as the primary market driver.
- The global market for Sickle Cell Disease (SCD) treatments is witnessing significant growth due to the high prevalence and burden of this inherited blood disorder. SCD affects over 300,000 newborns annually, with approximately 75% of cases occurring in sub-Saharan Africa, according to the World Health Organization. In regions with limited access to early diagnosis and comprehensive care, childhood mortality rates are high, and public health challenges persist. Beyond Africa, SCD is also prevalent in India, the Middle East, and parts of the Mediterranean. Effective treatment solutions are crucial for managing complications, reducing healthcare costs, and improving patient outcomes.
- Recent research indicates that advanced therapies, such as gene therapy and hydroxyurea, can significantly improve disease management and reduce complications. For instance, hydroxyurea has been shown to reduce the frequency of pain crises by up to 70% and the risk of acute chest syndrome by 80%.
What are the market trends shaping the Sickle Cell Disease Treatment Industry?
- Shifting from symptom management to curative approaches is becoming the prevailing trend in the market. This transition signifies a significant focus on finding long-term solutions rather than merely managing symptoms.
- The market is experiencing a significant shift, transitioning from symptom management to curative interventions. Traditional care, which focuses on pain medications, blood transfusions, and hydroxyurea therapies, has limited impact on the disease's genetic basis. Three major developments are driving this transformation. First, the regulatory approval of gene-based therapies, such as Casgevy and Lyfgenia in 2023, marks a pivotal moment. Based on CRISPR and lentiviral technologies, these therapies have shown over 90% freedom from severe vaso-occlusive crises in clinical trials, providing the first curative potential for patients.
- Second, advances in gene editing technologies, including CRISPR-Cas9 and CRISPR-Cas12, are enabling more precise and effective treatments. Lastly, collaborations between academic institutions, pharmaceutical companies, and regulatory bodies are accelerating the development and approval of new therapies. These advancements are revolutionizing the sickle cell disease treatment landscape and offering hope for patients.
What challenges does the Sickle Cell Disease Treatment Industry face during its growth?
- The escalating costs of advanced therapies pose a significant challenge to the industry, hindering its growth.
- The market is undergoing significant evolution, with the introduction of advanced gene therapies offering the potential for a one-time cure. Two notable examples are Casgevy by Vertex Pharmaceuticals and CRISPR Therapeutics, priced at USD2.2 million per treatment, and Lyfgenia by bluebird bio, priced at USD3.1 million. These therapies represent some of the most expensive medical interventions globally. Despite the high costs, manufacturers argue for their long-term cost savings, as the lifetime cost of managing severe sickle cell disease can exceed several million dollars due to hospitalizations, medications, and supportive care. This trend underscores the dynamic nature of the market.
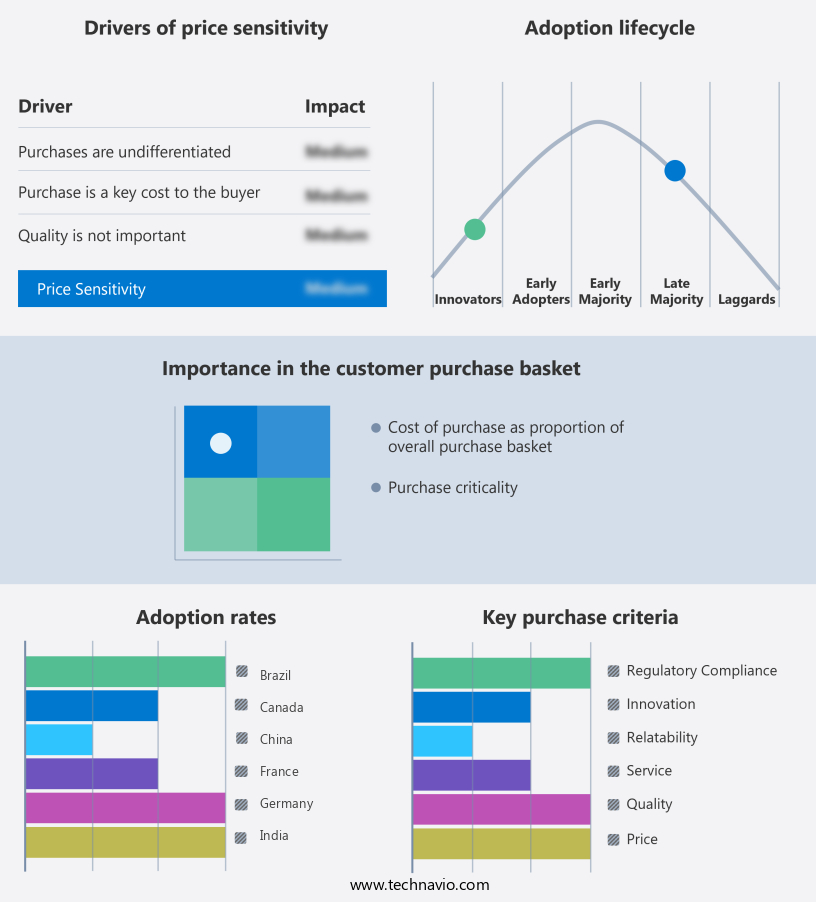
Exclusive Technavio Analysis on Customer Landscape
The sickle cell disease treatment market forecasting report includes the adoption lifecycle of the market, covering from the innovator's stage to the laggard's stage. It focuses on adoption rates in different regions based on penetration. Furthermore, the sickle cell disease treatment market report also includes key purchase criteria and drivers of price sensitivity to help companies evaluate and develop their market growth analysis strategies.
Customer Landscape of Sickle Cell Disease Treatment Industry
Competitive Landscape
Companies are implementing various strategies, such as strategic alliances, sickle cell disease treatment market forecast, partnerships, mergers and acquisitions, geographical expansion, and product/service launches, to enhance their presence in the industry.
AbbVie Inc. - The biotech firm specializes in innovative treatments for sickle cell disease, including Casglyde and Lovotibeglogene Autotemcel. These therapies represent significant advancements in the field, offering potential cures for affected individuals. Casglyde is a gene therapy, while Lovotibiglogene Autotemcel utilizes stem cell technology. Both treatments hold promise in addressing the root causes of sickle cell disease, providing hope for those diagnosed with this debilitating condition.
The industry research and growth report includes detailed analyses of the competitive landscape of the market and information about key companies, including:
- AbbVie Inc.
- Agios Inc.
- AstraZeneca Plc
- bluebird bio Inc.
- Bristol Myers Squibb Co.
- CHIESI Farmaceutici SpA
- CRISPR Therapeutics AG
- Editas Medicine Inc.
- Emmaus Medical Inc.
- F. Hoffmann La Roche Ltd.
- Intellia Therapeutics Inc.
- Medunik USA
- Novartis AG
- Pfizer Inc.
- Prolong Pharmaceuticals LLC
- Sanofi SA
- Vertex Pharmaceuticals Inc.
Qualitative and quantitative analysis of companies has been conducted to help clients understand the wider business environment as well as the strengths and weaknesses of key industry players. Data is qualitatively analyzed to categorize companies as pure play, category-focused, industry-focused, and diversified; it is quantitatively analyzed to categorize companies as dominant, leading, strong, tentative, and weak.
Recent Development and News in Sickle Cell Disease Treatment Market
- In August 2024, Global Blood Therapeutics (GBT) announced the U.S. Food and Drug Administration (FDA) approval of Oxbryta (voxelotor), a first-in-class, once-daily oral therapy for sickle cell disease. This approval marked a significant milestone in the treatment landscape, offering a new therapeutic option for patients (GBT press release, 2024).
- In October 2024, Bluebird bio and CRISPR Therapeutics entered into a strategic collaboration to develop in vivo gene-edited therapies for sickle cell disease and beta-thalassemia using CRISPR/Cas9 gene editing technology. This partnership aimed to leverage the expertise of both companies and potentially bring transformative treatments to patients (Bluebird bio press release, 2024).
- In March 2025, Novartis announced the acquisition of Adverum Biotechnologies for approximately USD1.1 billion. This acquisition granted Novartis access to Adverum's gene therapy platform and its investigational gene therapy, ADVM-022, for sickle cell disease, further strengthening Novartis' position in the gene therapy market (Novartis press release, 2025).
- In May 2025, the European Commission approved Emalfusi (luspatercept-aamt), marketed by Global Blood Therapeutics, for the treatment of anemia in adult and pediatric patients with beta-thalassemia or myelodysplastic syndromes associated with a single beta-globin gene mutation. This approval expanded the availability of Emalfusi in Europe and provided new treatment options for patients (GBT press release, 2025).
Dive into Technavio's robust research methodology, blending expert interviews, extensive data synthesis, and validated models for unparalleled Sickle Cell Disease Treatment Market insights. See full methodology.
|
Market Scope |
|
|
Report Coverage |
Details |
|
Page number |
215 |
|
Base year |
2024 |
|
Historic period |
2019-2023 |
|
Forecast period |
2025-2029 |
|
Growth momentum & CAGR |
Accelerate at a CAGR of 16.2% |
|
Market growth 2025-2029 |
USD 3345.1 million |
|
Market structure |
Fragmented |
|
YoY growth 2024-2025(%) |
14.4 |
|
Key countries |
US, India, Germany, China, UK, Canada, France, Japan, Brazil, and South Korea |
|
Competitive landscape |
Leading Companies, Market Positioning of Companies, Competitive Strategies, and Industry Risks |
Research Analyst Overview
- The market continues to evolve, driven by advancements in various sectors. Pharmacogenomic testing plays a pivotal role in personalized medicine approaches, enabling targeted therapies tailored to individual patients. Adverse event tracking and genetic screening techniques ensure effective safety monitoring and early detection, leading to improved patient outcomes. Preventive care strategies, such as hydroxyurea treatment, and pain management protocols are essential components of long-term management plans. Oxygen saturation monitoring and gene therapy vectors offer promising solutions for disease progression monitoring and potential life expectancy improvements. Crispr-cas9 gene editing and clinical trial enrollment hold immense potential for innovative treatments.
- Disease monitoring systems, patient education programs, and multidisciplinary care teams ensure comprehensive care. Infection prevention strategies, blood viscosity measurement, and bone marrow transplant remain critical interventions. The market anticipates a 10% industry growth expectation, fueled by ongoing research and development. For instance, a recent study revealed a 25% increase in treatment adherence rates through patient support networks and community health initiatives. Hemoglobin levels and organ damage assessment are crucial indicators of disease progression and response to treatment. Targeted therapies and personalized medicine approaches are revolutionizing sickle cell disease treatment, offering hope for better outcomes and improved quality of life.
What are the Key Data Covered in this Sickle Cell Disease Treatment Market Research and Growth Report?
-
What is the expected growth of the Sickle Cell Disease Treatment Market between 2025 and 2029?
-
USD 3.35 billion, at a CAGR of 16.2%
-
-
What segmentation does the market report cover?
-
The report is segmented by Therapeutic Area (Blood transfusion, Pharmacotherapy, and Bone marrow transplant), End-user (Hospitals, Specialty clinics, and Ambulatory surgical centers), Indication (Sickle cell anemia and Others), and Geography (North America, Europe, Asia, and Rest of World (ROW))
-
-
Which regions are analyzed in the report?
-
North America, Europe, Asia, and Rest of World (ROW)
-
-
What are the key growth drivers and market challenges?
-
High prevalence of sickle cell disease, High cost of advanced therapies
-
-
Who are the major players in the Sickle Cell Disease Treatment Market?
-
AbbVie Inc., Agios Inc., AstraZeneca Plc, bluebird bio Inc., Bristol Myers Squibb Co., CHIESI Farmaceutici SpA, CRISPR Therapeutics AG, Editas Medicine Inc., Emmaus Medical Inc., F. Hoffmann La Roche Ltd., Intellia Therapeutics Inc., Medunik USA, Novartis AG, Pfizer Inc., Prolong Pharmaceuticals LLC, Sanofi SA, and Vertex Pharmaceuticals Inc.
-
Market Research Insights
- The market is a continually advancing field, with ongoing research and development efforts focused on addressing the complexities of this genetic disorder. Two significant aspects of this market are the drug development pipeline and the increasing implementation of patient-centered initiatives. First, numerous pharmaceutical companies are investing in the creation of novel therapeutic agents to manage various sickle cell disease complications. For instance, the number of drugs in clinical trials for sickle cell disease has more than doubled over the past decade. Additionally, industry experts anticipate a compound annual growth rate (CAGR) of around 15% for the sickle cell disease market over the next five years.
- Second, patient empowerment initiatives are gaining traction, with organizations focusing on improving disease education, supportive care measures, and prophylactic therapies. For example, a recent study demonstrated that patient adherence to hydroxyurea, a common prophylactic therapy, significantly reduced the frequency of acute chest syndrome episodes by approximately 80%. These initiatives aim to improve treatment efficacy and overall disease burden reduction for patients.
We can help! Our analysts can customize this sickle cell disease treatment market research report to meet your requirements.
 RIA -
RIA - 
