Small Molecule API Market Analysis North America, Asia, Europe, Rest of World (ROW) - US, Canada, China, Japan, India, UK, South Korea, Germany, Italy, France - Size and Forecast 2024-2028

Small Molecule API Market Analysis North America, Asia, Europe, Rest of World (ROW) - US, Canada, China, Japan, India, UK, South Korea, Germany, Italy, France - Size and Forecast 2024-2028

Published: Nov 2024 159 Pages SKU: IRTNTR71969

Market Overview at a Glance

$67.3 B
Market Opportunity
7.5%
CAGR
6.8
YoY growth 2023-2024(%)

Small Molecule API Market Size 2024-2028 

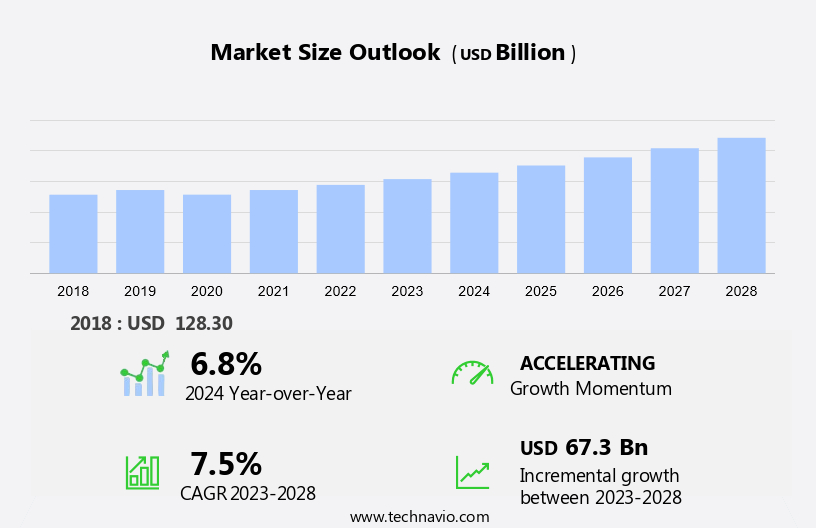
The small molecule API market size is forecast to increase by USD 67.3 billion at a CAGR of 7.5% between 2023 and 2028.

  • The market is experiencing significant changes, driven by the shifting landscape of drug development and manufacturing. In developing countries, the small-molecule API manufacturing scenario is evolving, offering cost advantages to contract manufacturers. The increasing geriatric population is fueling demand for small molecule APIs in various therapeutic areas, including diabetes and cancer treatments.
  • However, high investment costs and the risk of substantial financial losses are major challenges. Pharmaceutical companies are responding by adopting different manufacturing strategies, such as captive manufacturing and merchant manufacturing, to mitigate risks and optimize costs. Biologics and branded drugs continue to dominate the market, but the trend towards generic drugs is gaining momentum. This dynamic market requires continuous monitoring and strategic planning from industry players to stay competitive.

What will be the Size of the Market During the Forecast Period?

Small Molecule API Market Size

 Request Free Sample

  • The small molecule Active Pharmaceutical Ingredients (API) market is a significant segment within the pharmaceutical industry, supplying essential components for drug formulation in various therapeutic areas. This market is driven by several factors, including patent expiry of branded drugs, advancements in the drug development process, and the increasing demand for specialty medicines. Raw materials play a crucial role in the synthesis of APIs. Novel technologies, such as computational modeling and natural extraction, are being employed to improve the efficiency and sustainability of chemical synthesis. Contract manufacturers have been increasingly adopting these technologies to cater to the growing demand for APIs in the pharmaceutical sector.
  • Additionally, the drug development process involves several stages, including discovery, development, and commercialization. The API stage is a critical component of this process, as it directly impacts the efficacy and safety of the final drug product. In the context of small molecule APIs, synthetic methods are widely used to produce these ingredients. The therapeutic areas that witness high demand for small molecule APIs include oncology, cardiovascular diseases, diabetes, and chronic diseases. The increasing prevalence of these diseases and the need for effective treatments have fueled the growth of the market. Biotechnology and natural extraction are alternative methods for producing APIs.
  • Also, biotechnology involves the use of living organisms to produce therapeutic proteins and other complex molecules, while natural extraction is the process of extracting active compounds from natural sources. Both methods have their advantages and limitations and are used depending on the specific therapeutic area and the nature of the API. Branded drugs and generic drugs differ in their regulatory requirements and market positioning. Branded drugs are innovative treatments with patent protection, while generic drugs are copies of existing drugs with the same active ingredient but different branding and pricing. Captive manufacturing is a strategy employed by some pharmaceutical companies to ensure a consistent supply of APIs for their branded drugs. In conclusion, the market is a dynamic and evolving sector within the pharmaceutical industry. Patent expiry, advancements in the drug development process, and the increasing demand for specialty medicines are some of the key drivers of this market. The use of novel technologies, such as computational modeling and natural extraction, and the adoption of synthetic methods are essential to meet the growing demand for APIs in various therapeutic areas.

How is this market segmented and which is the largest segment?

The market research report provides comprehensive data (region-wise segment analysis), with forecasts and estimates in "USD billion" for the period 2024-2028, as well as historical data from 2018-2022 for the following segments.

  • Deployment
    • Captive APIs
    • Contract APIs
  • Geography
    • North America
      • Canada
      • US
    • Asia
      • China
      • India
      • Japan
      • South Korea
    • Europe
      • Germany
      • UK
      • France
      • Italy
    • Rest of World (ROW)

By Deployment Insights

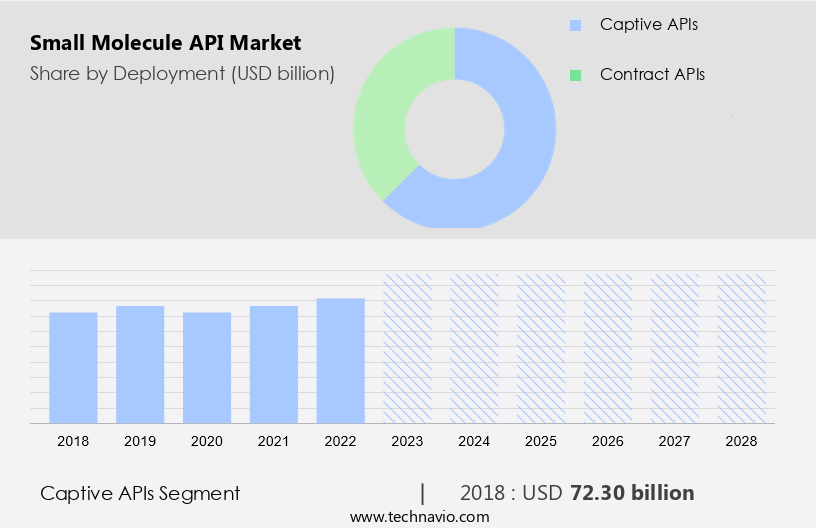
  • The captive APIs segment is estimated to witness significant growth during the forecast period.

The market experienced significant growth in 2023, with the captive API manufacturing segment holding the largest share. The expanding healthcare sector in the United States has fueled this growth, as there is a heightened emphasis on making healthcare services more accessible and affordable. This demand for affordable medicines has resulted in an increased need for low-cost small molecule APIs, which are essential for the production of finished drugs. In response, pharmaceutical companies are increasingly turning to Contract Manufacturing Organizations (CMOs) to outsource the manufacturing of either bulk actives or late-stage intermediates. This trend is particularly prominent in the therapeutic areas of chronic diseases, such as cancer and cardiovascular diseases, where the need for affordable treatments is particularly high.

To meet this demand, companies are utilizing various techniques, including chemical synthesis and natural extraction, as well as advanced tools like computational modeling and biotechnology. The market is expected to continue its growth trajectory in the coming years, driven by the increasing focus on developing new therapeutics and improving existing ones.

Small Molecule API Market Size

Get a glance at the market report of share of various segments Request Free Sample

The captive APIs segment was valued at USD 72.30 billion in 2018 and showed a gradual increase during the forecast period.

Regional Analysis

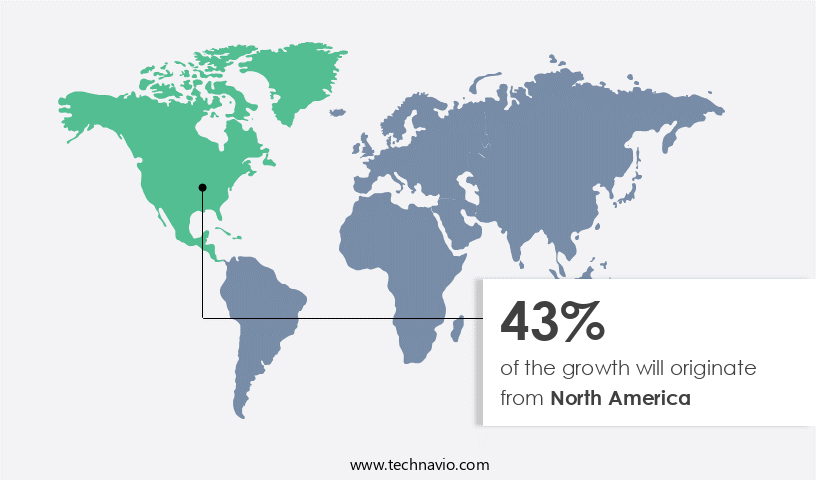
  • North America is estimated to contribute 43% to the growth of the global market during the forecast period.

Technavio's analysts have elaborately explained the regional trends and drivers that shape the market during the forecast period.

Small Molecule API Market Share by Geography

For more insights on the market share of various regions Request Free Sample

The North American small molecule APIs market is projected to expand during the forecast period, driven by the region's significant player base involved in bulk manufacturing activities. However, the strict regulatory environment in the US and Canada has limited the market share of emerging companies in the global small molecule APIs market. Factors such as the increasing geriatric population in the US and the growing prevalence of chronic diseases are fueling the demand for small-molecule APIs in the region. Additionally, the US government's increased healthcare expenditure is driving the development and production of innovative small-molecule APIs, contributing to market growth.

Market Dynamics

Our researchers analyzed the data with 2023 as the base year, along with the key drivers, trends, and challenges. A holistic analysis of drivers will help companies refine their marketing strategies to gain a competitive advantage.

What are the key market drivers leading to the rise in adoption of Small Molecule API Market?

The evolving small-molecule API manufacturing scenario in developing countries is the key driver of the market.

  • Small Molecule APIs, or active pharmaceutical ingredients, have become increasingly important in the drug development process as patent expiries on branded drugs create opportunities for contract manufacturers to produce these essential components. China and other emerging economies, such as India, have emerged as significant suppliers of raw materials for Small Molecule APIs due to their cost-effective manufacturing capabilities. In the late 1980s and early 1990s, Chinese manufacturers primarily focused on producing large volumes of low-cost drugs, mainly through fermentation and simple synthetic compounds.
  • However, China's economic evolution and entry into the World Trade Organization have led to a more competitive environment for local drug manufacturers. As a result, there has been a shift towards custom manufacturing, which was once prohibited but is now seen as an efficient way to accelerate the learning curve for producing high-quality Small Molecule APIs for regulated markets. Novel technologies, such as Molnupiravir, are also driving demand for Small Molecule APIs in the development of specialty medicines. 

What are the market trends shaping the Small Molecule API Market?

The increasing geriatric population is the upcoming trend in the market.

  • The market in the United States is poised for growth due to the rising prevalence of chronic diseases among the aging population. As individuals age, they become more susceptible to conditions such as diabetes, cancer, and cardiovascular diseases. These health issues necessitate the development and production of small molecule APIs for the manufacturing of branded and generic drugs. Contract manufacturers play a crucial role in meeting the demand for these APIs.
  • Additionally, they offer services ranging from captive manufacturing to merchant manufacturing, ensuring a steady supply of high-quality APIs for drug development. The focus on medication management for the elderly population, particularly those with comorbidities, is driving the need for effective and efficient production processes. In the US healthcare landscape, both branded and generic drugs are essential for managing chronic conditions. Small molecule APIs are the building blocks for these medications, making them a vital component of the pharmaceutical industry. With the increasing burden of chronic diseases, the demand for these APIs is expected to continue growing, offering significant opportunities for market participants.

What challenges does Small Molecule API Market face during the growth?

High investment costs and concerns of huge financial loss are key challenges affecting the market growth.

  • Small-molecule Active Pharmaceutical Ingredients (APIs) are a crucial component of various therapeutics, including those used in biotech for targeted therapies in cardiology for cardiovascular conditions and oncology for cancer drugs. CDMOs (Contract Development and Manufacturing Organizations) play a significant role in the production of these APIs. India and China, with their low production costs, have experienced rapid growth in small-molecule API manufacturing. However, the high regulatory scrutiny in these countries, particularly in Asia, can result in quality issues due to the intense manufacturing pressure.
  • Also, the US market for pharmaceuticals is highly regulated, ensuring proper development, approval, manufacturing, and commercialization of pharmaceutical products. The expansion of the generic industry and the global chemical and pharmaceutical industries have led to a substantial increase in the production of bulk actives outside the US. Despite the regulatory framework, the demand for small-molecule APIs continues to grow due to the increasing prevalence of chronic diseases. The biotech industry's focus on targeted therapies and the development of new cancer drugs further boosts the market's growth. CDMOs play a vital role in meeting this demand while maintaining the highest quality standards.

Exclusive Customer Landscape

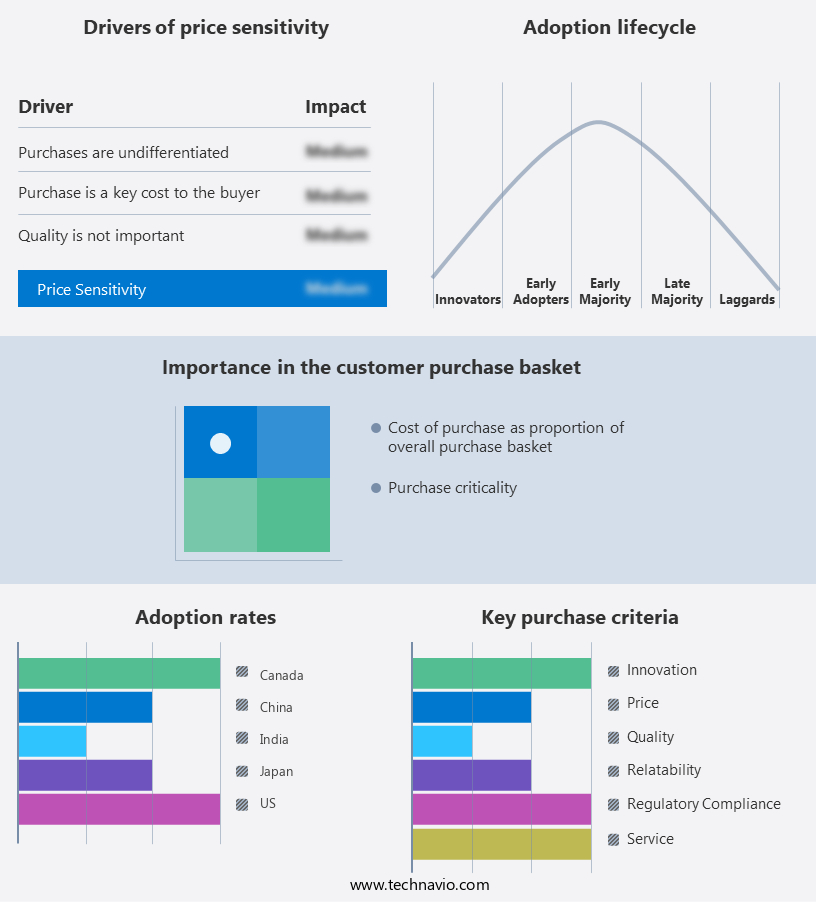
The market forecasting report includes the adoption lifecycle of the market, covering from the innovator's stage to the laggard's stage. It focuses on adoption rates in different regions based on penetration. Furthermore, the market report also includes key purchase criteria and drivers of price sensitivity to help companies evaluate and develop their market growth analysis strategies.

Small Molecule API Market Share by Geography

 Customer Landscape

Key Companies & Market Insights

Companies are implementing various strategies, such as strategic alliances, market forecast, partnerships, mergers and acquisitions, geographical expansion, and product/service launches, to enhance their presence in the market.

The market research and growth report includes detailed analyses of the competitive landscape of the market and information about key companies, including:

  • Amneal Pharmaceuticals Inc.
  • Aurobindo Pharma Ltd.
  • Cambrex Corp.
  • Cipla Inc.
  • Corden Pharma International GmbH
  • Dishman Carbogen Amcis Ltd.
  • Dr Reddys Laboratories Ltd.
  • Gilead Sciences Inc.
  • GlaxoSmithKline Plc
  • Johnson Matthey Plc
  • Lonza Group Ltd.
  • Merck KGaA
  • Novartis AG
  • Novasep Holding SAS
  • Pfizer Inc.
  • Sun Pharmaceutical Industries Ltd.
  • Teva Pharmaceutical Industries Ltd.
  • Thermo Fisher Scientific Inc.
  • Viatris Inc.
  • WuXi AppTec Co. Ltd.

Qualitative and quantitative analysis of companies has been conducted to help clients understand the wider business environment as well as the strengths and weaknesses of key market players. Data is qualitatively analyzed to categorize companies as pure play, category-focused, industry-focused, and diversified; it is quantitatively analyzed to categorize companies as dominant, leading, strong, tentative, and weak.

Research Analyst Overview

Small molecule APIs, or active pharmaceutical ingredients, play a crucial role in the pharmaceutical industry by serving as the essential components of various therapeutic medicines. The market is witnessing significant growth due to the patent expiry of several blockbuster drugs, leading to an increase in demand for alternative sources of these essential ingredients. The drug development process involves the synthesis of small molecule APIs through various methods such as chemical synthesis and natural extraction. Contract manufacturers specializing in CDMOs (Contract Development and Manufacturing Organizations) and CMOs (Contract Manufacturing Organizations) are key players in the production of small molecule APIs for pharmaceutical and biotech companies.

Moreover, novel technologies, such as computational modeling and targeted therapies, are being employed to discover new molecular entities (NMEs) and develop cost-effective drugs for chronic diseases, including cardiovascular conditions, cancer, and diabetes. These therapeutic areas continue to attract significant investment due to their high unmet medical needs. The production of small molecule APIs for specialty medicines, such as oncology drugs and cardiology treatments, requires specialized expertise and advanced technologies. Biotech companies are increasingly partnering with CDMOs to leverage their capabilities in synthetic and captive manufacturing for the production of these complex APIs. The healthcare system's focus on patient-centric care and personalized treatments is driving the demand for precision medicine and biosimilars. These trends are expected to shape the future of the market, as the industry continues to innovate and meet the evolving health needs of patients.

Market Scope

Report Coverage

Details

Page number

159

Base year

2023

Historic period

2018-2022

Forecast period

2024-2028

Growth momentum & CAGR

Accelerate at a CAGR of 7.5%

Market growth 2024-2028

USD 67.3 billion

Market structure

Fragmented

YoY growth 2023-2024(%)

6.8

Key countries

US, Canada, China, Japan, India, UK, South Korea, Germany, Italy, and France

Competitive landscape

Leading Companies, Market Positioning of Companies, Competitive Strategies, and Industry Risks

Request Free Sample

What are the Key Data Covered in this Market Research and Growth Report?

  • CAGR of the market during the forecast period
  • Detailed information on factors that will drive the market growth and forecasting between 2024 and 2028
  • Precise estimation of the size of the market  and its contribution of the market in focus to the parent market
  • Accurate predictions about upcoming market growth and trends and changes in consumer behaviour
  • Growth of the market across North America, Asia, Europe, and Rest of World (ROW)
  • Thorough analysis of the market's competitive landscape and detailed information about companies
  • Comprehensive analysis of factors that will challenge the growth of market companies

We can help! Our analysts can customize this market research report to meet your requirements. Get in touch

1 Executive Summary

  • 1.1 Market overview
    • Executive Summary - Chart on Market Overview
    • Executive Summary - Data Table on Market Overview
    • Executive Summary - Chart on Global Market Characteristics
    • Executive Summary - Chart on Market by Geography
    • Executive Summary - Chart on Market Segmentation by Deployment
    • Executive Summary - Chart on Incremental Growth
    • Executive Summary - Data Table on Incremental Growth
    • Executive Summary - Chart on Company Market Positioning

2 Technavio Analysis

  • 2.1 Analysis of price sensitivity, lifecycle, customer purchase basket, adoption rates, and purchase criteria
    • Analysis of price sensitivity, lifecycle, customer purchase basket, adoption rates, and purchase criteria
  • 2.2 Criticality of inputs and Factors of differentiation
    • Overview on criticality of inputs and factors of differentiation
  • 2.3 Factors of disruption
    • Overview on factors of disruption
  • 2.4 Impact of drivers and challenges
    • Impact of drivers and challenges in 2023 and 2028

3 Market Landscape

  • 3.1 Market ecosystem
    • Parent Market
    • Data Table on - Parent Market
  • 3.2 Market characteristics
    • Market characteristics analysis
  • 3.3 Value chain analysis
    • Value Chain Analysis

4 Market Sizing

  • 4.1 Market definition
    • Offerings of companies included in the market definition
  • 4.2 Market segment analysis
    • Market segments
  • 4.3 Market size 2023
    • 4.4 Market outlook: Forecast for 2023-2028
      • Chart on Global - Market size and forecast 2023-2028 ($ billion)
      • Data Table on Global - Market size and forecast 2023-2028 ($ billion)
      • Chart on Global Market: Year-over-year growth 2023-2028 (%)
      • Data Table on Global Market: Year-over-year growth 2023-2028 (%)

    5 Historic Market Size

    • 5.1 Global Small Molecule API Market 2018 - 2022
      • Historic Market Size - Data Table on Global Small Molecule API Market 2018 - 2022 ($ billion)
    • 5.2 Deployment segment analysis 2018 - 2022
      • Historic Market Size - Deployment Segment 2018 - 2022 ($ billion)
    • 5.3 Geography segment analysis 2018 - 2022
      • Historic Market Size - Geography Segment 2018 - 2022 ($ billion)
    • 5.4 Country segment analysis 2018 - 2022
      • Historic Market Size - Country Segment 2018 - 2022 ($ billion)

    6 Five Forces Analysis

    • 6.1 Five forces summary
      • Five forces analysis - Comparison between 2023 and 2028
    • 6.2 Bargaining power of buyers
      • Bargaining power of buyers - Impact of key factors 2023 and 2028
    • 6.3 Bargaining power of suppliers
      • Bargaining power of suppliers - Impact of key factors in 2023 and 2028
    • 6.4 Threat of new entrants
      • Threat of new entrants - Impact of key factors in 2023 and 2028
    • 6.5 Threat of substitutes
      • Threat of substitutes - Impact of key factors in 2023 and 2028
    • 6.6 Threat of rivalry
      • Threat of rivalry - Impact of key factors in 2023 and 2028
    • 6.7 Market condition
      • Chart on Market condition - Five forces 2023 and 2028

    7 Market Segmentation by Deployment

    • 7.1 Market segments
      • Chart on Deployment - Market share 2023-2028 (%)
      • Data Table on Deployment - Market share 2023-2028 (%)
    • 7.2 Comparison by Deployment
      • Chart on Comparison by Deployment
      • Data Table on Comparison by Deployment
    • 7.3 Captive APIs - Market size and forecast 2023-2028
      • Chart on Captive APIs - Market size and forecast 2023-2028 ($ billion)
      • Data Table on Captive APIs - Market size and forecast 2023-2028 ($ billion)
      • Chart on Captive APIs - Year-over-year growth 2023-2028 (%)
      • Data Table on Captive APIs - Year-over-year growth 2023-2028 (%)
    • 7.4 Contract APIs - Market size and forecast 2023-2028
      • Chart on Contract APIs - Market size and forecast 2023-2028 ($ billion)
      • Data Table on Contract APIs - Market size and forecast 2023-2028 ($ billion)
      • Chart on Contract APIs - Year-over-year growth 2023-2028 (%)
      • Data Table on Contract APIs - Year-over-year growth 2023-2028 (%)
    • 7.5 Market opportunity by Deployment
      • Market opportunity by Deployment ($ billion)
      • Data Table on Market opportunity by Deployment ($ billion)

    8 Customer Landscape

    • 8.1 Customer landscape overview
      • Analysis of price sensitivity, lifecycle, customer purchase basket, adoption rates, and purchase criteria

    9 Geographic Landscape

    • 9.1 Geographic segmentation
      • Chart on Market share by geography 2023-2028 (%)
      • Data Table on Market share by geography 2023-2028 (%)
    • 9.2 Geographic comparison
      • Chart on Geographic comparison
      • Data Table on Geographic comparison
    • 9.3 North America - Market size and forecast 2023-2028
      • Chart on North America - Market size and forecast 2023-2028 ($ billion)
      • Data Table on North America - Market size and forecast 2023-2028 ($ billion)
      • Chart on North America - Year-over-year growth 2023-2028 (%)
      • Data Table on North America - Year-over-year growth 2023-2028 (%)
    • 9.4 Asia - Market size and forecast 2023-2028
      • Chart on Asia - Market size and forecast 2023-2028 ($ billion)
      • Data Table on Asia - Market size and forecast 2023-2028 ($ billion)
      • Chart on Asia - Year-over-year growth 2023-2028 (%)
      • Data Table on Asia - Year-over-year growth 2023-2028 (%)
    • 9.5 Europe - Market size and forecast 2023-2028
      • Chart on Europe - Market size and forecast 2023-2028 ($ billion)
      • Data Table on Europe - Market size and forecast 2023-2028 ($ billion)
      • Chart on Europe - Year-over-year growth 2023-2028 (%)
      • Data Table on Europe - Year-over-year growth 2023-2028 (%)
    • 9.6 Rest of World (ROW) - Market size and forecast 2023-2028
      • Chart on Rest of World (ROW) - Market size and forecast 2023-2028 ($ billion)
      • Data Table on Rest of World (ROW) - Market size and forecast 2023-2028 ($ billion)
      • Chart on Rest of World (ROW) - Year-over-year growth 2023-2028 (%)
      • Data Table on Rest of World (ROW) - Year-over-year growth 2023-2028 (%)
    • 9.7 US - Market size and forecast 2023-2028
      • Chart on US - Market size and forecast 2023-2028 ($ billion)
      • Data Table on US - Market size and forecast 2023-2028 ($ billion)
      • Chart on US - Year-over-year growth 2023-2028 (%)
      • Data Table on US - Year-over-year growth 2023-2028 (%)
    • 9.8 Canada - Market size and forecast 2023-2028
      • Chart on Canada - Market size and forecast 2023-2028 ($ billion)
      • Data Table on Canada - Market size and forecast 2023-2028 ($ billion)
      • Chart on Canada - Year-over-year growth 2023-2028 (%)
      • Data Table on Canada - Year-over-year growth 2023-2028 (%)
    • 9.9 China - Market size and forecast 2023-2028
      • Chart on China - Market size and forecast 2023-2028 ($ billion)
      • Data Table on China - Market size and forecast 2023-2028 ($ billion)
      • Chart on China - Year-over-year growth 2023-2028 (%)
      • Data Table on China - Year-over-year growth 2023-2028 (%)
    • 9.10 Japan - Market size and forecast 2023-2028
      • Chart on Japan - Market size and forecast 2023-2028 ($ billion)
      • Data Table on Japan - Market size and forecast 2023-2028 ($ billion)
      • Chart on Japan - Year-over-year growth 2023-2028 (%)
      • Data Table on Japan - Year-over-year growth 2023-2028 (%)
    • 9.11 India - Market size and forecast 2023-2028
      • Chart on India - Market size and forecast 2023-2028 ($ billion)
      • Data Table on India - Market size and forecast 2023-2028 ($ billion)
      • Chart on India - Year-over-year growth 2023-2028 (%)
      • Data Table on India - Year-over-year growth 2023-2028 (%)
    • 9.12 UK - Market size and forecast 2023-2028
      • Chart on UK - Market size and forecast 2023-2028 ($ billion)
      • Data Table on UK - Market size and forecast 2023-2028 ($ billion)
      • Chart on UK - Year-over-year growth 2023-2028 (%)
      • Data Table on UK - Year-over-year growth 2023-2028 (%)
    • 9.13 South Korea - Market size and forecast 2023-2028
      • Chart on South Korea - Market size and forecast 2023-2028 ($ billion)
      • Data Table on South Korea - Market size and forecast 2023-2028 ($ billion)
      • Chart on South Korea - Year-over-year growth 2023-2028 (%)
      • Data Table on South Korea - Year-over-year growth 2023-2028 (%)
    • 9.14 Germany - Market size and forecast 2023-2028
      • Chart on Germany - Market size and forecast 2023-2028 ($ billion)
      • Data Table on Germany - Market size and forecast 2023-2028 ($ billion)
      • Chart on Germany - Year-over-year growth 2023-2028 (%)
      • Data Table on Germany - Year-over-year growth 2023-2028 (%)
    • 9.15 Italy - Market size and forecast 2023-2028
      • Chart on Italy - Market size and forecast 2023-2028 ($ billion)
      • Data Table on Italy - Market size and forecast 2023-2028 ($ billion)
      • Chart on Italy - Year-over-year growth 2023-2028 (%)
      • Data Table on Italy - Year-over-year growth 2023-2028 (%)
    • 9.16 France - Market size and forecast 2023-2028
      • Chart on France - Market size and forecast 2023-2028 ($ billion)
      • Data Table on France - Market size and forecast 2023-2028 ($ billion)
      • Chart on France - Year-over-year growth 2023-2028 (%)
      • Data Table on France - Year-over-year growth 2023-2028 (%)
    • 9.17 Market opportunity by geography
      • Market opportunity by geography ($ billion)
      • Data Tables on Market opportunity by geography ($ billion)

    10 Drivers, Challenges, and Opportunity/Restraints

    • 10.1 Market drivers
      • 10.2 Market challenges
        • 10.3 Impact of drivers and challenges
          • Impact of drivers and challenges in 2023 and 2028
        • 10.4 Market opportunities/restraints

          11 Competitive Landscape

          • 11.1 Overview
            • 11.2 Competitive Landscape
              • Overview on criticality of inputs and factors of differentiation
            • 11.3 Landscape disruption
              • Overview on factors of disruption
            • 11.4 Industry risks
              • Impact of key risks on business

            12 Competitive Analysis

            • 12.1 Companies profiled
              • Companies covered
            • 12.2 Company ranking index
              • Company ranking index
            • 12.3 Market positioning of companies
              • Matrix on companies position and classification
            • 12.4 Aurobindo Pharma Ltd.
              • Aurobindo Pharma Ltd. - Overview
              • Aurobindo Pharma Ltd. - Product / Service
              • Aurobindo Pharma Ltd. - Key offerings
              • SWOT
            • 12.5 Cambrex Corp.
              • Cambrex Corp. - Overview
              • Cambrex Corp. - Product / Service
              • Cambrex Corp. - Key news
              • Cambrex Corp. - Key offerings
              • SWOT
            • 12.6 Cipla Inc.
              • Cipla Inc. - Overview
              • Cipla Inc. - Business segments
              • Cipla Inc. - Key news
              • Cipla Inc. - Key offerings
              • Cipla Inc. - Segment focus
              • SWOT
            • 12.7 Dr Reddys Laboratories Ltd.
              • Dr Reddys Laboratories Ltd. - Overview
              • Dr Reddys Laboratories Ltd. - Business segments
              • Dr Reddys Laboratories Ltd. - Key news
              • Dr Reddys Laboratories Ltd. - Key offerings
              • Dr Reddys Laboratories Ltd. - Segment focus
              • SWOT
            • 12.8 GlaxoSmithKline Plc
              • GlaxoSmithKline Plc - Overview
              • GlaxoSmithKline Plc - Business segments
              • GlaxoSmithKline Plc - Key news
              • GlaxoSmithKline Plc - Key offerings
              • GlaxoSmithKline Plc - Segment focus
              • SWOT
            • 12.9 Merck KGaA
              • Merck KGaA - Overview
              • Merck KGaA - Business segments
              • Merck KGaA - Key news
              • Merck KGaA - Key offerings
              • Merck KGaA - Segment focus
              • SWOT
            • 12.10 Novartis AG
              • Novartis AG - Overview
              • Novartis AG - Business segments
              • Novartis AG - Key news
              • Novartis AG - Key offerings
              • Novartis AG - Segment focus
              • SWOT
            • 12.11 Pfizer Inc.
              • Pfizer Inc. - Overview
              • Pfizer Inc. - Product / Service
              • Pfizer Inc. - Key news
              • Pfizer Inc. - Key offerings
              • SWOT
            • 12.12 Teva Pharmaceutical Industries Ltd.
              • Teva Pharmaceutical Industries Ltd. - Overview
              • Teva Pharmaceutical Industries Ltd. - Business segments
              • Teva Pharmaceutical Industries Ltd. - Key news
              • Teva Pharmaceutical Industries Ltd. - Key offerings
              • Teva Pharmaceutical Industries Ltd. - Segment focus
              • SWOT
            • 12.13 Viatris Inc.
              • Viatris Inc. - Overview
              • Viatris Inc. - Business segments
              • Viatris Inc. - Key news
              • Viatris Inc. - Key offerings
              • Viatris Inc. - Segment focus
              • SWOT

            13 Appendix

            • 13.1 Scope of the report
              • 13.2 Inclusions and exclusions checklist
                • Inclusions checklist
                • Exclusions checklist
              • 13.3 Currency conversion rates for US$
                • Currency conversion rates for US$
              • 13.4 Research methodology
                • Research methodology
              • 13.5 Data procurement
                • Information sources
              • 13.6 Data validation
                • Data validation
              • 13.7 Validation techniques employed for market sizing
                • Validation techniques employed for market sizing
              • 13.8 Data synthesis
                • Data synthesis
              • 13.9 360 degree market analysis
                • 360 degree market analysis
              • 13.10 List of abbreviations
                • List of abbreviations

              Research Methodology

              Technavio presents a detailed picture of the market by way of study, synthesis, and summation of data from multiple sources. The analysts have presented the various facets of the market with a particular focus on identifying the key industry influencers. The data thus presented is comprehensive, reliable, and the result of extensive research, both primary and secondary.

              INFORMATION SOURCES

              Primary sources

              • Manufacturers and suppliers
              • Channel partners
              • Industry experts
              • Strategic decision makers

              Secondary sources

              • Industry journals and periodicals
              • Government data
              • Financial reports of key industry players
              • Historical data
              • Press releases

              DATA ANALYSIS

              Data Synthesis

              • Collation of data
              • Estimation of key figures
              • Analysis of derived insights

              Data Validation

              • Triangulation with data models
              • Reference against proprietary databases
              • Corroboration with industry experts

              REPORT WRITING

              Qualitative

              • Market drivers
              • Market challenges
              • Market trends
              • Five forces analysis

              Quantitative

              • Market size and forecast
              • Market segmentation
              • Geographical insights
              • Competitive landscape

              Interested in this report?

              Get your sample now to see our research methodology and insights!

              Download Now

              Frequently Asked Questions

              Small Molecule API market growth will increase by $ 67.3 bn during 2024-2028 .

              The Small Molecule API market is expected to grow at a CAGR of 7.5% during 2024-2028 .

              Small Molecule API market is segmented by Deployment( Captive APIs, Contract APIs)

              Amneal Pharmaceuticals Inc., Aurobindo Pharma Ltd., Cambrex Corp., Cipla Inc., Corden Pharma International GmbH, Dishman Carbogen Amcis Ltd., Dr Reddys Laboratories Ltd., Gilead Sciences Inc., GlaxoSmithKline Plc, Johnson Matthey Plc, Lonza Group Ltd., Merck KGaA, Novartis AG, Novasep Holding SAS, Pfizer Inc., Sun Pharmaceutical Industries Ltd., Teva Pharmaceutical Industries Ltd., Thermo Fisher Scientific Inc., Viatris Inc., WuXi AppTec Co. Ltd. are a few of the key vendors in the Small Molecule API market.

              North America will register the highest growth rate of 43% among the other regions. Therefore, the Small Molecule API market in North America is expected to garner significant business opportunities for the vendors during the forecast period.

              US, Canada, China, Japan, India, UK, South Korea, Germany, Italy, France

              • Evolving small-molecule API manufacturing scenario in developing countriesIndia and China are rapidly evolving as viable sources for key intermediates and bulk actives. In the late 1980s and early 1990s is the driving factor this market.
              • the majority of Chinese companies manufactured large volumes of low-cost drugs is the driving factor this market.
              • with many focusing on fermentation products and simple synthetic compounds. However is the driving factor this market.
              • nowadays is the driving factor this market.
              • the pharmaceutical manufacturing scenario in China has completely changed is the driving factor this market.
              • owing to the economic evolution and its entry into the World Trade Organization is the driving factor this market.
              • which is anticipated to expose local drug manufacturers to a significantly more competitive environment. This is the driving factor this market.
              • in turn is the driving factor this market.
              • has resulted in increased custom manufacturing is the driving factor this market.
              • which was once prohibited by the Chinese regulatory authorities but is now seen as the most efficient way to accelerate the learning curve for producing high-quality small-molecule APIs or finished drug products for regulated markets. Therefore is the driving factor this market.
              • Chinese drug manufacturers are eager to work with foreign manufacturers to gain the expertise required to meet their specifications and achieve the goals of great technical skills and increased profitability.Considering the presence of developed infrastructure and growing economic development is the driving factor this market.
              • India and China have started producing high-quality small-molecule APIs and drug intermediates for regulated markets. Also is the driving factor this market.
              • innovators have started focusing on these countries for outsourcing late-stage intermediates is the driving factor this market.
              • and a few global manufacturers have formed joint ventures with local small-molecule API manufacturers. Furthermore is the driving factor this market.
              • it was observed that the innovators are increasingly partnering with local API manufacturers for high-quality bulk manufacturing activities is the driving factor this market.
              • particularly with those in developing countries is the driving factor this market.
              • owing to low development and production costs. For instance is the driving factor this market.
              • Koninklijke DSM N.V. has a subsidiary in China is the driving factor this market.
              • which is engaged in high-quality small-molecule API custom manufacturing. However is the driving factor this market.
              • innovators are more cautious about transferring their intellectual property to China is the driving factor this market.
              • and hence is the driving factor this market.
              • prefer to develop finished small-molecule API products in-house while relying on local manufacturers only for early small-molecule API intermediates or late-stage intermediates. Therefore is the driving factor this market.
              • China is playing a vital role in innovator outsourcing is the driving factor this market.
              • both directly and indirectly.On the other hand is the driving factor this market.
              • generic drug manufacturers are keen to work directly with Indian and Chinese small-molecule API manufacturers as the strategic outsourcing of APIs is necessary for obtaining high-profit margins is the driving factor this market.
              • while the transfer of intellectual property for preparing APIs is less of a concern than the main monograph for preparing the finished drug products. On average is the driving factor this market.
              • the manufacturing cost of APIs for generic oral solids is the driving factor this market.
              • such as tablets and capsules is the driving factor this market.
              • accounts for approximately 40%-50% of the production cost. In a highly competitive market is the driving factor this market.
              • where the ability to offer a low price is vital is the driving factor this market.
              • generic drug manufacturers seek competitive advantages by outsourcing bulk drug manufacturing activities to reliable small-molecule API manufacturers in developing countries that can deliver small-molecule APIs at a low cost. This is expected to drive the growth of the market during the forecast period. is the driving factor this market.

              The Small Molecule API market vendors should focus on grabbing business opportunities from the Captive APIs segment as it accounted for the largest market share in the base year.